


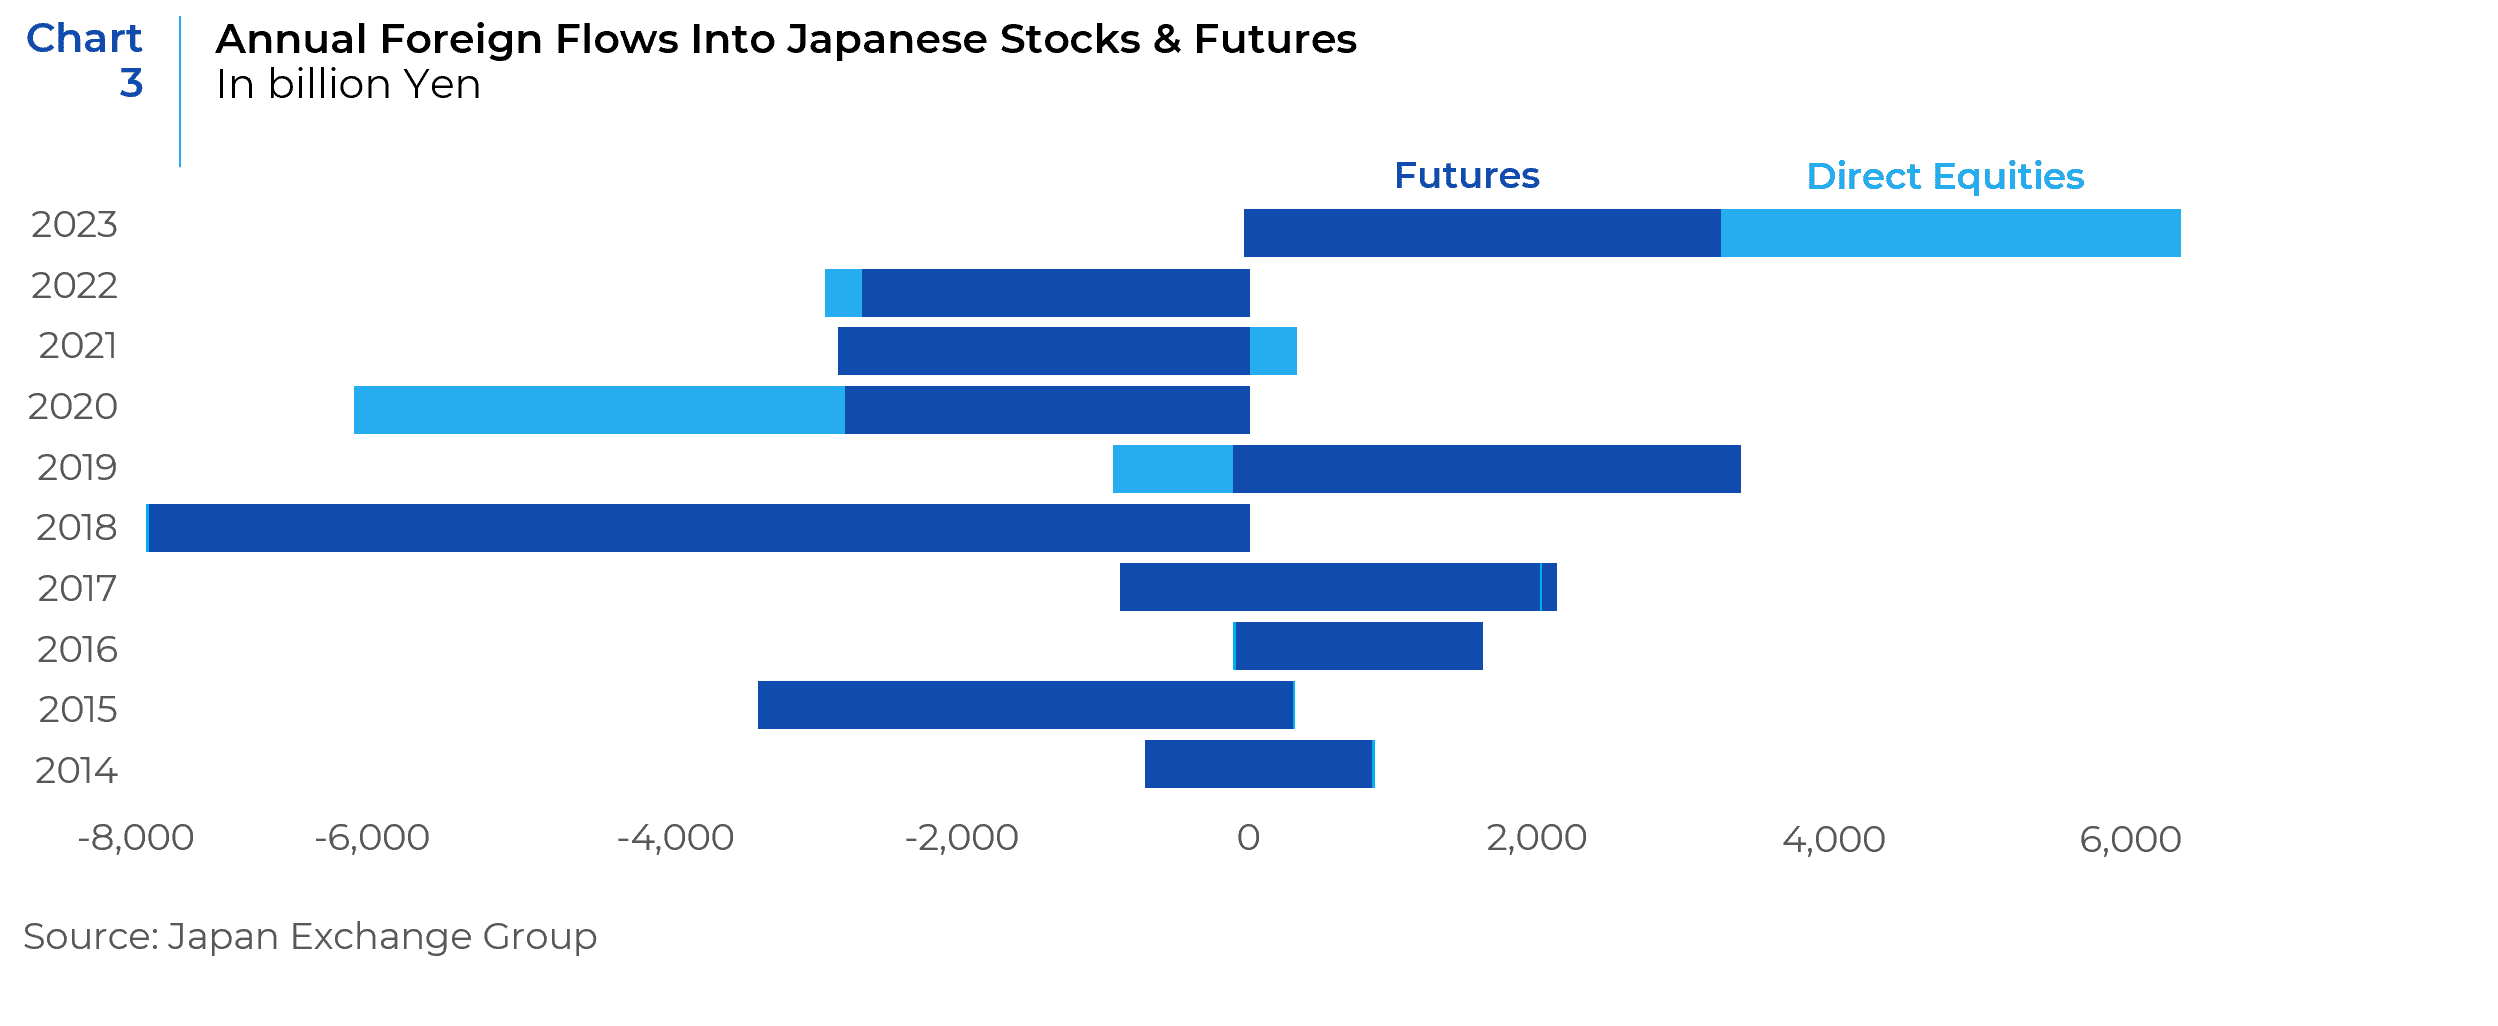
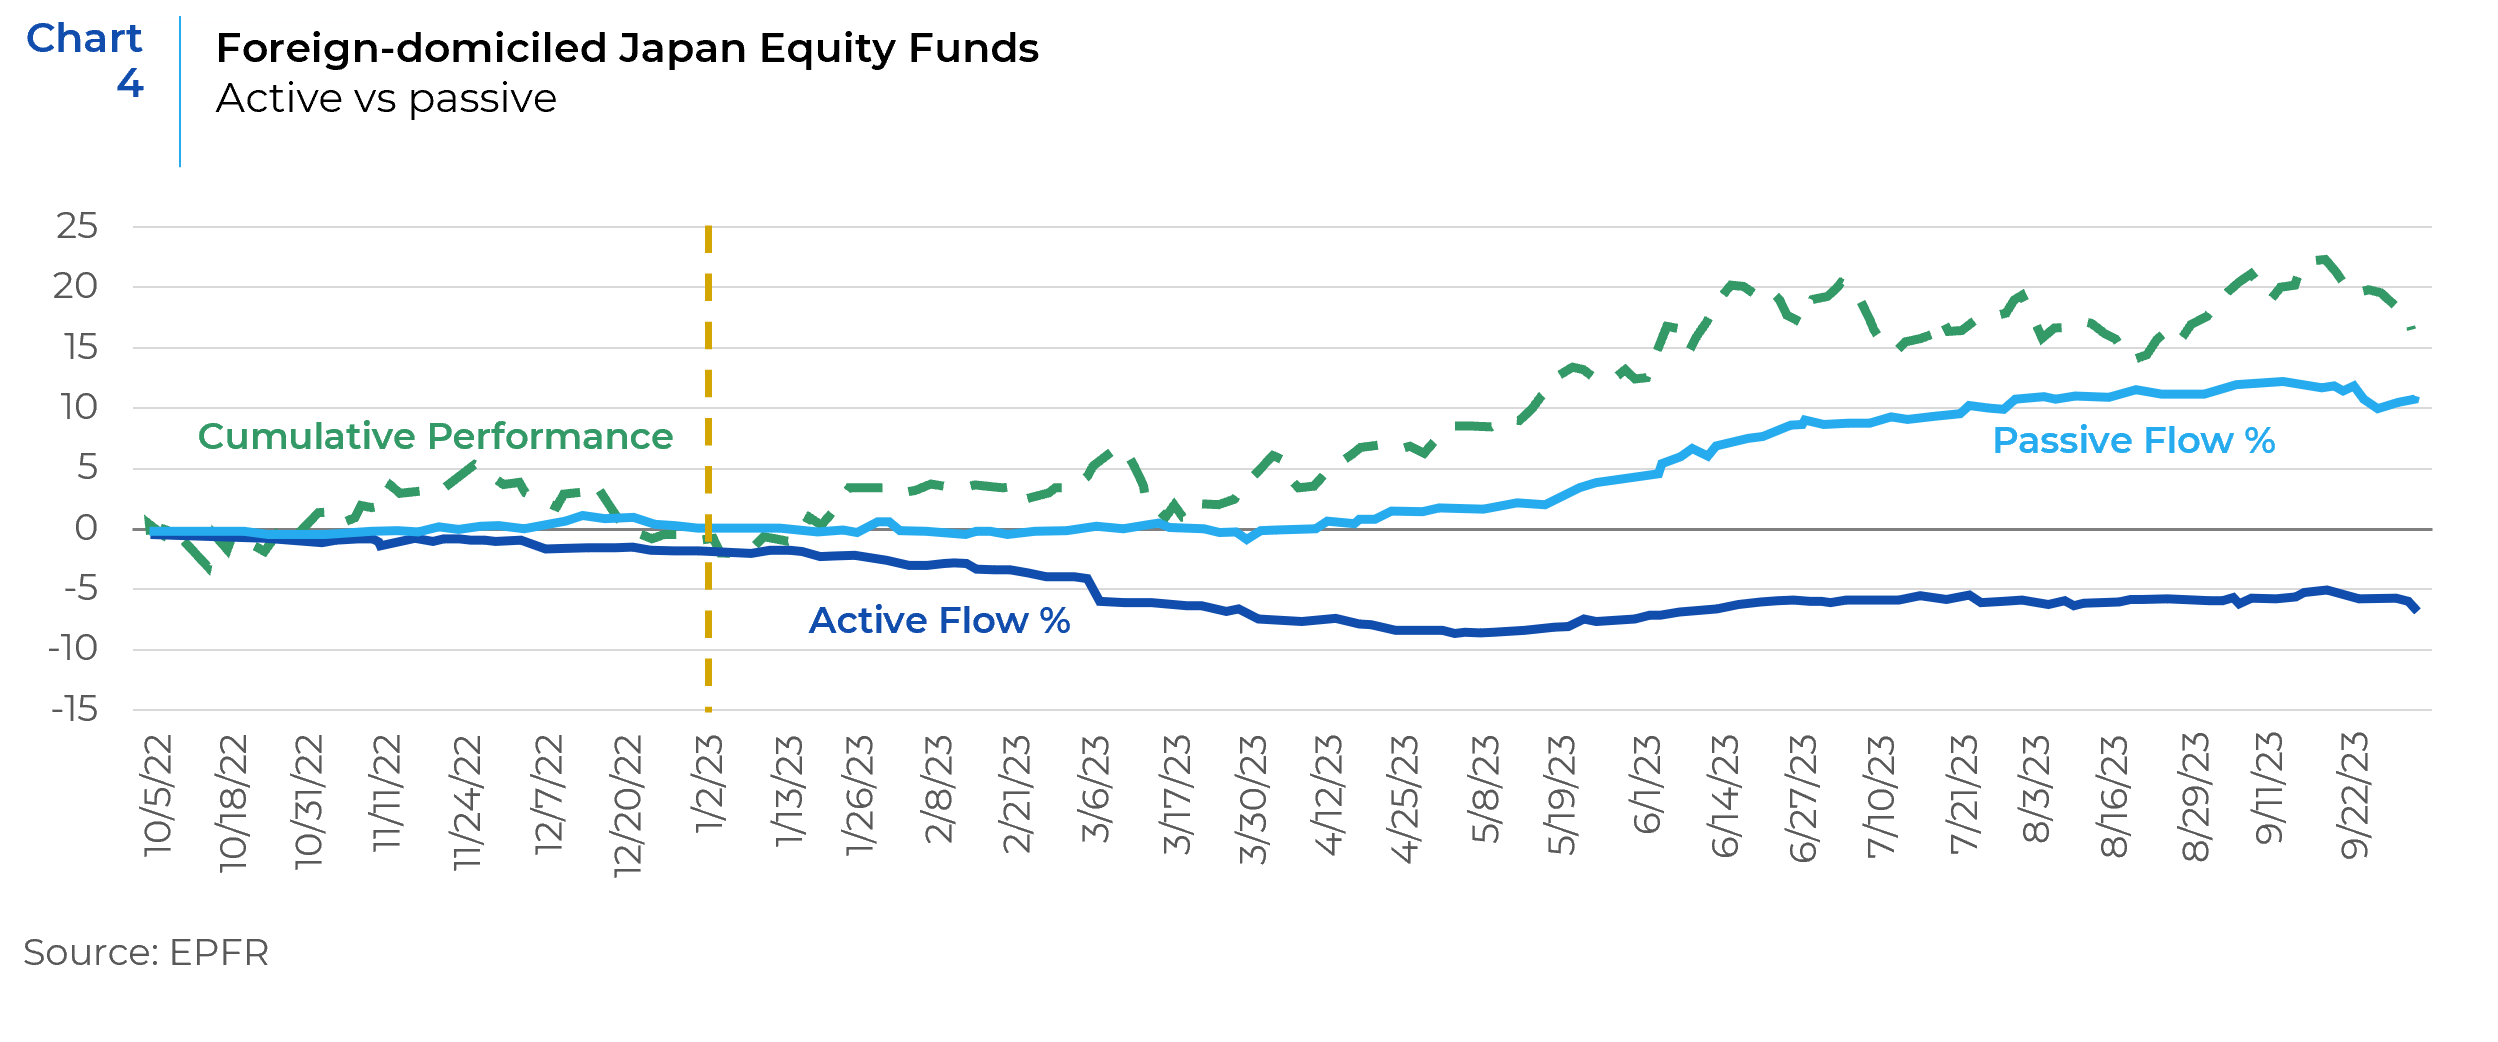
Fortunately, many foreign investors did not wait for the inattentive financial press to join the party. Foreigners bought roughly USD $43 billion in Japanese equity exposure last year, (see Chart 3), the most in a decade, primarily via passive and quasi-passive ETF/index flows (see Chart 4). While such flows of “hot money” can be the start of a durable, long-term investment trend, at least as often they merely represent opportunistic trades from fickle global investors. So, what are Japanese investors doing amid this torrent? How are they positioned currently in their own market and what are the trends, incentives, and/or constraints on their asset allocation that point us probabilistically to the most and least likely outcomes for their future asset allocation decisions?
In summary, Japanese investors do not appear to have been a catalyst for last year’s rally, though importantly they also did not sell into the rally either, potentially signaling a shift in Japanese risk appetites. The macro backdrop and new structural changes are both highly supportive of a continued increase in household risk taking for many years to come. Meanwhile, Japanese institutional investors appear unlikely to change their existing allocations to Japanese equities in the coming years (positively or negatively), but they do have some significant dry powder within their existing asset allocation structure to increase their holdings of Japanese debt at the expense of hedged foreign debt.
Show Me The Money!
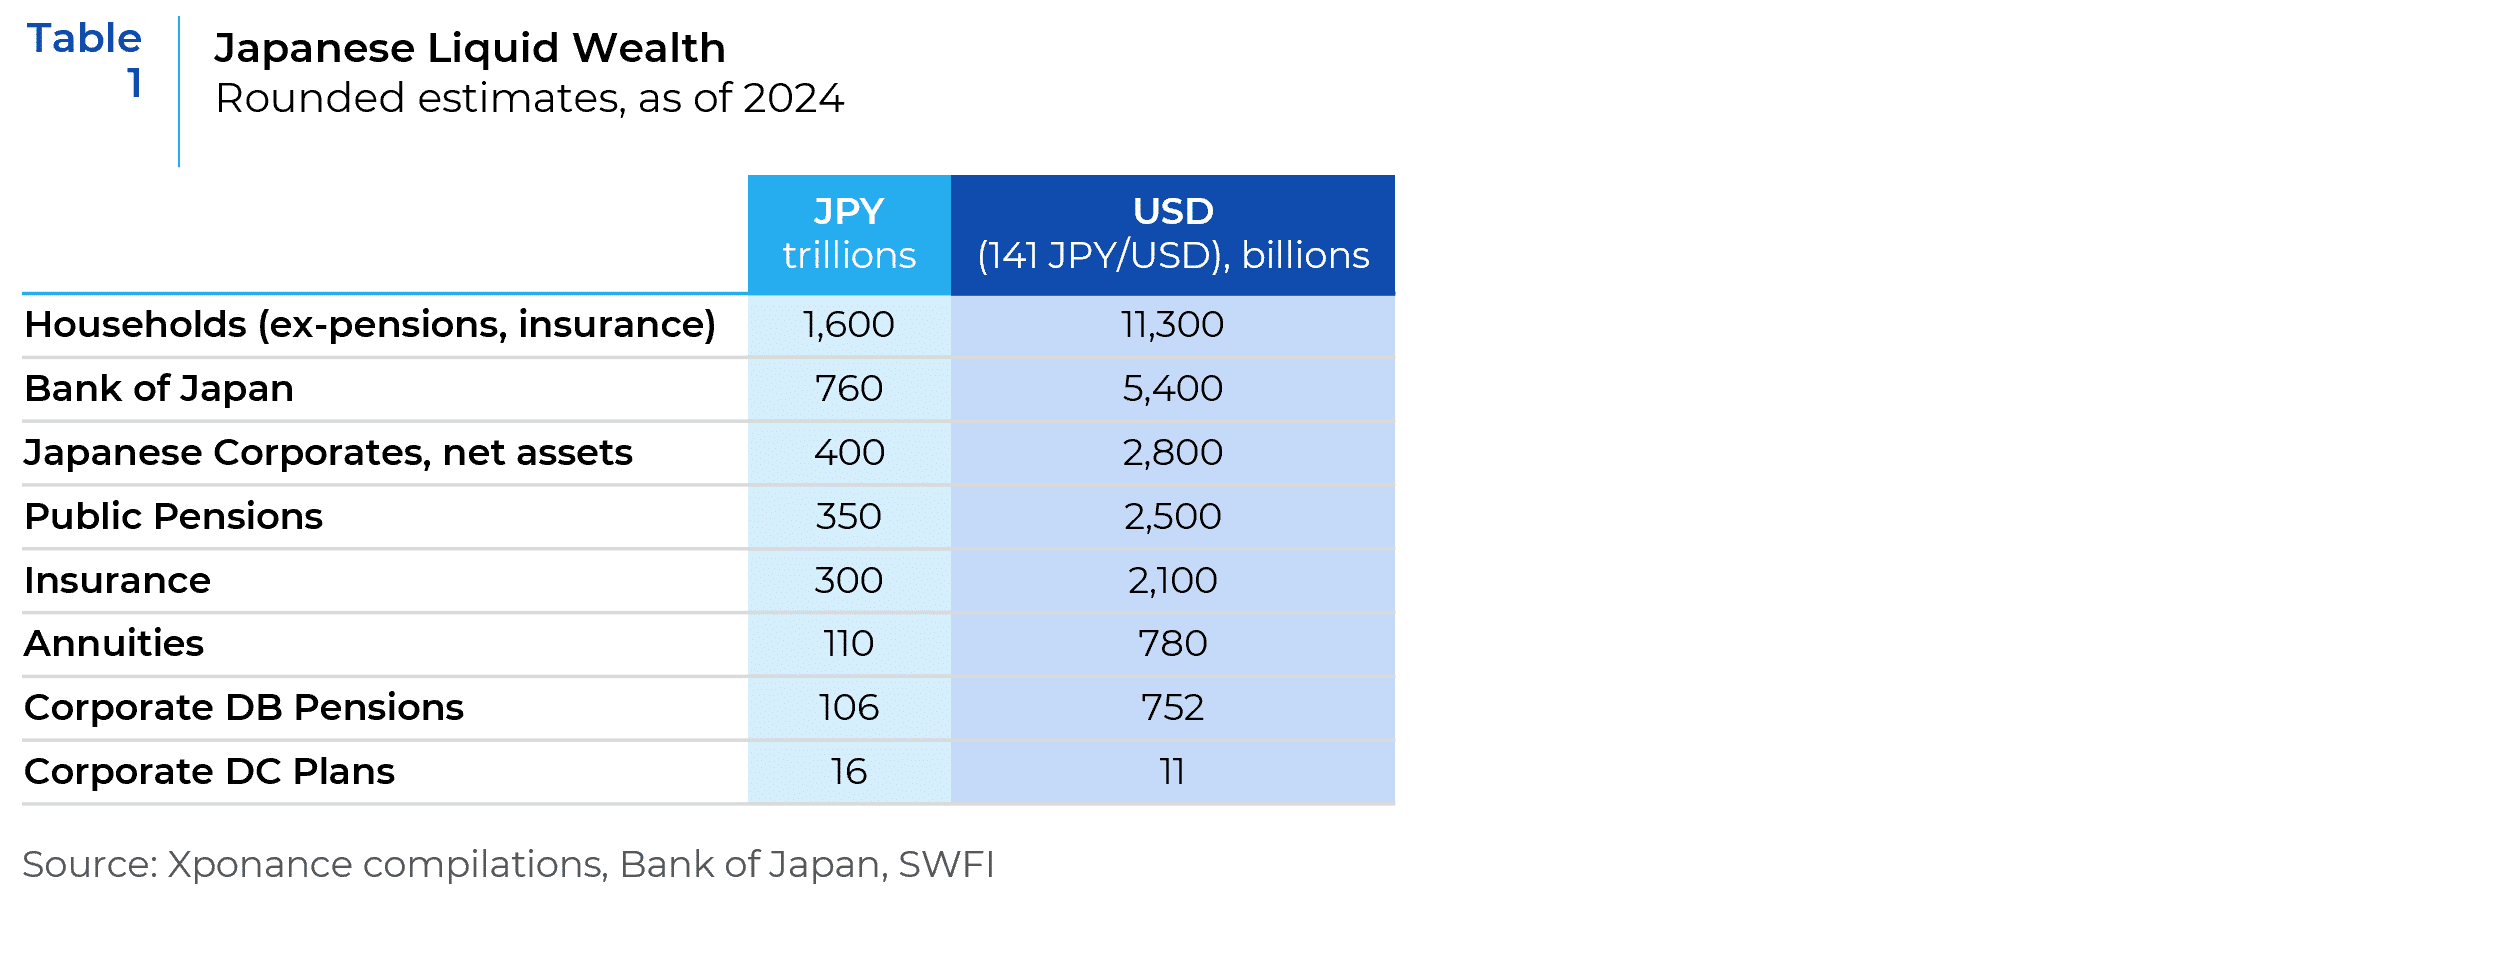
We start with a simple sketch of Japanese investors’ liquid wealth (see Table 1), which is estimated at around USD $23 trillion or about a third of estimated U.S. liquid wealth (and with roughly a third of the U.S. population). The largest single asset owner in Japan is the Bank of Japan, with roughly USD $5.4 trillion in assets, followed by the world’s largest pension fund,1 the Government Pension Investment Fund of Japan (GPIF), with roughly USD $1.6 trillion in assets.
The vast majority (95%) of the Bank of Japan’s holdings are in debt instruments, mostly Japanese bonds. They do hold 4.9% of their balance sheet in equities (roughly USD $260 billion), almost all in passive ETFs in Japanese equities. The Bank of Japan’s history of acquiring these assets is well discussed elsewhere, and on March 19, 2024, the BoJ voted to end further purchases of equities (which had been extremely limited recently anyway). For our purposes it is enough to classify the Bank of Japan as a non-buyer of further equity assets in the coming years, and a potential (albeit uncertain) seller at least of their equity positions.
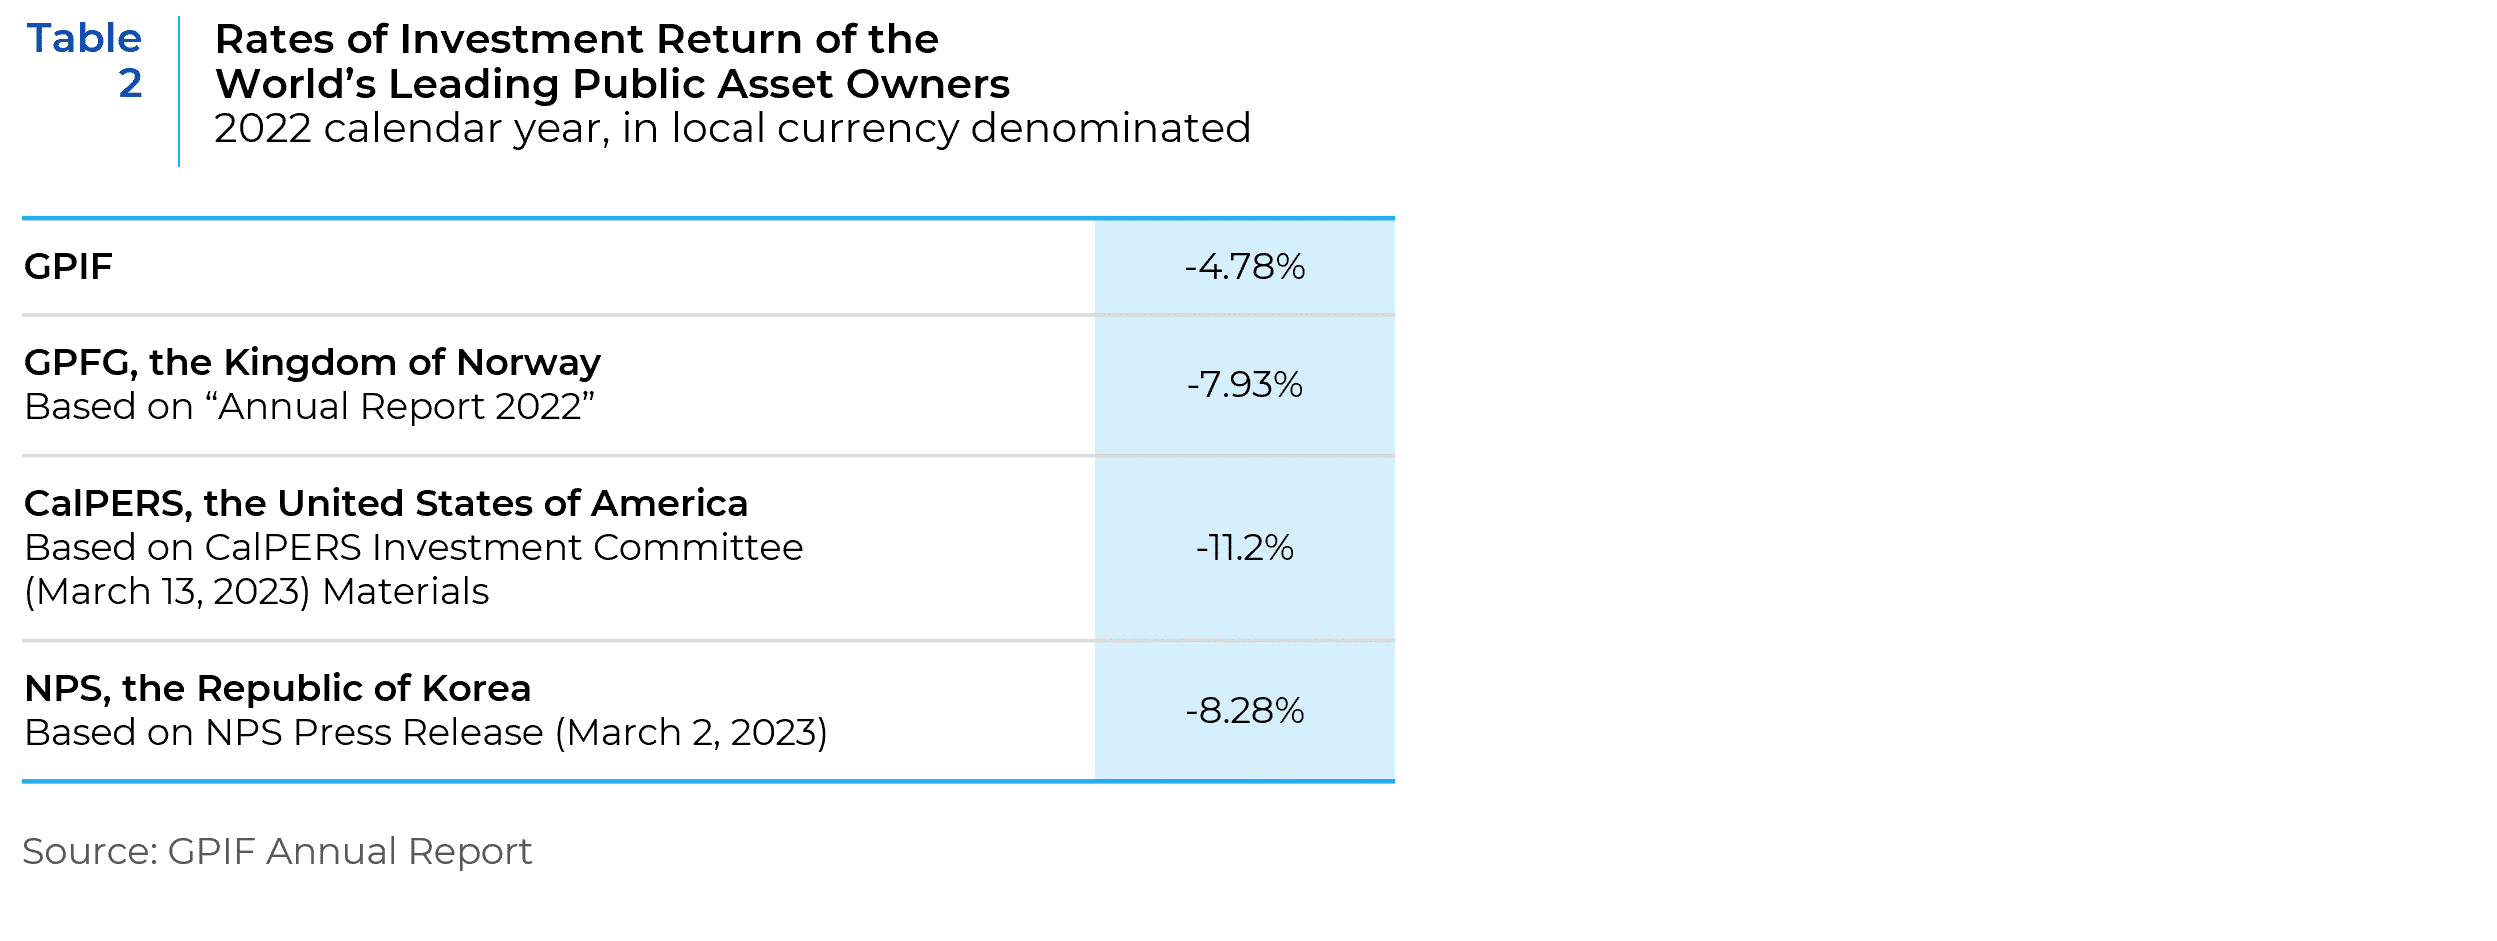
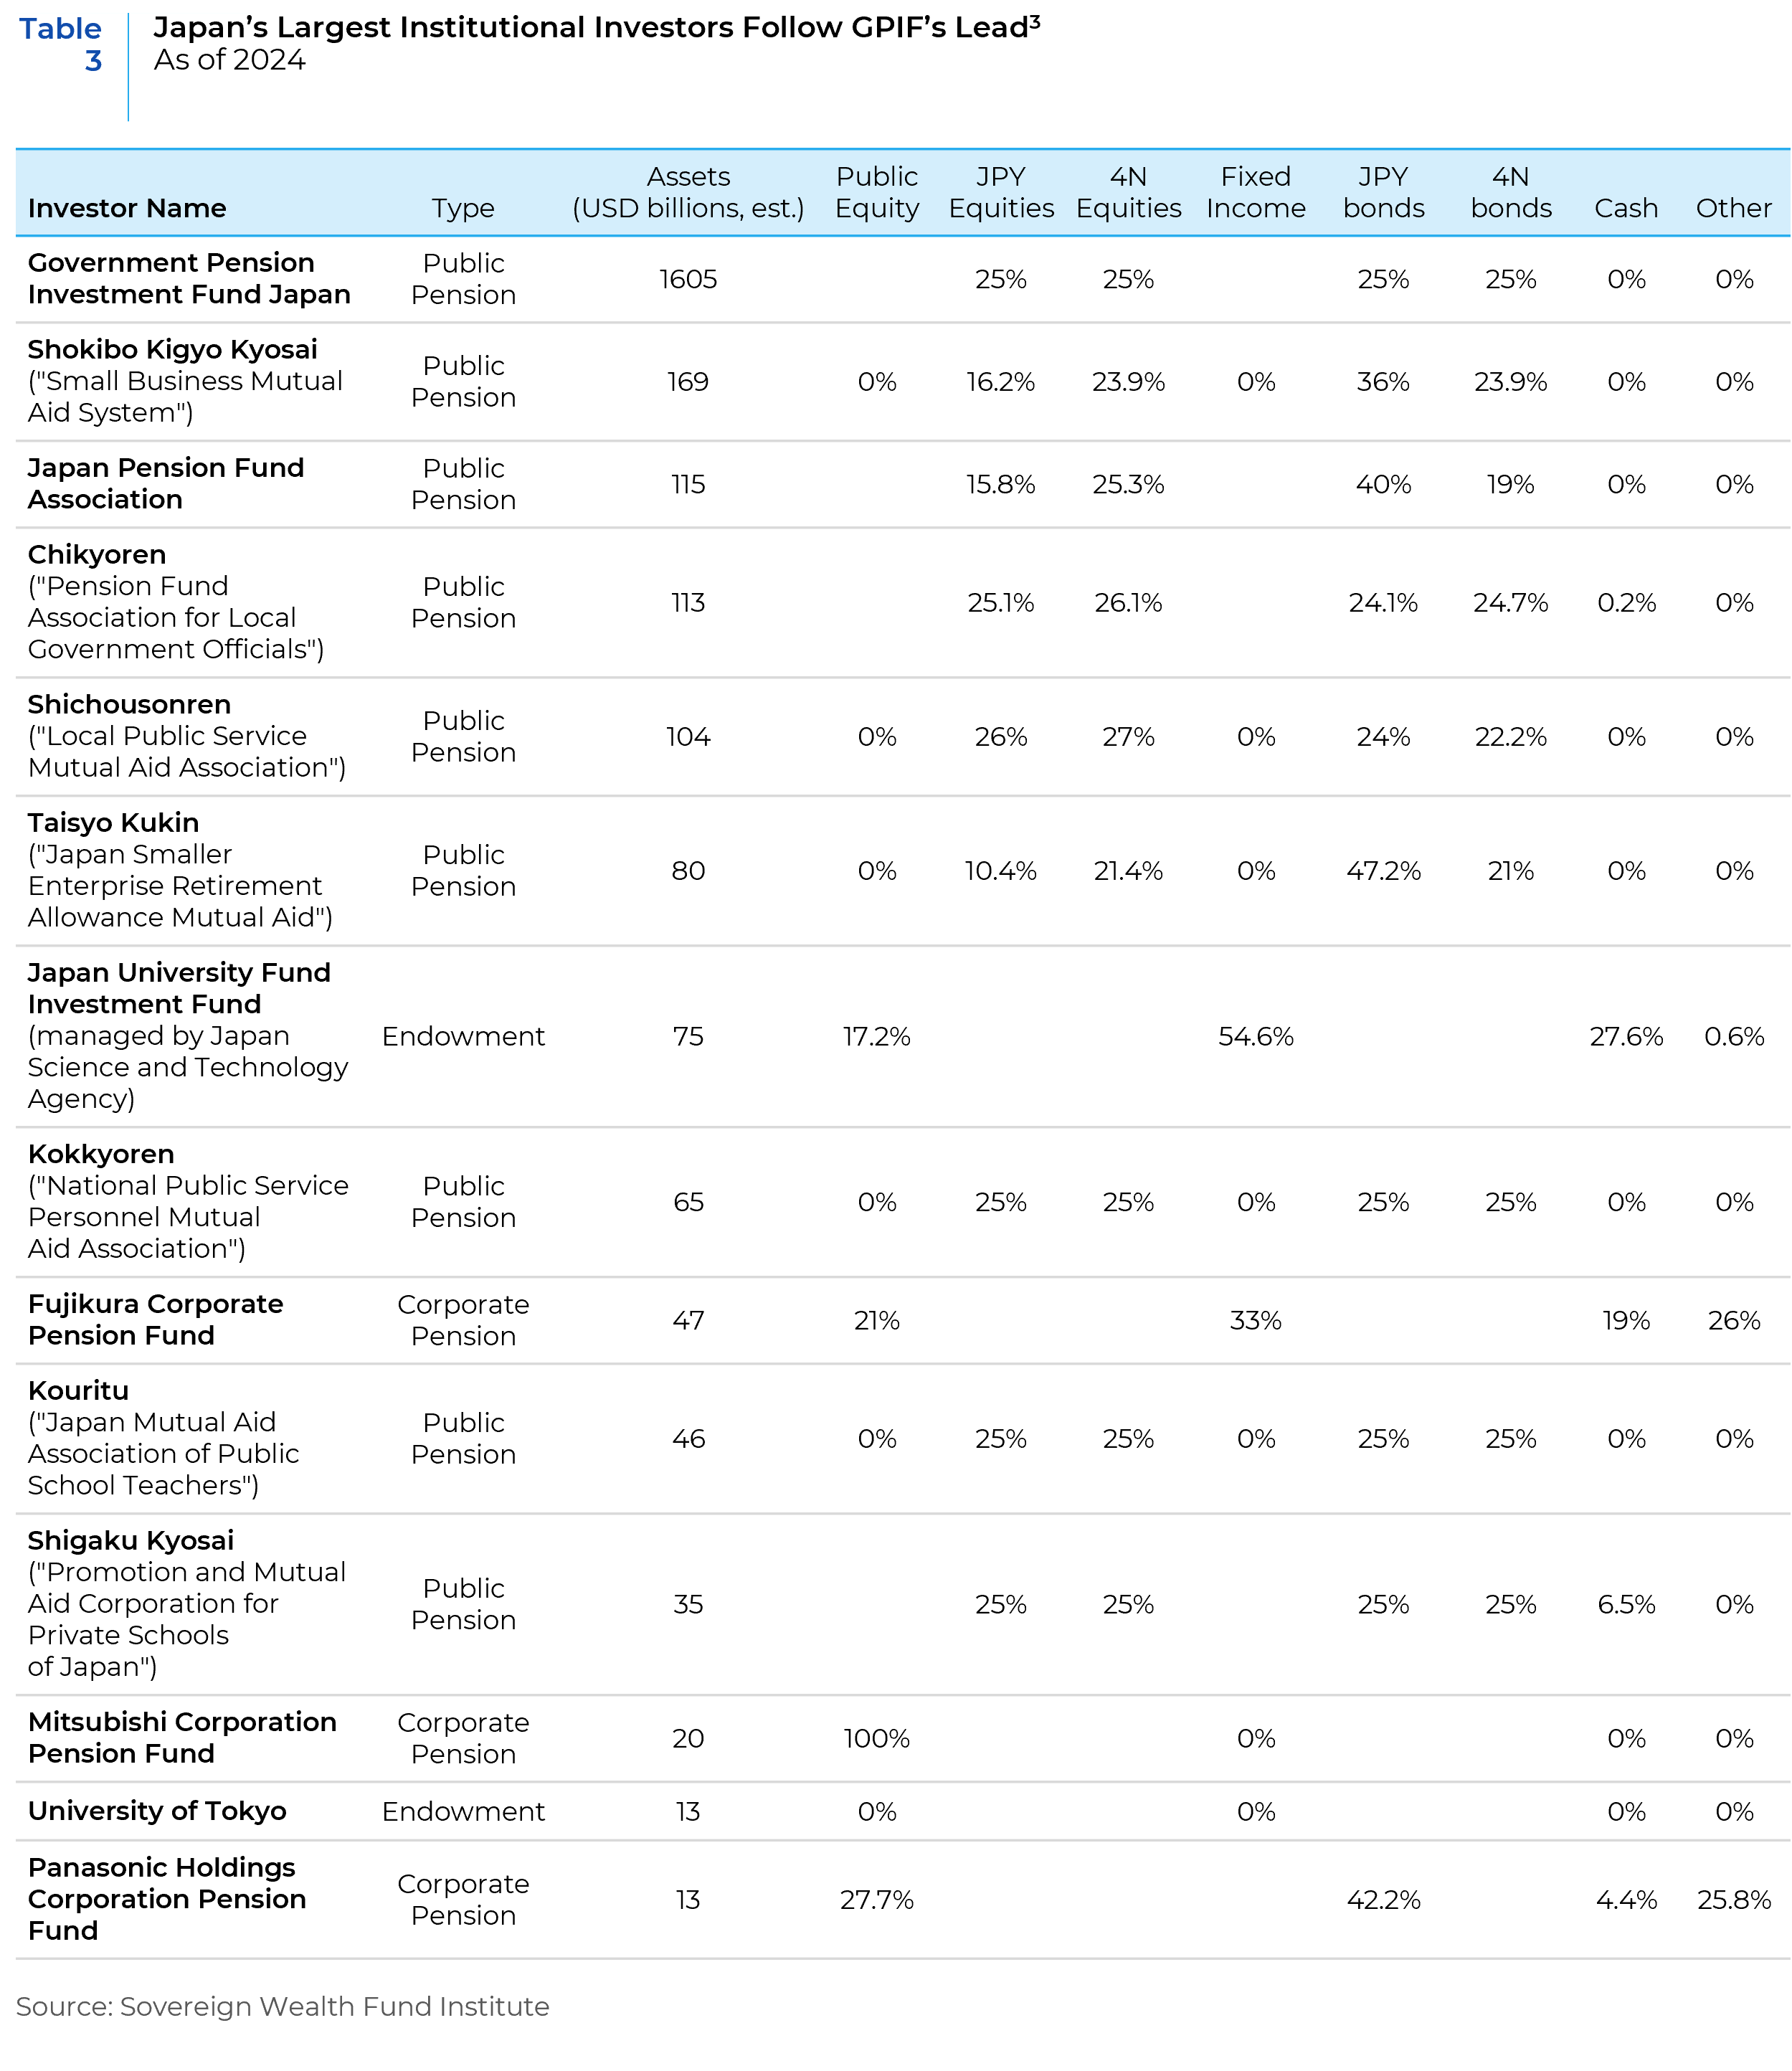
As the largest single investor in Japan, the GPIF also sets the de facto asset allocation benchmark for most Japanese institutional investors, so we will dive deeper into the GPIF. GPIF invests in four main asset classes: JPY debt, foreign debt, JPY equities and foreign equities. GPIF’s last significant asset allocation change was to adopt an “equal-weighted” asset allocation structure in 2020, which was only a modest revision from their prior asset allocation of 35% JPY bonds vs 15% foreign bonds and 25% in domestic and foreign equities (see Chart 5). In 2022, this home bias led them to outperform their largest global peers, and they did not hesitate to take a little victory lap in their 2023 annual report (see Table 2). Japan’s other major pension funds’ asset allocations are largely in lockstep with the GPIF, as are most of the largest corporate DB pension funds (see Table 3). Looking ahead, the GPIF seems to be confident of its positioning, at least publicly. GPIF President Masataka Miyazono said in January of this year that there is “no need” for any asset allocation reviews at this stage.2

Yet under the surface of this seemingly placid reservoir of reserves, there is much more activity than it would otherwise seem. First, in Japan the industry standard (and regulatory rule) is to report all foreign hedged debt securities, as local currency securities. So, in practice, asset owners are free to change their asset allocation between JPY and foreign denominated debt without changing their policy targets as long as foreign debt is fully hedged. Amid the recent surge in inflation in the U.S. and Europe, the costs of hedging foreign debt in Japan has also surged to its highest level since at least 2011 (see Chart 6).4 This has led to the sharpest exodus from U.S. Treasuries for Japanese investors since at least 2005 (see Chart 7). So, while the yield pickup on unhedged foreign debt remains substantial, Japanese institutional investors are already fully allocated to their policy targets there and are otherwise constrained from buying more unhedged foreign debt or equities.
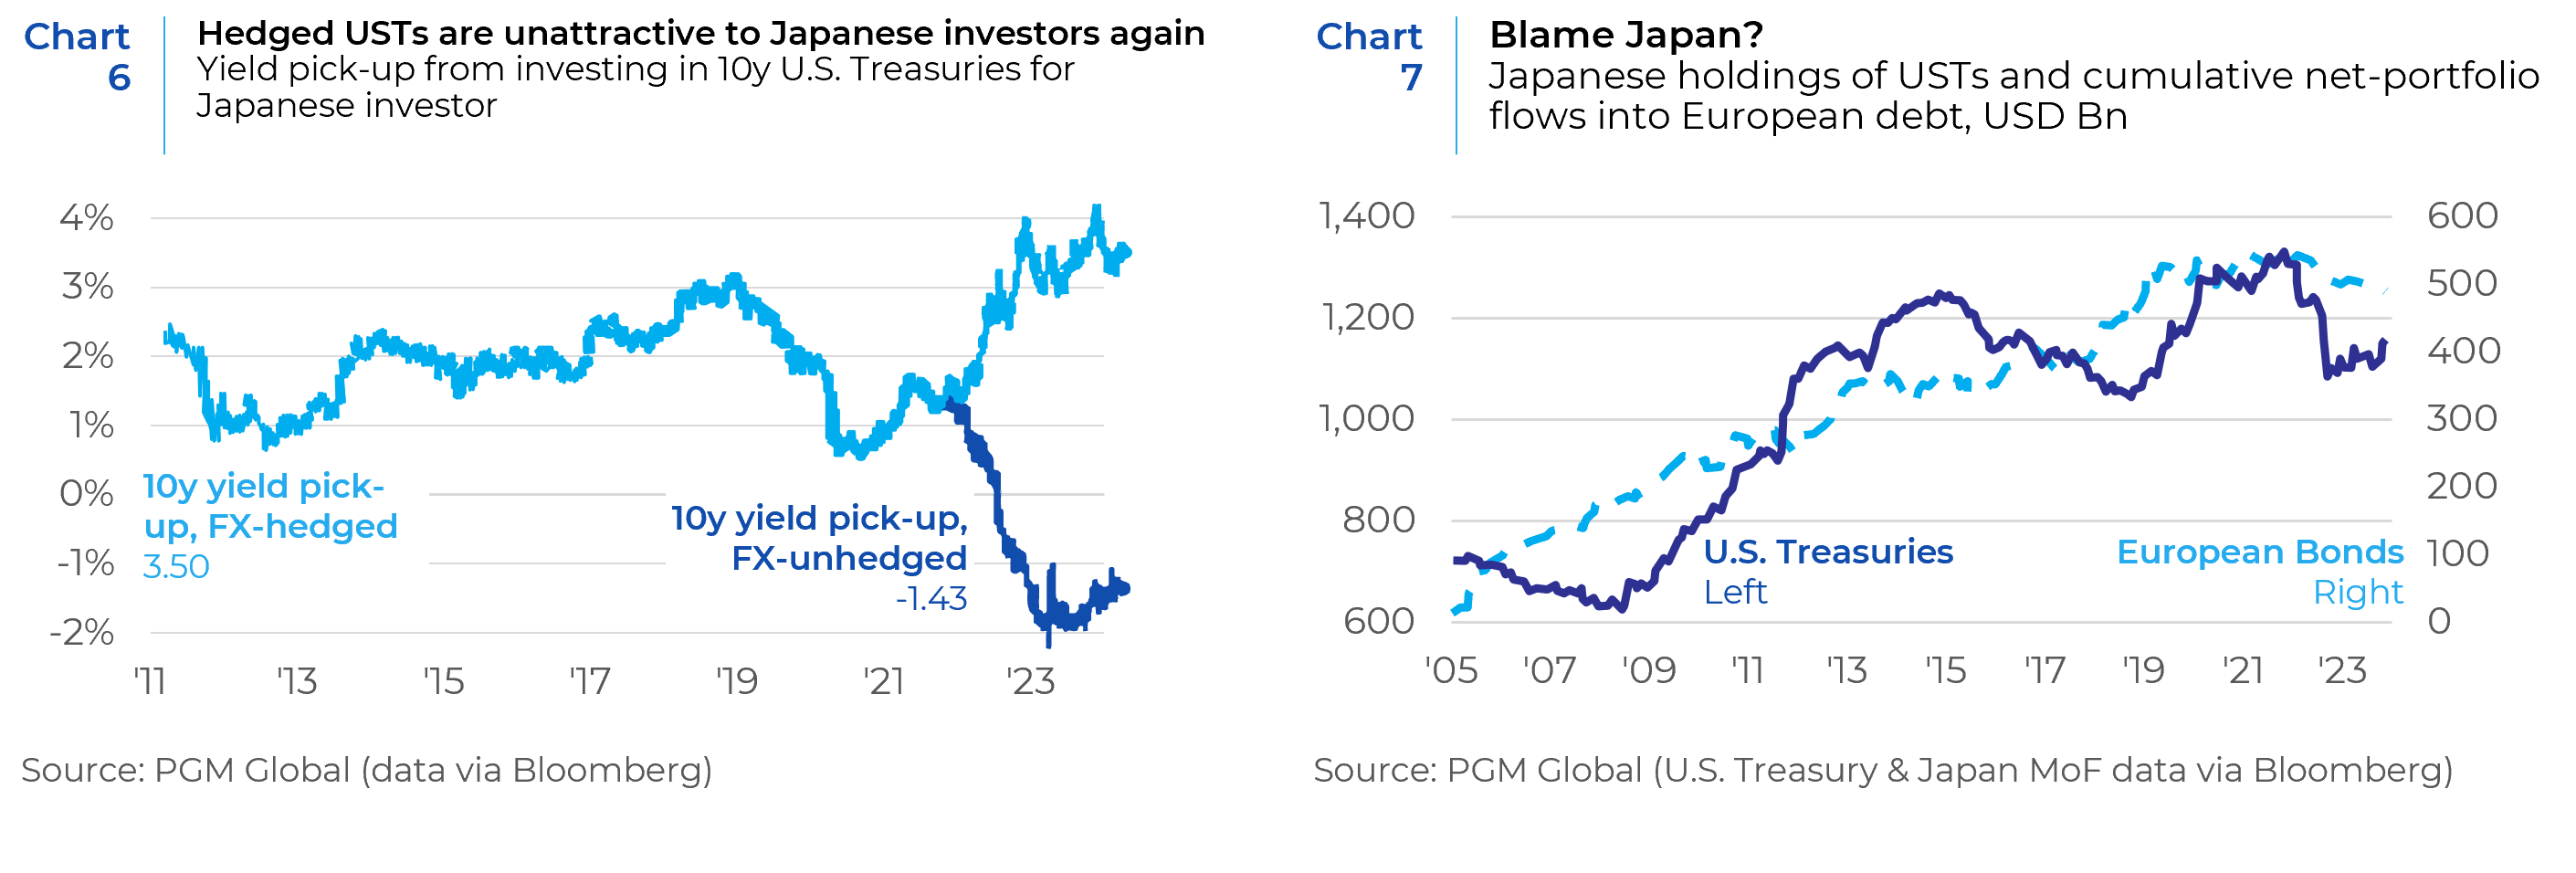
Unfortunately, GPIF and other Japanese institutions do not disclose their hedged positioning in their public financial reports (in English or Japanese), so it is difficult to know how much they could have left to sell or even how tactical they have been historically with these allocations. However, a 2019 report indicated that up to half of the GPIF’s U.S. debt and three quarters of their European debt was hedged at that time.5 This puts the potential scale of their dynamic bond allocations at a theoretical maximum of about USD $400 billion (the entirety of their JPY fixed income asset allocation), with a probabilistic maximum of closer to USD $100 billion (extending GPIF’s “equal weighted” asset allocation philosophy). This tracks with interpolated data from the GPIF itself as well as Bloomberg data. GPIF’s 2023 annual report shows a sudden spike in their actively managed Japanese bond allocations from 23% in 2021 to 40% in 2022 (again without any changes in overall asset allocation) roughly equal to USD $70 billion in underlying asset moves.6 Meanwhile Bloomberg data shows that approximately $150 billion of USTs were sold by Japanese investors in 2022 (see Chart 7 – above), and the GPIF represents about half of the Japanese institutional investor base.
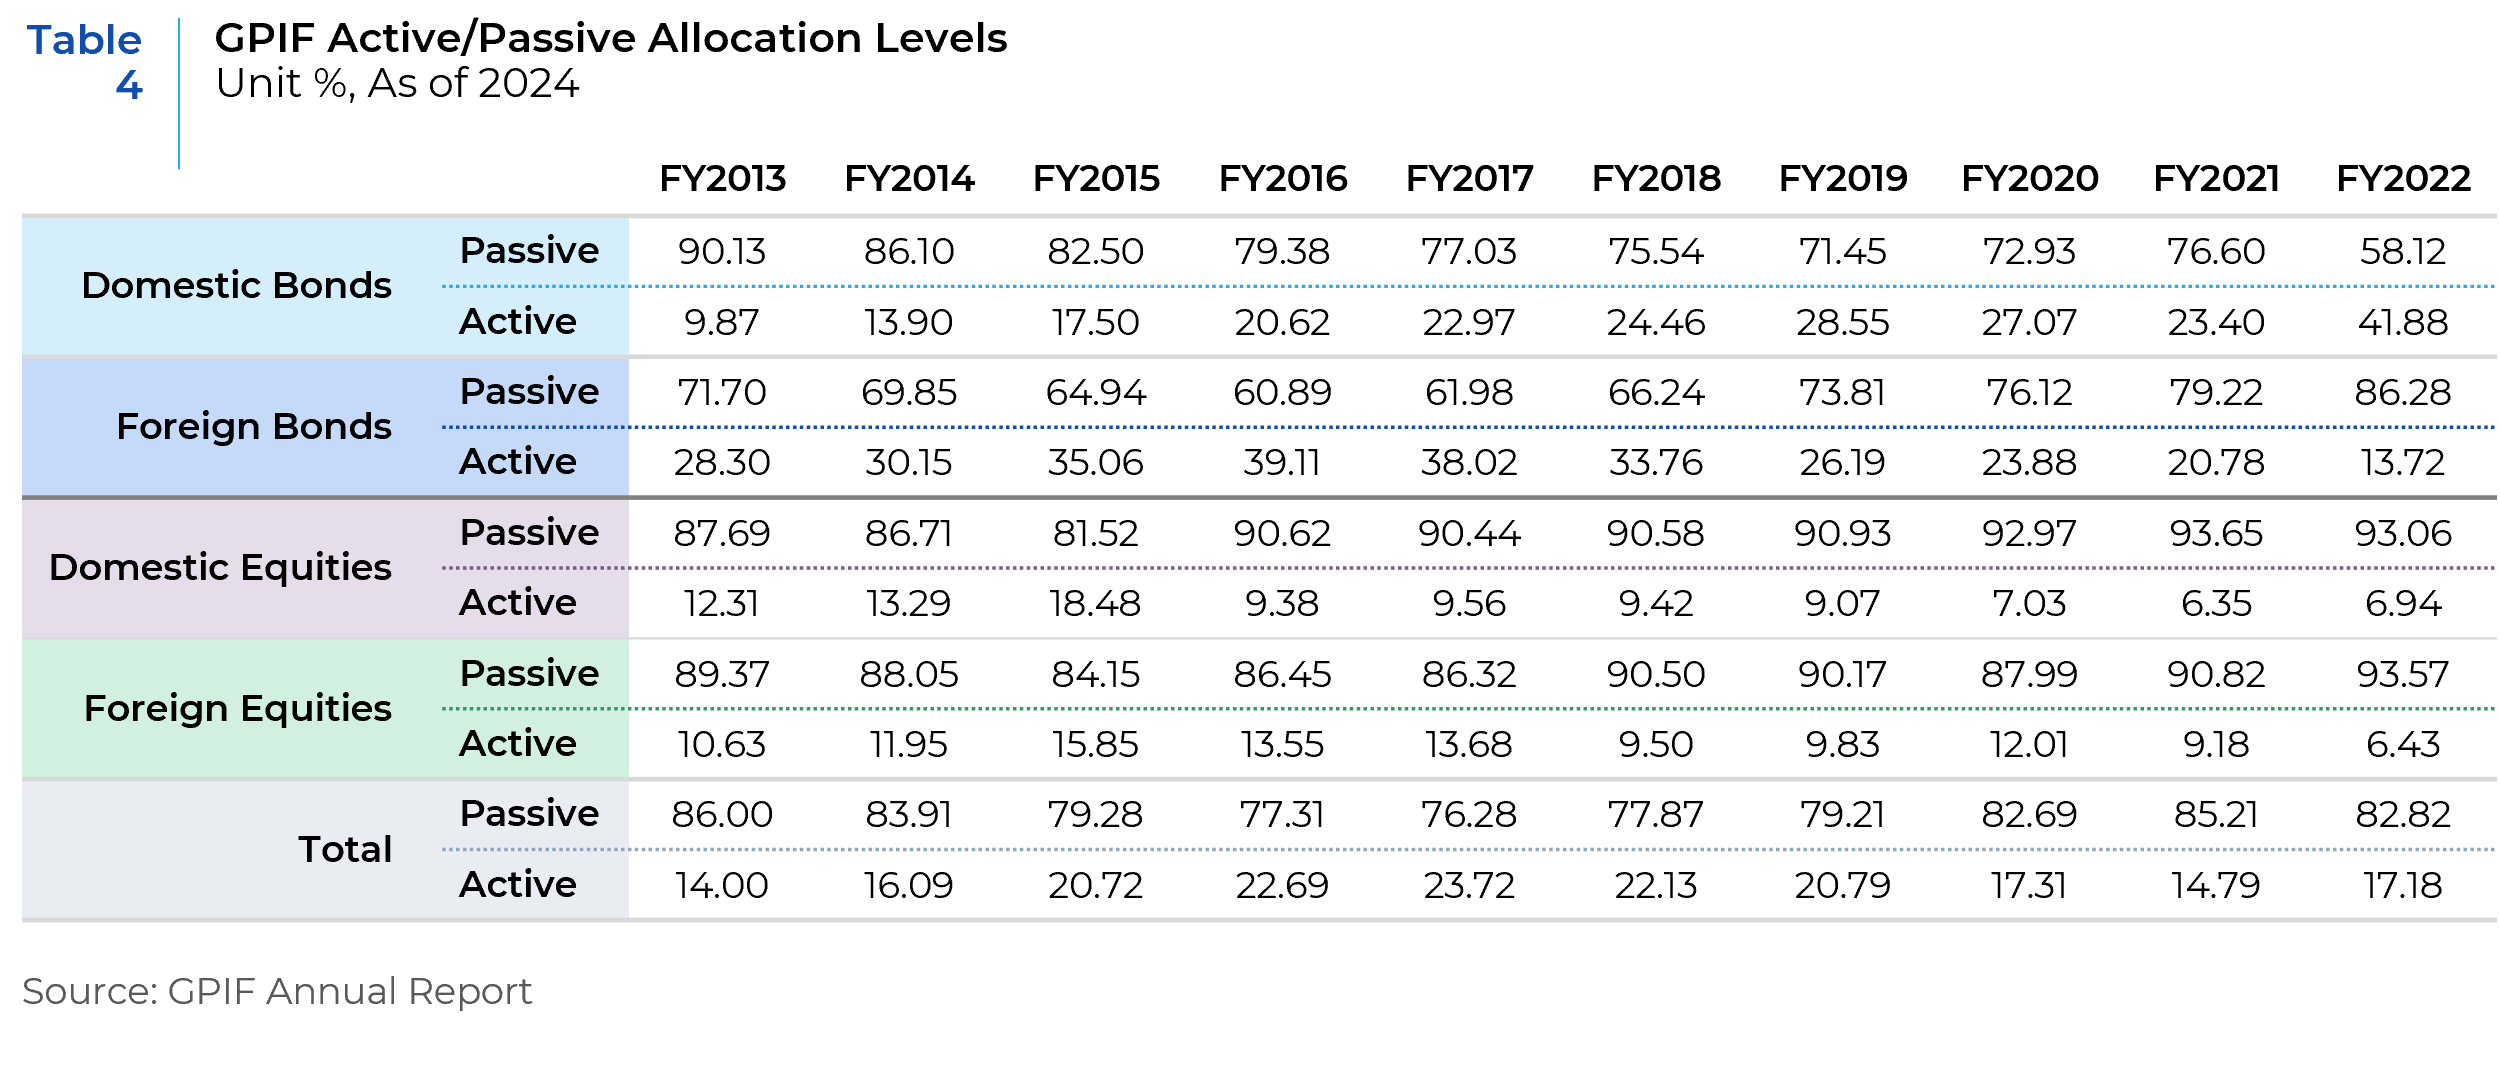
Within their equity allocations, GPIF has also announced more changes to come. Given its enormous size, the GPIF continues to struggle with adding value through underlying manager and stock selection. Their trailing three years excess returns of their policy benchmark was +18bps net of fees. Their allocation to active foreign equities has been cut in half over the past two years from 12% to 6% and has similarly dipped down to 7% in Japanese equities (see Table 4). But in December 2023, GPIF removed certain AUM and length of track record minimums for their qualification criterion for active managers, while announcing their intention to increase allocations to smaller, boutique managers. “We look forward to discovering superior asset management companies by opening our door wider,” GPIF President Masataka Miyazono told reporters in January 2024.7 It goes without saying that at Xponance we couldn’t agree more with this approach.
Domestically, the GPIF is poised to announce a round of tendering for active Japanese equities in a process that began in late 2022. The GPIF also recently added to their thematic ESG focused allocations with a USD $3.7 billion allocation to track the Morningstar Japan ex-REIT Gender Diversity Tilt Index. The Index is essentially an ESG play that brings gender diversity to the table, based on data from Amsterdam based gender lens data aggregator Equileap.8 Here again, we concur strongly with GPIF’s emphasis on the importance of diversity in driving superior economic outcomes.
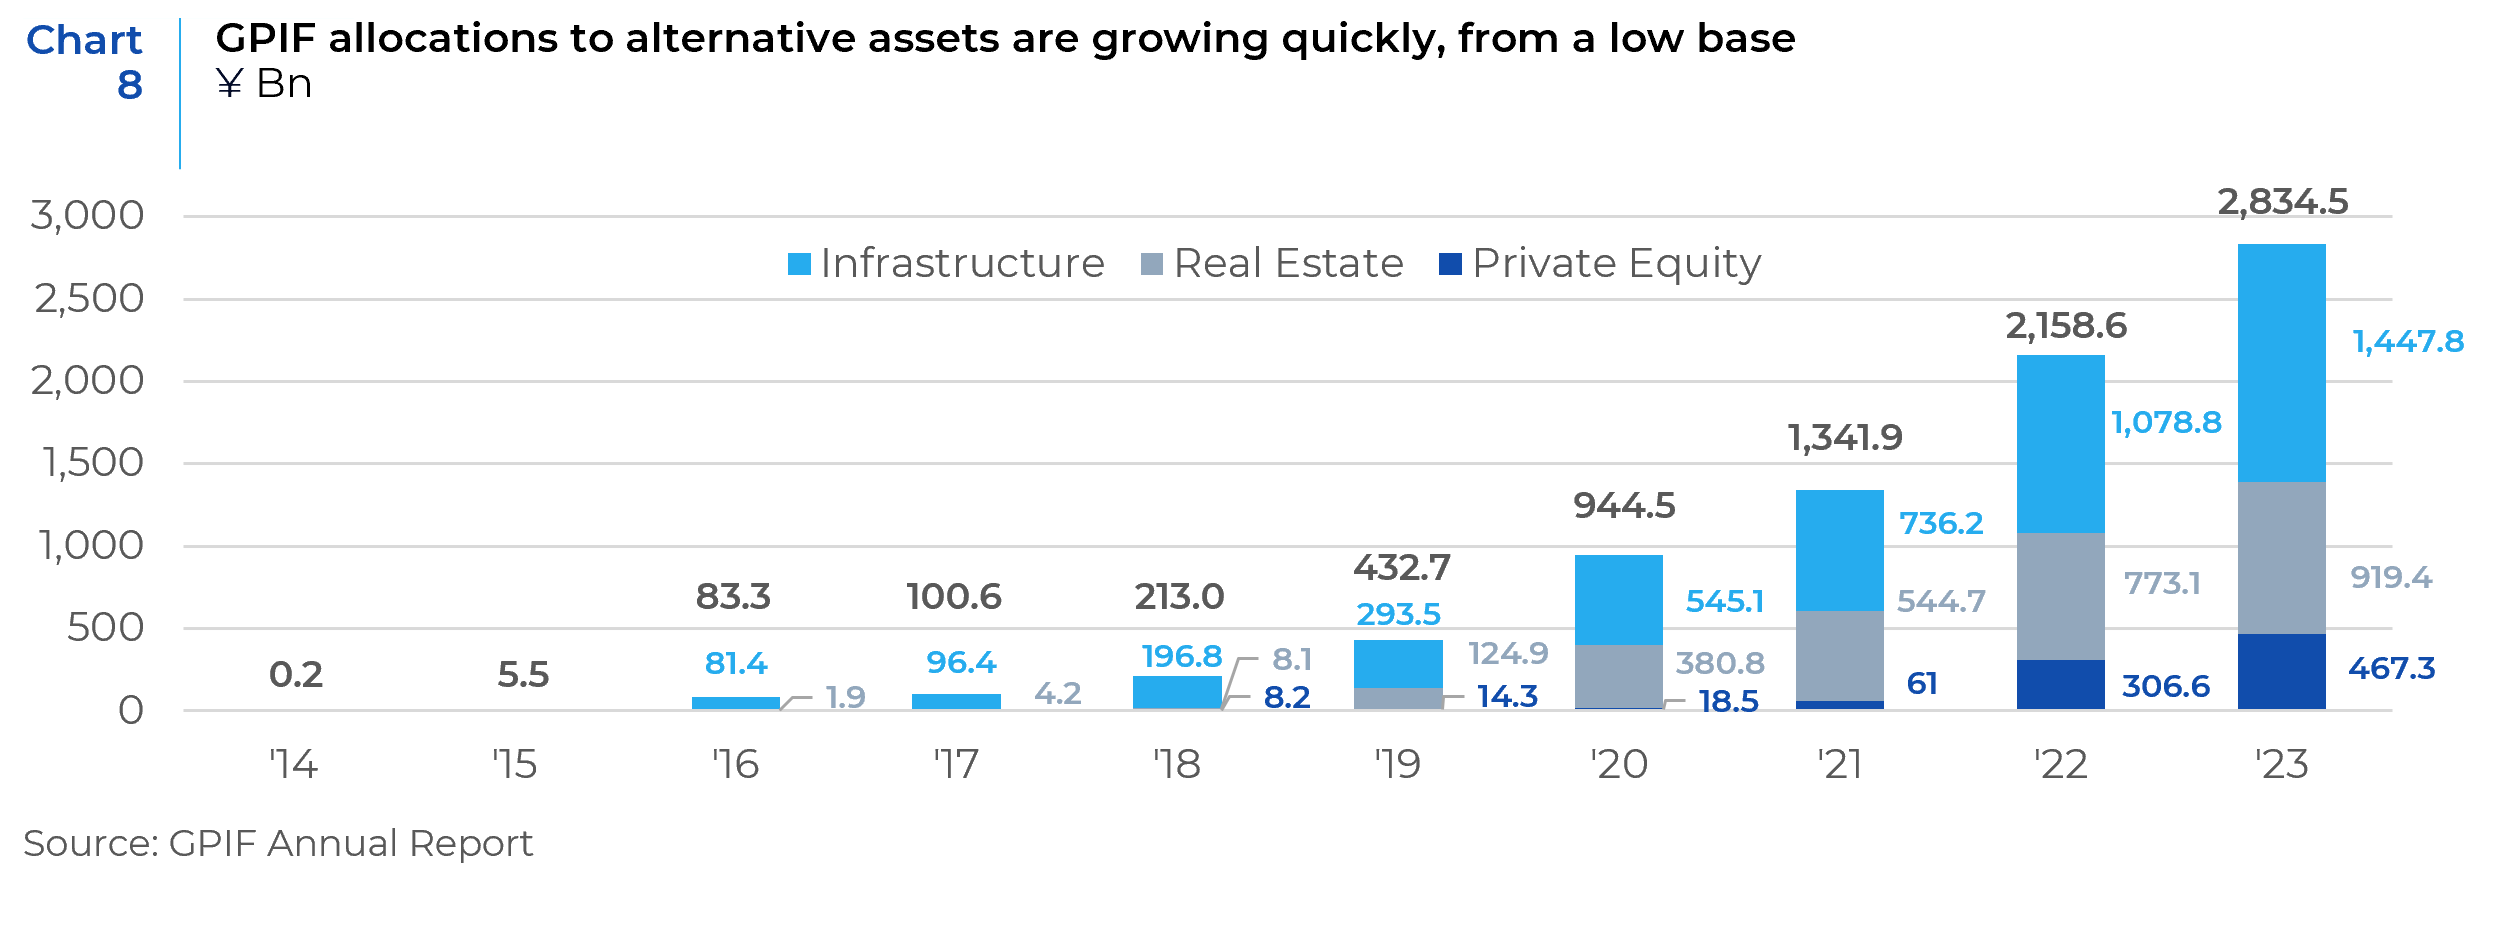
GPIF has also been increasing their allocations to alternative assets, albeit from a low base. Their current policy guidelines cap their alternative assets at 5% of total assets, and their current exposure is approximately 1.4% of their portfolio, with an additional 1.2% already committed, yielding a maximum potential additional allocation of about USD $40 billion. Given their recent pacing (see Chart 8), this is likely to be allocated in the coming 2-3 years. Uniquely, GPIF policy stipulates that “alternative assets to be categorized into domestic bonds, foreign bonds, domestic equities, and foreign equities in accordance with risk-return profiles,”9 so what GPIF sells could come from any of their various 4 buckets depending on how they classify the underlying alternative investments.
As shown in Table 4 (above), most of Japan’s large institutional investors are already following in lockstep with GPIF’s policy allocations, but the few that aren’t (e.g. Shokibo Kigyo Kyosai, the Japan Pension Fund Association, SERAMA, and the Japan University Fund) are relatively under allocated to Japanese equities in favor of Japanese bonds. For a couple (like the Japan Pension Fund Association), the allocation differences represent differences in funded status. But for others, including the newly established Japan University Fund (setup in 2022), it represents a scaling up process where additional tens of billions are expected to flow into equities and alternatives in the coming years. So, in sum, most institutional investors in Japan are already fully allocated to Japanese equities, but the few exceptions portend possible additional buying. At the very least, Japanese pensions can be expected to not be sellers of Japanese equities despite the market gains.
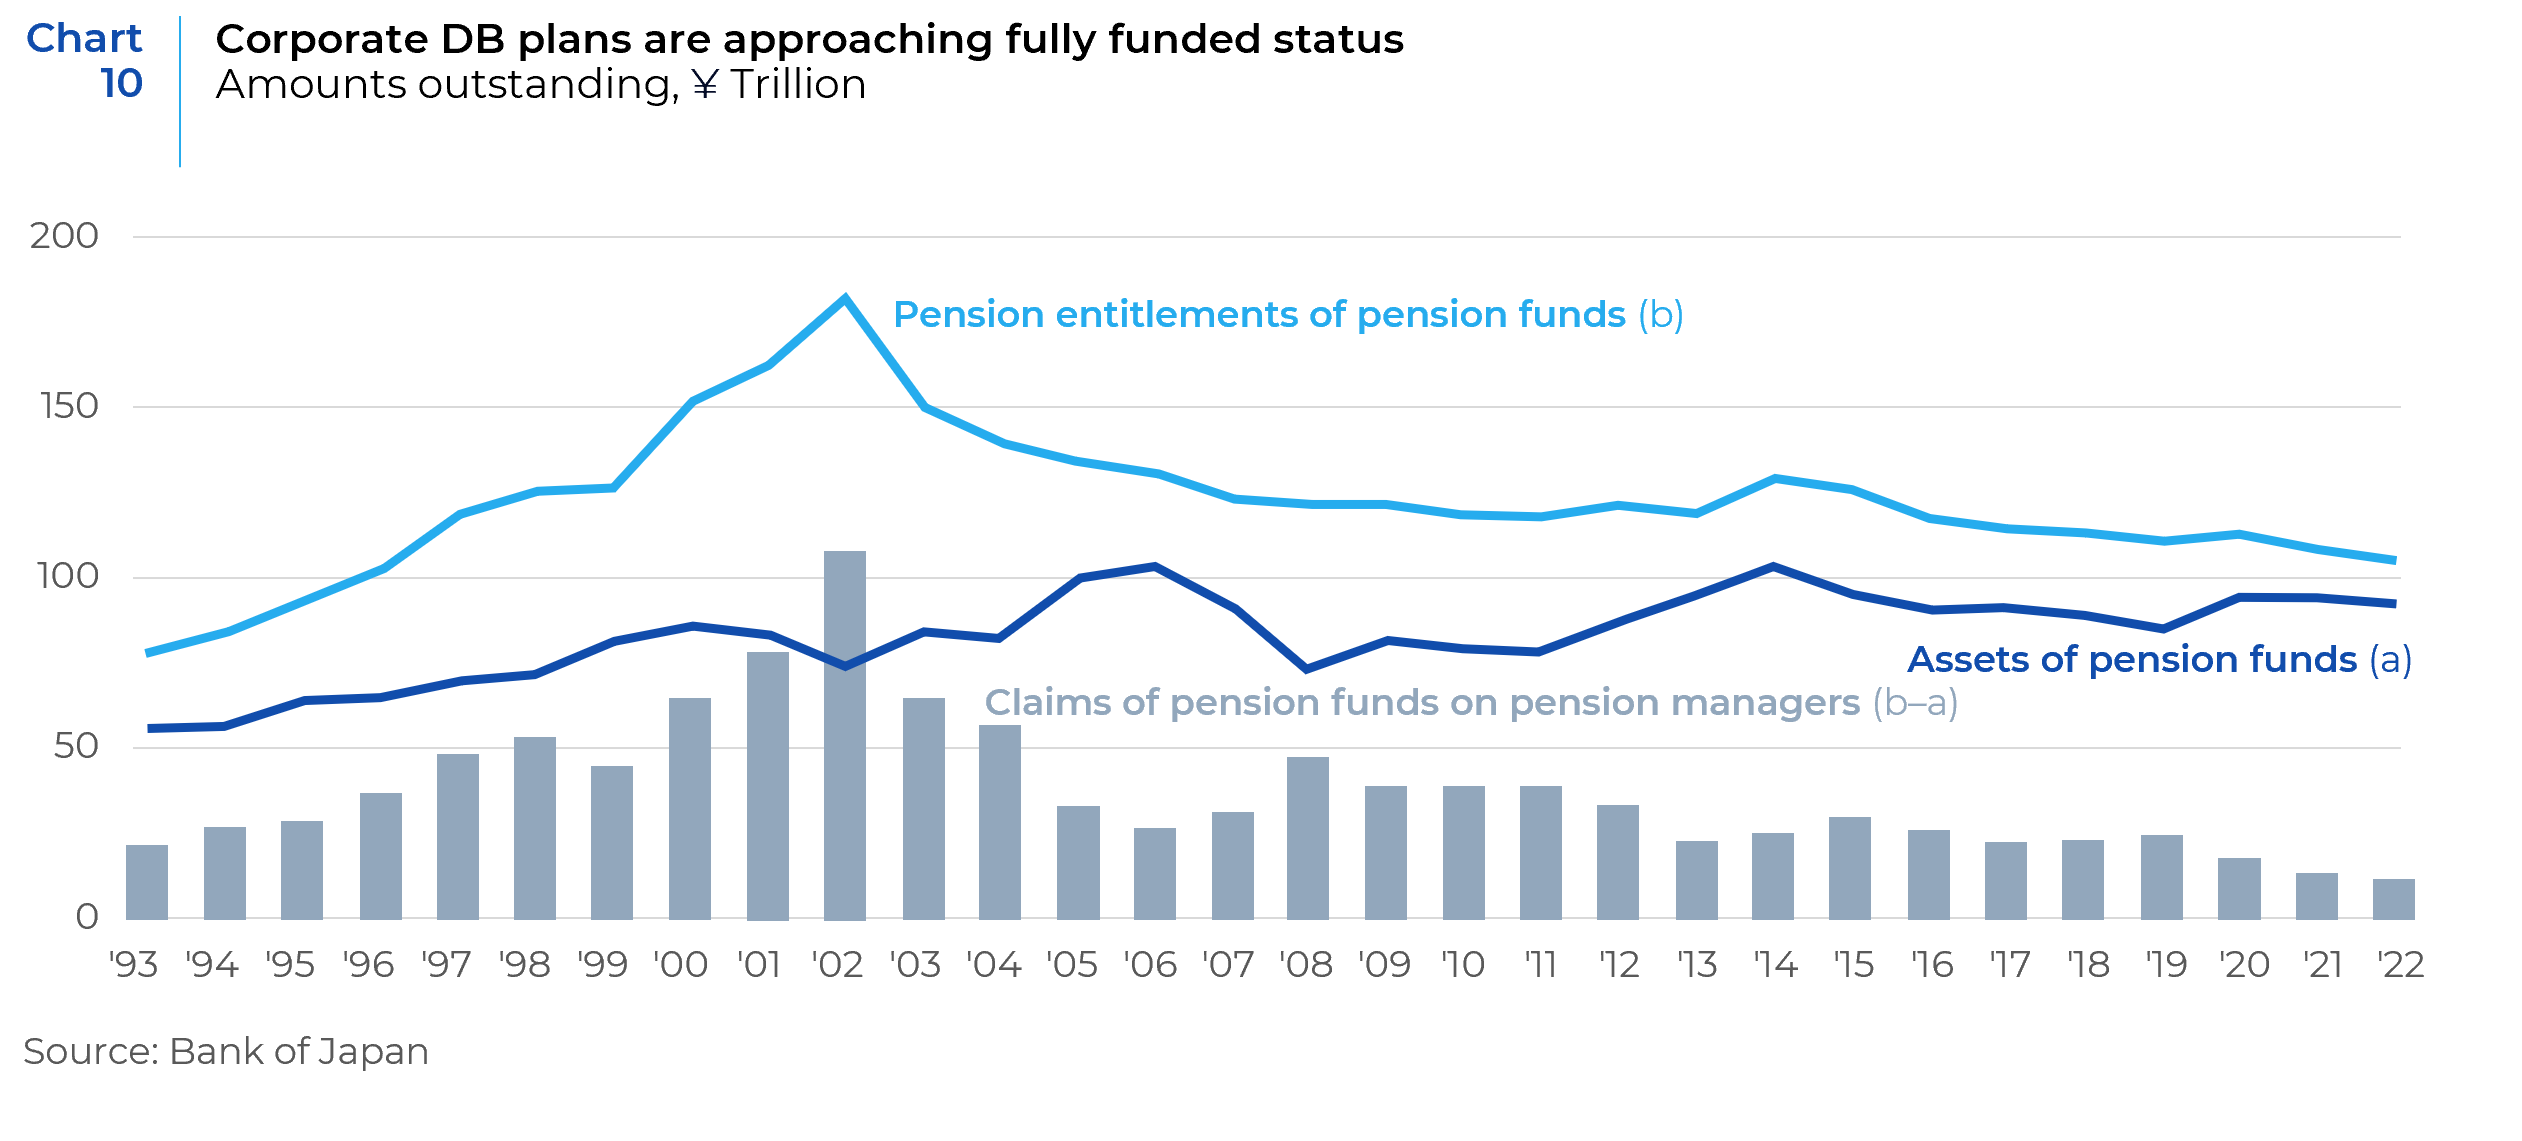
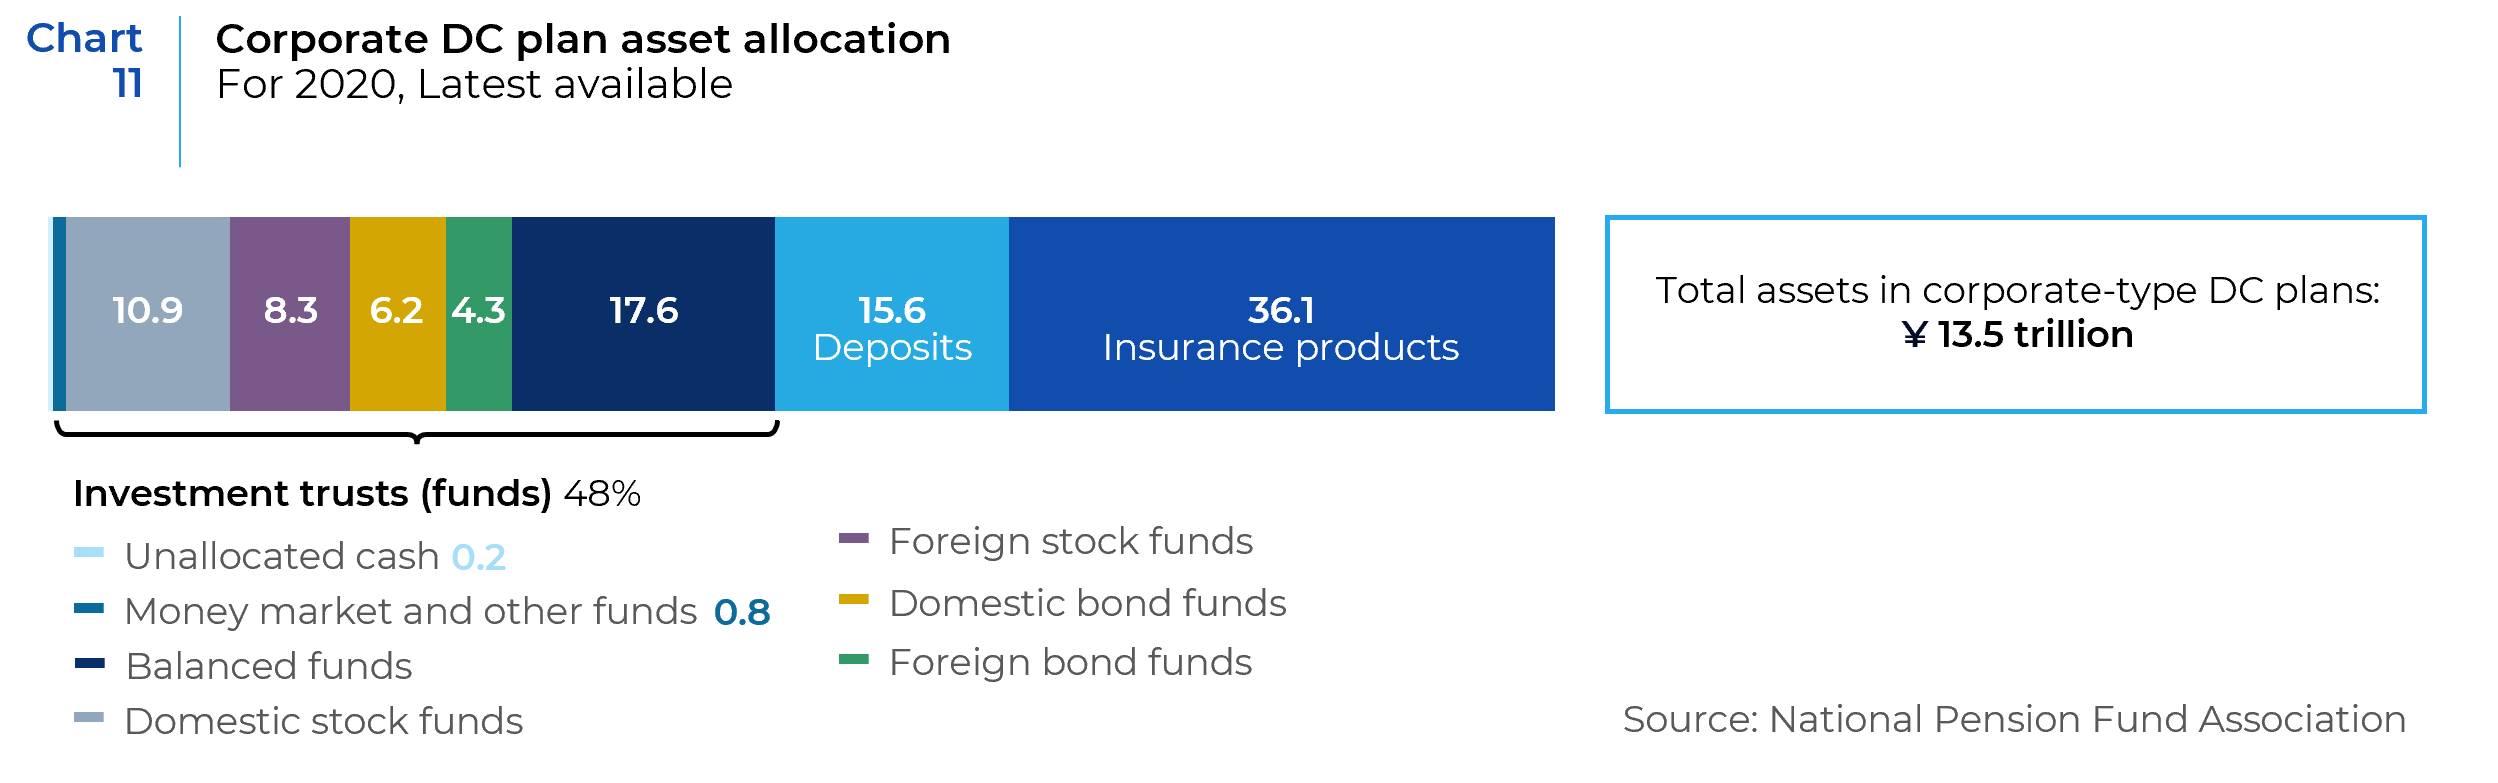
Aggregate asset allocation for corporate DB pensions in Japan have been very stable over the past 10 years,10 and relative to public DB pensions, Japanese corporate plans have had less Japanese equity exposure (approximately 10-12% as most investment trust holdings are equities) in favor of alternatives (see Chart 9). This asset allocation, combined with the reduction in liabilities (ageing out retirees) seems to have served them well as they have closed much of their gap in unfunded liabilities over the past 20 years (see Chart 10). This could put corporate DB plans in a position to de-risk portfolios in the coming years, which makes them unlikely marginal buyers of Japanese equities, unless it came from reductions in foreign equities or alternatives. A recent survey of 80 Japanese corporate DB plans showed a sharp reduction in interest in adding to their alternatives allocations vs prior years, while “51% of respondents chose 1% to the be the yield level when they would start considering investing in JGBs.”11 The much smaller corporate DC market is also the fastest growing (about JPY 1 trillion/year or about 6.5% annual growth) segment, but even here the asset allocations remain very conservatively positioned, broadly in line with household asset allocation (see below, Chart 11).12 Elsewhere among Japanese institutions, insurance holdings are (predictably) dominated by bonds, and here again we see the 2022 pullback from foreign bonds as previously seen in the Bloomberg data above (Chart 12). In the annuities market, approximately 70% of all exposure is in debt securities, of which about a third is in foreign debt.13


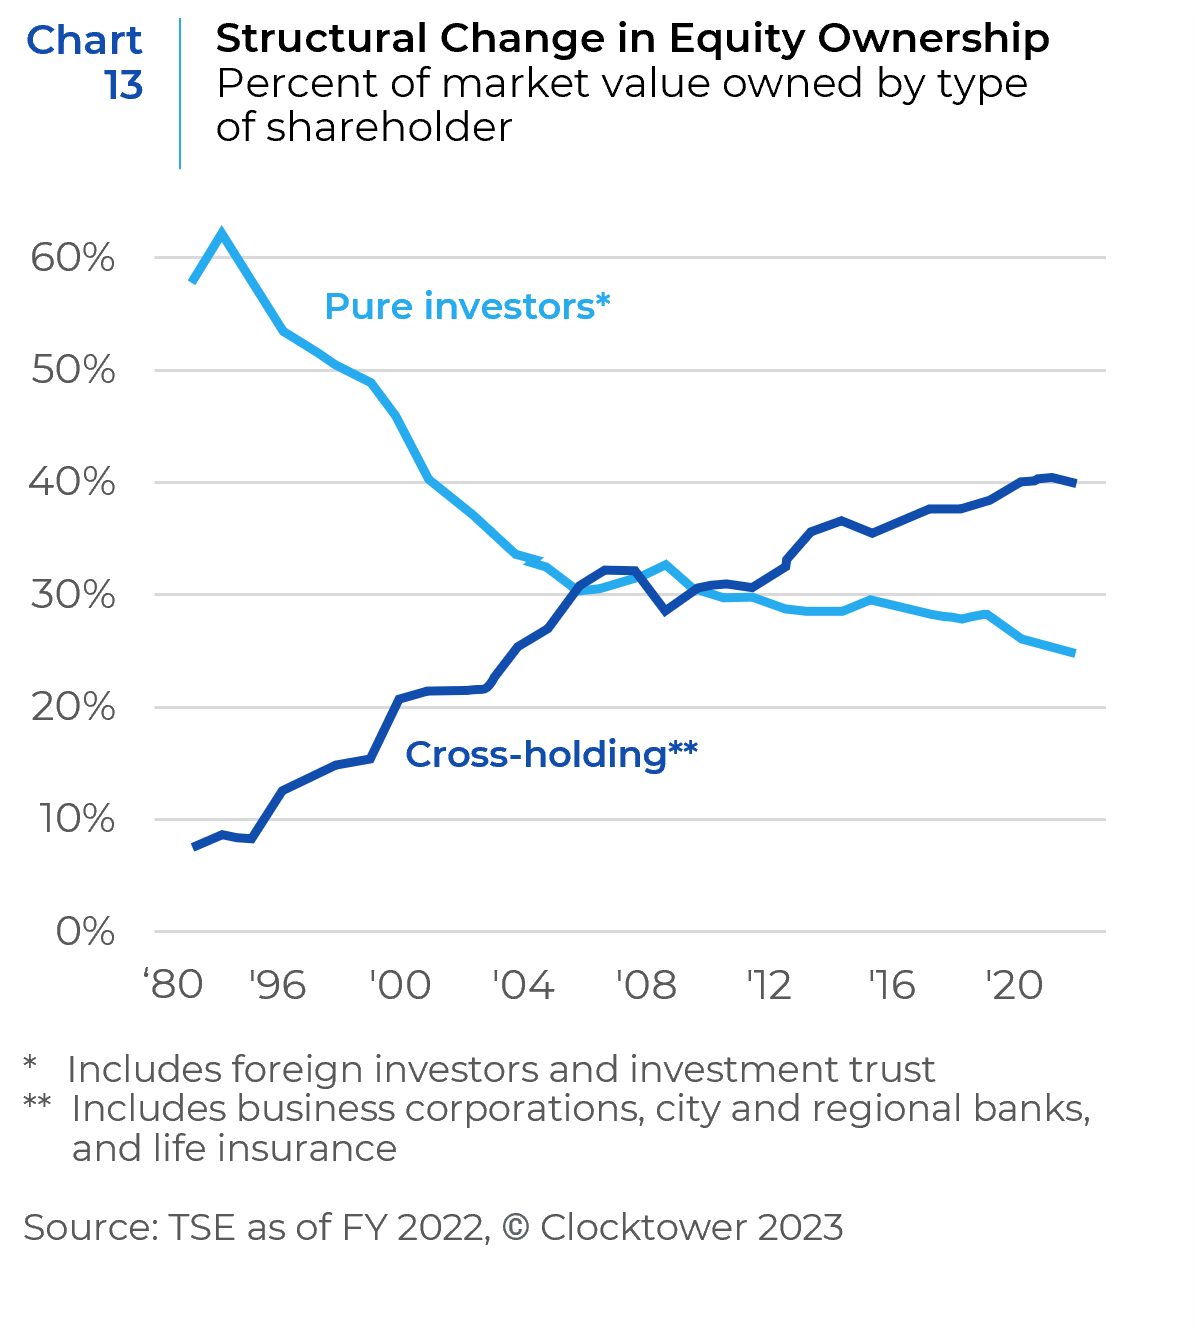
The final, and very large, segment of institutional investors in Japan are the net cash holdings of Japanese corporates. Bank of Japan data shows that roughly half of those net assets are held in listed equities (cross-holdings), the other half in private equity, mostly overseas FDI. The reforms to corporate governance in Japan are much discussed elsewhere, but in summary a myriad of incentives are now in place to drive these cross-holdings lower, and we expect the long-term structural trend of declining cross-holdings to continue as it has for the past 30 years (see Chart 13), making Japanese corporates likely to continue as net sellers of Japanese equities.
Mrs. Watanabe’s Giant Nest Egg
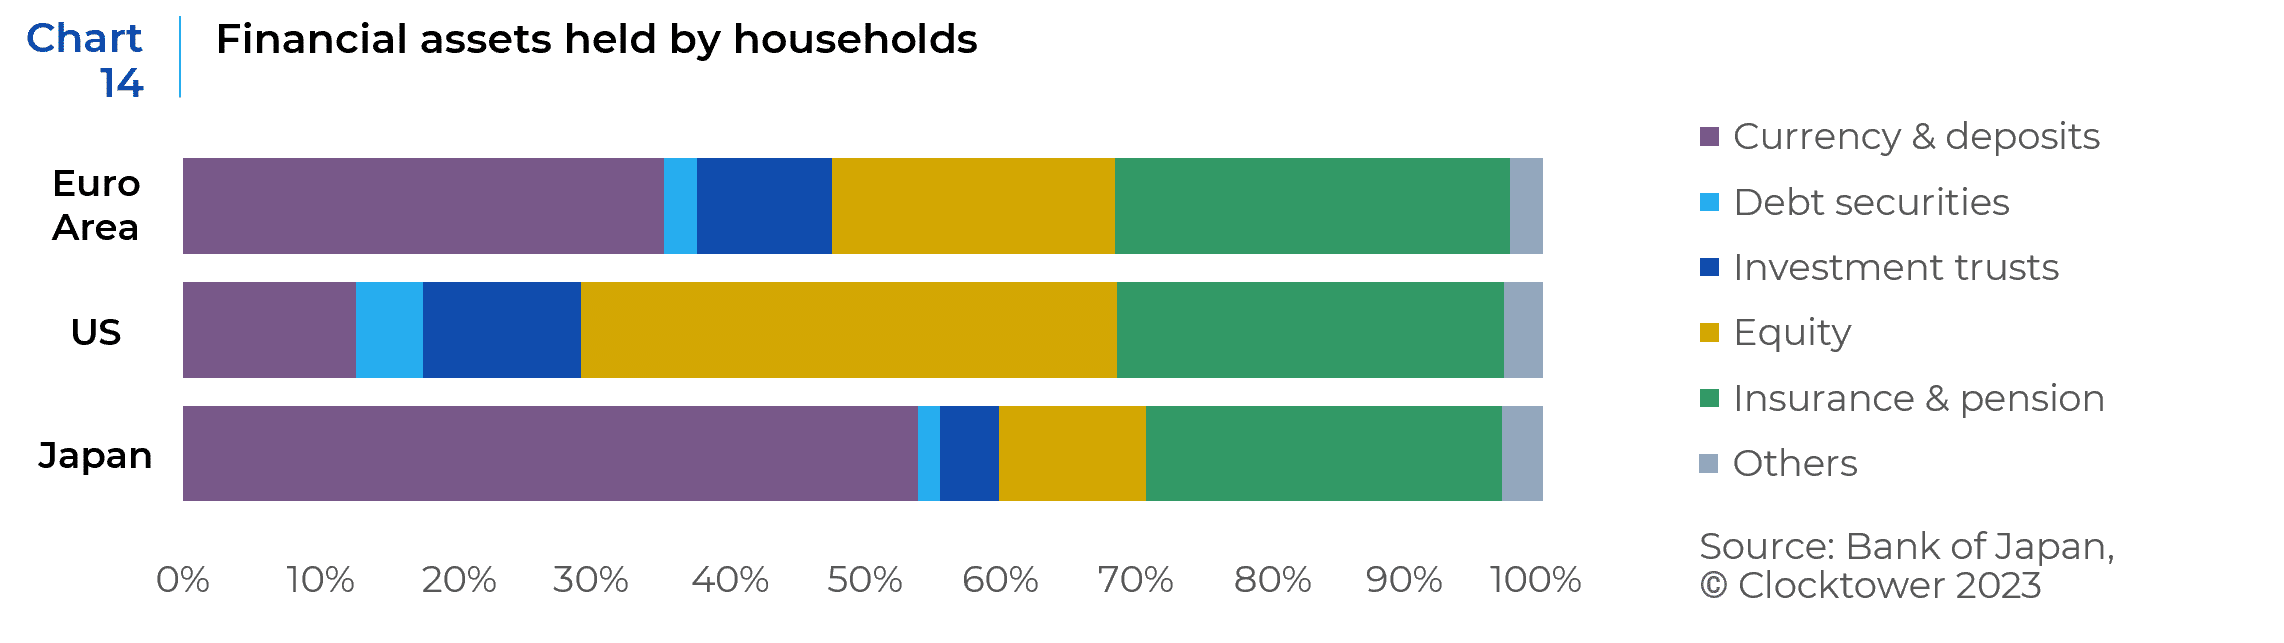
Household investors in Japan are sitting on USD $7 trillion in cash, about $1 trillion more than the estimated cash holdings of American households, despite the U.S. having more than 3x the population. Compared to even conservative, cash hoarding Europeans, Japanese households appear exceptionally frugal (see Chart 14). While equities have seen steady inflows over the past decade, Japanese households have also continued to add to their cash pile, albeit at a slightly slower rate (see Chart 15).

Like Japanese institutions, Japanese households rode the wave of the huge 30%+ return to their equity positions (in JPY) in 2023, resulting in a huge USD $525 billion surge in household wealth in 2023. This is the largest single year gain to Japanese household reserves into listed equities since at least 2005 and is equal to the largest single year percentage jump in equity exposure for Japanese households over the same period (see Chart 16). But flow data shows that in terms of new money, Japanese households appear to have mostly poured into overseas equity markets (see Chart 1714 & Chart 18).15


While 2023 was the best single year for Japanese household’s equity returns (in JPY) in a generation, it comes against the backdrop of historic changes in the Japanese economy and labor market that are simultaneously supportive of an historic change in risk appetite, most notably the end of deflation in Japan. Beyond just removing the poison of deflation, Japanese households are also seeing by far the largest income gains in a generation, which is also likely buoying risk appetite (see Chart 19). The 5.85% wage increase won in 2024 will only further extend this good mood and could even spill over to the broader economy. Japanese consumption has still not returned to pre-Covid levels (see Chart 20), but investors’ curiosity is clearly piqued (see Charts 21 and 22).


Part of this uptick in investor interest is also structural, given the brand new expansion of Japan’s Nippon Individual Savings Account (NISA) program. The NISA program – originally introduced in 2014 as a limited-time measure –became permanent starting January 2024. Like it’s IRA cousin in America, this is the first program to allow Japanese investors to save and invest with tax-exempt benefits. Beyond becoming permanent, the lifetime investment limit for a NISA account has been increased from ¥6-8 million ($40K to $53K) to ¥18 million ($120K). A recent Nomura survey of asset management companies had nearly 65% of respondents expecting NISA AUM growth of over 50% in the next 5 years. Importantly, the asset allocation of NISA investments is completely different than existing household savings, with 0% allocation to cash and over 80% to equities (see Chart 23 – approximately 70% of assets in Japanese investment trusts invest in stocks, which is split roughly evenly between foreign and domestic stocks).16 This means that the allocation to Japanese equities within NISA accounts has been roughly 70 cents of every dollar. The current size of the NISA market is about JPY 35 trillion (about USD $250 billion) and has been growing by JPY 5 trillion (about USD $35 billion), annual flows nearly equal to all of last year’s foreign inflows into Japan discussed above, with that pace set to grow following the new reforms. So far in 2024, flow data suggests that the vast majority of new NISA funds have poured into global and U.S. equities. But among the top 10 funds receiving NISA flows in the first two months following the expansion of the NISA program, is the largest Japanese fund focused on high dividend payers. This corroborates the Google trend data above, and is also a reflection of the premium now afforded by higher dividends in Japan than in the U.S. or emerging markets (see Chart 24). This also portends that Japanese investors still see their local market as the preferred source for income, and it is only the ongoing earnings/growth rally that is buoying their preferences for foreign equities.


Key Highlights on Japan’s Macro Backdrop
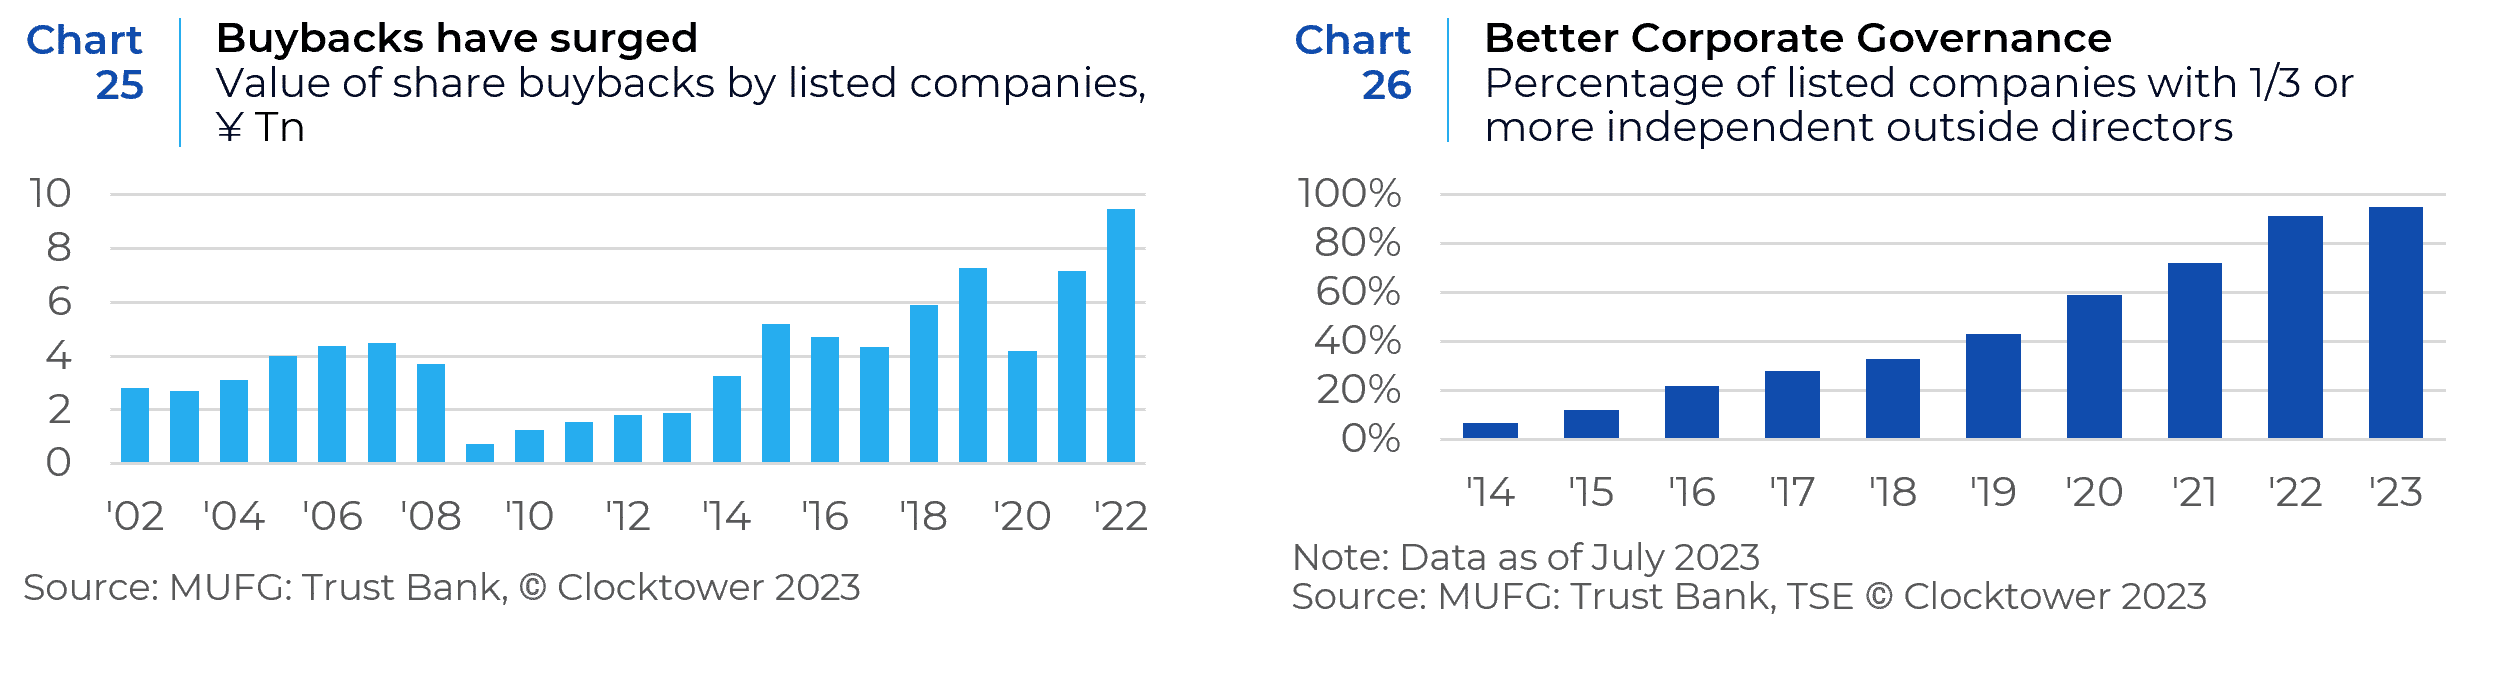
Against this change in the dynamics of local demand for Japanese risk assets, are an array of encouraging changes in Japan’s macroeconomic outlook and market structure. The much discussed end of deflation as well as improvements in Japanese corporate governance are real (Chart 25 and 26 but at this point widely known. Less well discussed in the recent conversation of Japan’s macro-evolution is the increasing tightness in the labor market (Chart 27), which has coincided with a generational change in female labor participation rate (Chart 28), which is now in line and even ahead of its global DM peers (Chart 29). Together this suggests that the slack in the Japanese labor market is increasingly exhausted, and while it this doesn’t mean that the current wage gains of 4-6% will persist, it should put enough of a floor on wages to ensure Japan does not return to its previous deflationary spiral. As discussed above, climbing wages at any level should also buoy the appetite for risk assets among Japanese savers.


Finally, the long deterioration of the yen has left its real effective exchange rate at a 50-year low (Chart 30) and so quietly Japan has become the cheapest source of labor among their major developed market peers (Chart 31). Long-term investors have taken note and FDI has been steadily rising, even if it remains a very small part of the overall economy (Chart 32).


What is not yet evident is a general demand driven economic boom, or really any material change in the prospects of real GDP growth in the market. Moreover, Japan is no longer quite as obviously cheap as it once was, though it does still remain cheaper on a P/B basis (Charts 33, 34, and 35).
Japan is not as cheap on a P/E basis…

….or compared to its own historical composite valuation…

….but still relatively cheap on a P/B basis

1 The U.S. Social Security Trust is larger ($2.8 trillion), but is only allowed to hold U.S. Treasuries and thus not generally regarded as a true pension fund.
2 https://asia.nikkei.com/Business/Finance/Japan-pension-giant-GPIF-opens-door-to-more-asset-managers
3 All institutional asset owners in Japan over $10 billion in assets for which data was available (represents 95% of estimated institutional
assets in Japan). “Public equity” and “Fixed Income” are aggregate allocations where foreign/domestic breakouts were not available.
4 Consistent data on hedging costs (given available Bloomberg subscription levels) is only available back to 2021, but prior PGM reporting shows the prior peak in hedging costs was in 2019 at roughly -70bps yield pickup.
6 GPIF 2023 Annual Report.
7 https://asia.nikkei.com/Business/Finance/Japan-pension-giant-GPIF-opens-door-to-more-asset-managers
8 Source: Sovereign Wealth Fund Institute
9 Source: GPIF Annual Report
10 Source: Bank of Japan, Flow of Funds.
13 Source: Life Insurance Association of Japan (https://www.seiho.or.jp/english/statistics/trend/pdf/2022.pdf)
14 BoJ data categorizes “listed shares” (shares listed in Japan), “unlisted shares” (shares not listed in Japan), as well as “investment trusts” (mutual funds), and other. Unlisted shares are understood to mostly foreign equities held in local brokerage accounts but may also include unlisted or over-the-counter shares of Japanese small caps.
16 Source: Investment Trusts Association of Japan, https://www.toushin.or.jp/english/statistics/.