
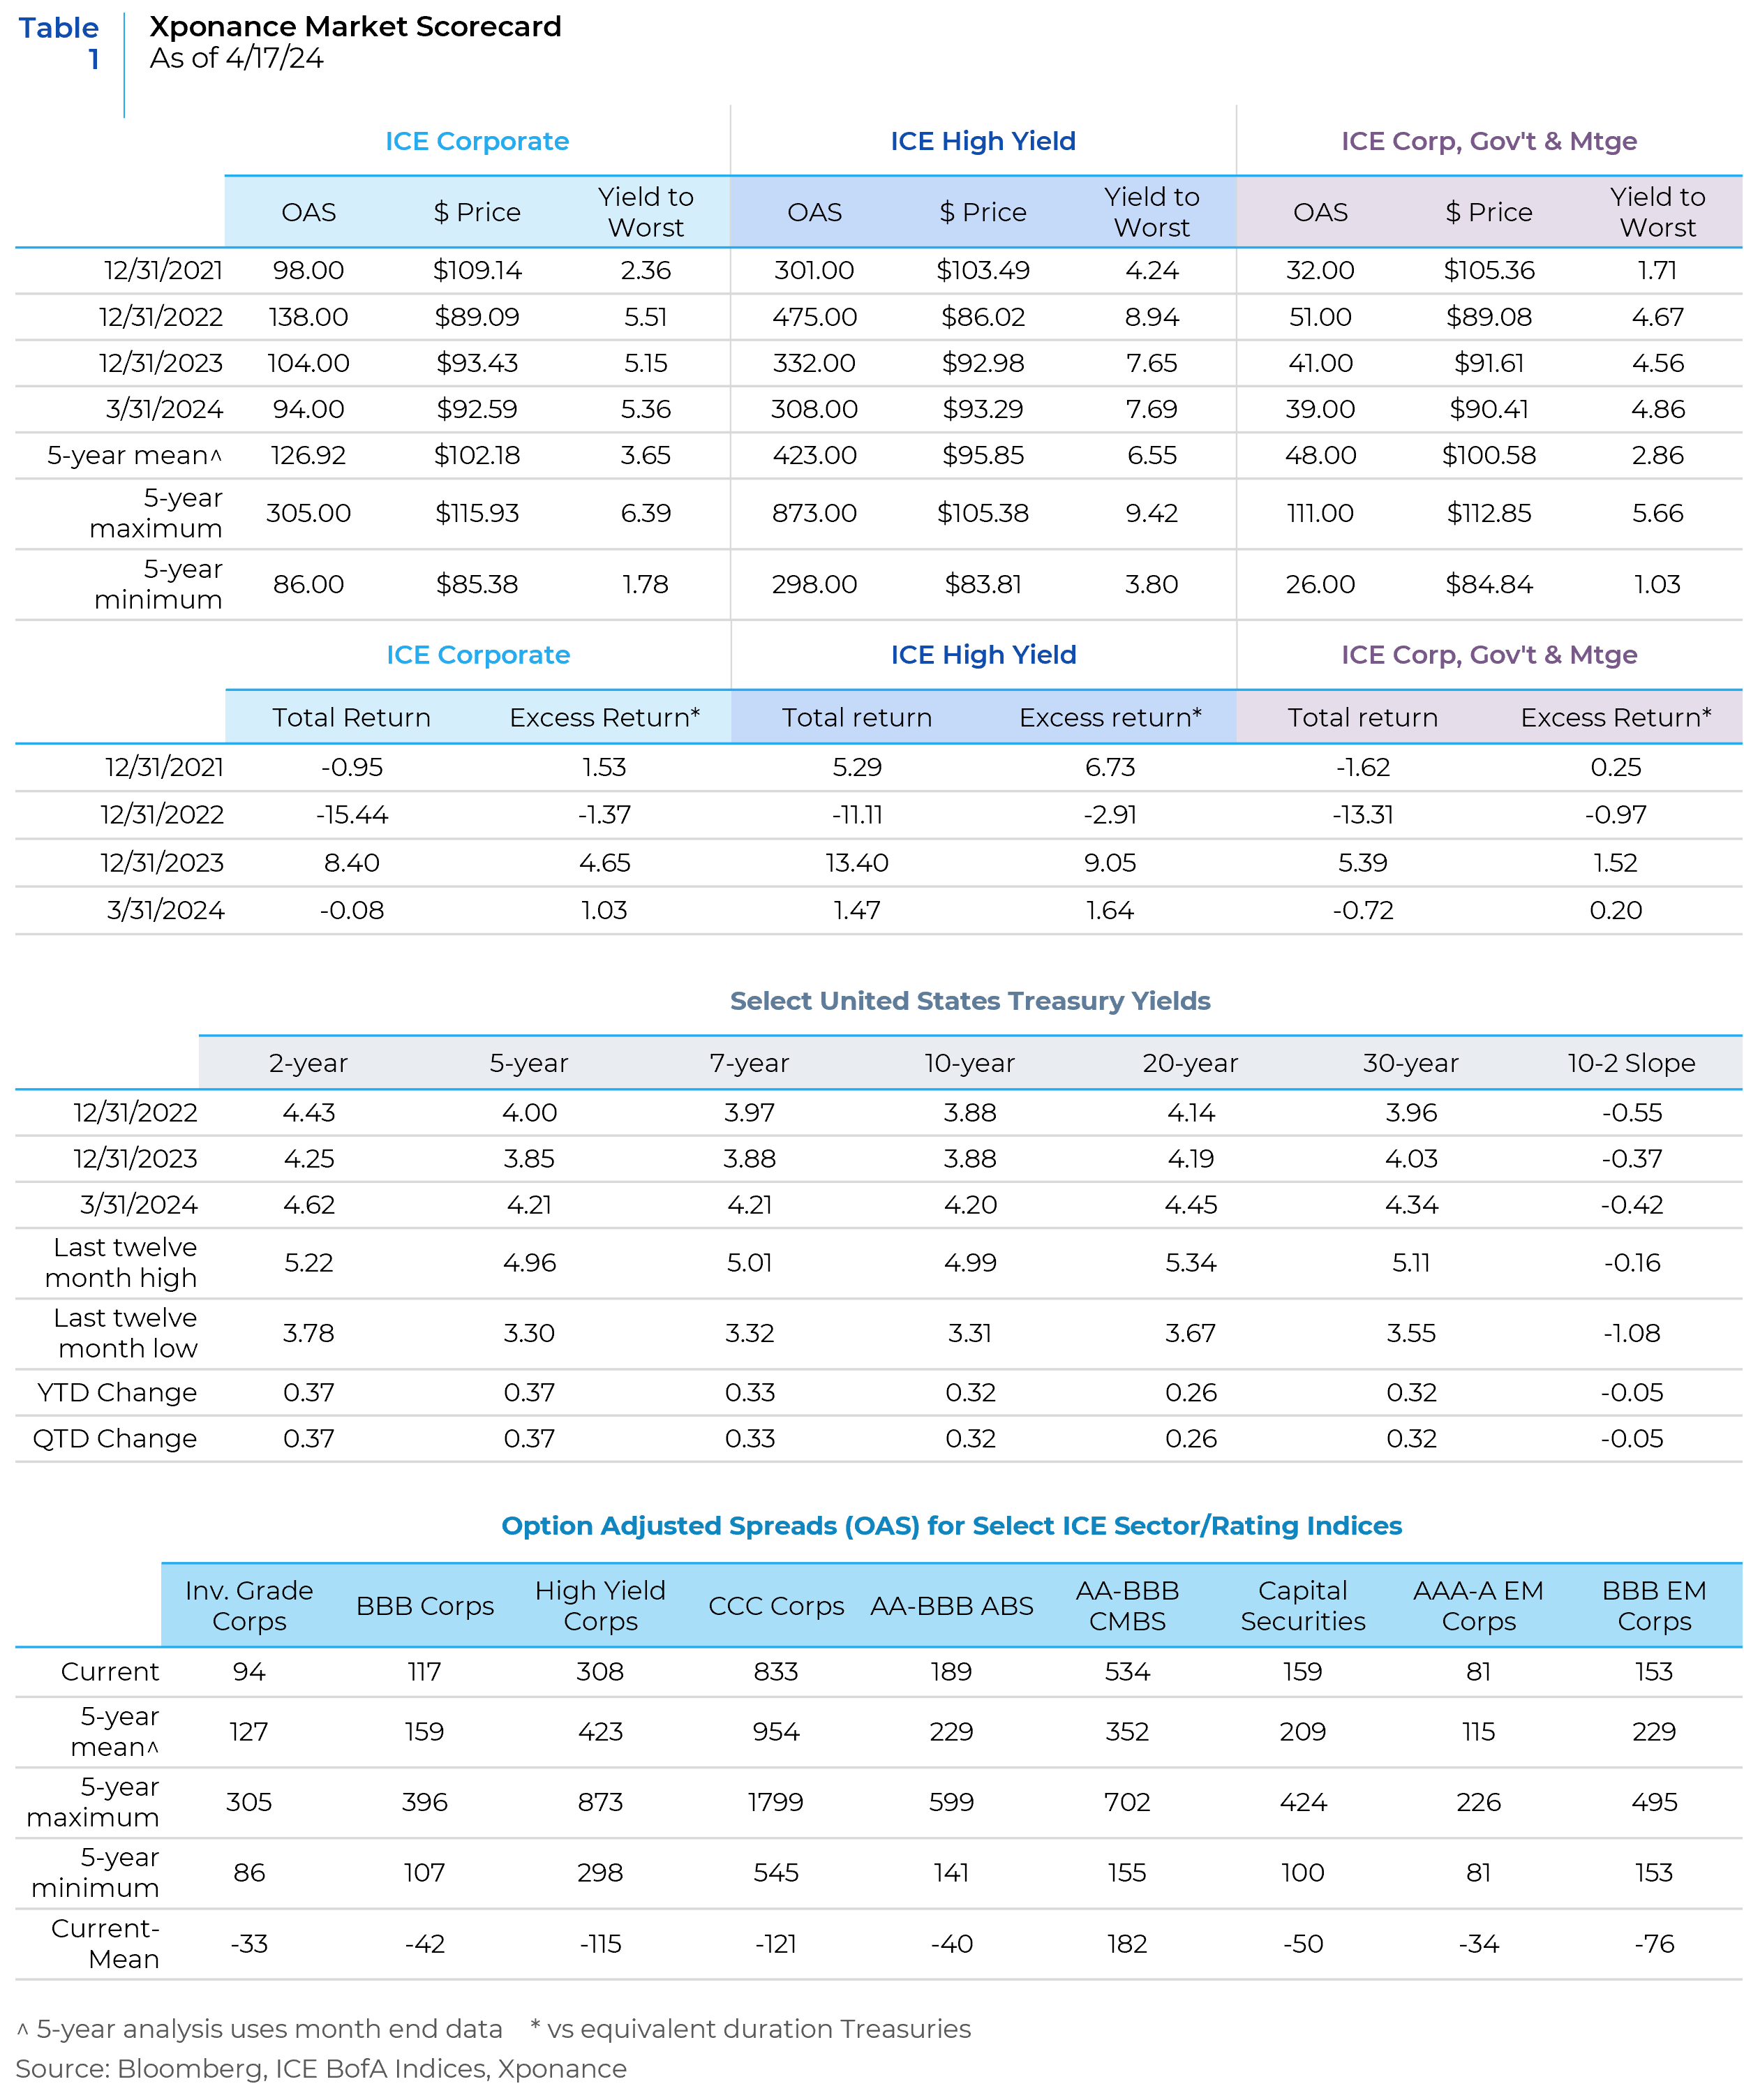
As we close the books on the first quarter of 2024, we are once again struck by the contradiction between careful data analysis and changing narratives regarding market direction. In our 4Q23 review, we noted that the idea of futures markets and market participants expecting 6-7 interest rate cuts by the Federal Open Market Committee (FOMC) over the course of the year made little sense absent a complete economic meltdown. As it turns out, we may end up with zero cuts by the FOMC, with the market currently pricing in only two (as of 4/17/24). This rapid and significant increase in yields has been evident (see Market Scorecard, below).
While the market’s anticipation of large Fed Funds rate reductions has disappeared, many fixed income markets continue to predict smooth sailing with no storm clouds on the horizon. However, we have also noted in previous outlooks that some corners of the market (though very few) are beginning to prepare for foul weather.
To begin, we undertook a favorite analysis of ours, measuring the dispersion of sector spreads underlying the corporate index. With little differentiation among and between corporate sectors, we believe investors are abdicating careful credit analysis in favor of leaning into the now infamous “Fed pivot.” Furthermore, higher quality spreads are not differentiating among credit quality buckets, suggesting that ratings migration and potential defaults are a non-factor in the intermediate term (a notion with which we disagree). In our view, the FOMC has been backed into a corner. Inflation has not allowed them to reduce rates, but the “higher for longer” reality makes an economic downturn more likely, given the lagged nature of the monetary policy transmission mechanism. To emphasize the credit quality point, we also provide an analysis of credit spread ratios between ratings cohorts and the broader indices. Lastly, we highlight an interesting dollar price dynamic in terms of spread compensation for premiums and (lack thereof) for discounted corporate bonds.
When we break down the corporate index into its level 3 subsectors, we find that the current dispersion in credit spread (using option-adjusted spread, OAS, over the past five years) between the highest and lowest spread sectors is at the lowest it has been since the Fed tightening campaign began in 1Q22 (but is closer to the median over the 5-year period). However, this metric has not returned to the low levels that prevailed prior to the pandemic.
We typically analyze OAS dispersion in two ways to discern market sentiment. First, we compare this dispersion to the overall spread on the index. Second, we consider what information we can glean from the sectors that typically have the highest spreads. Overall, the size of the dispersion range is roughly 0.8 standard deviations tight to the 5-year average, while the spread of the overall corporate index is about 1 standard deviation tight. Generally, we would view this as one indicator of positive sentiment for risk assets. However, given that some credit indicators in the real economy are flashing warning signals, we believe this speaks more to stretched valuations than a sustainable risk appetite.
When we examine individual sector spreads, we arrive at a similar conclusion. Real Estate Investment Trusts (REITs), for example, are generally among the widest spread sectors (most notably when overall spreads are at their widest cyclical levels). Yet, currently, they are near the absolute lows over the past five years. When we contrast this with the fact that spreads for credit (i.e., below AAA) commercial-mortgage-backed securities (CMBS) are the only broad market sector significantly deviating from its five-year mean, an irreconcilable valuation difference in the broad commercial property sector becomes apparent. Clearly, other factors are at play here, including the liquidity component affecting the CMBS spread, but the divergent directionality poses a problem.
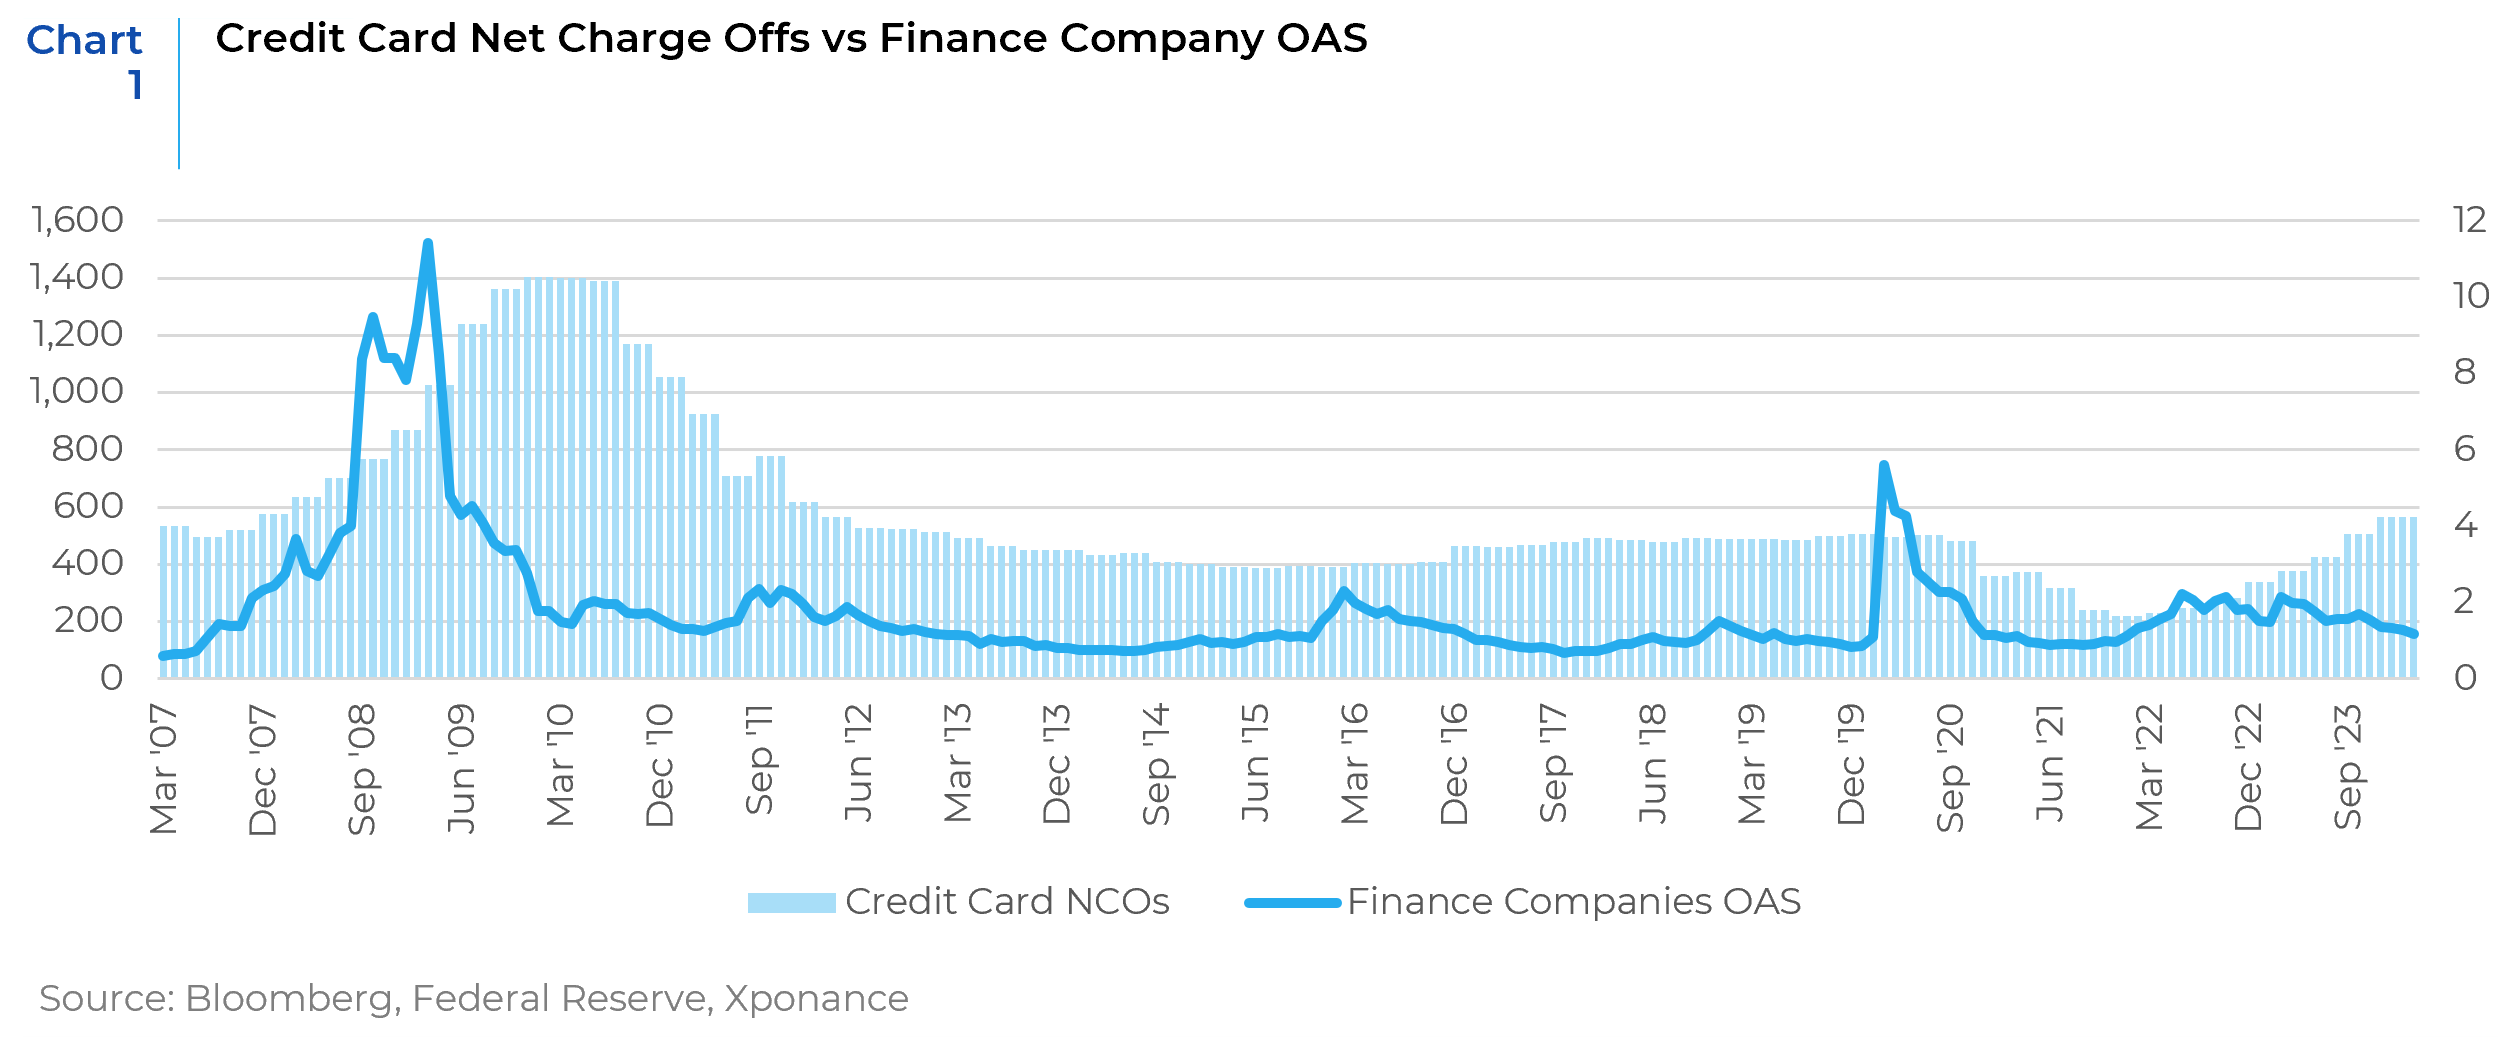
Similarly, finance companies, that are highly sensitive to economic conditions, have seen their spreads tighten to levels not witnessed since before the Federal Open Market Committee (FOMC) began its hiking cycle. This tightening occurs despite credit card charge-off rates climbing from the all-time low reached in 2021 to the highest level since the immediate aftermath of the Global Financial Crisis (GFC). Typically, charge-off rates serve as leading indicators for spread widening, reinforcing our view that the market is pricing in a Fed easing cycle without fully accounting for the economic deterioration that is already underway.
When we delve into an analysis of credit quality cohorts, the contradictions persist. This behavior is common in late-cycle markets where the ultimate price direction of risk assets is not in question, but the timing remains uncertain (resulting in a differentiation between fundamental risk and mark-to-market risk).
Nonetheless, BBB spreads (the lowest broad category of investment grade) currently convey a fundamentally different story than CCC/C spreads (the lowest broad category of high yield spreads). To clarify, S&P’s most recent rating migration and default study notes that the BBB category implies a 5-year cumulative default rate of just 1.79%, whereas CCC default rates exceed 50%. The CCC option-adjusted-spread ratio was approximately 2.7 times the broader high yield OAS as of 3/31/24 (well above the 5-year mean of 2.08x), whereas the BBB OAS was below the long-term mean.
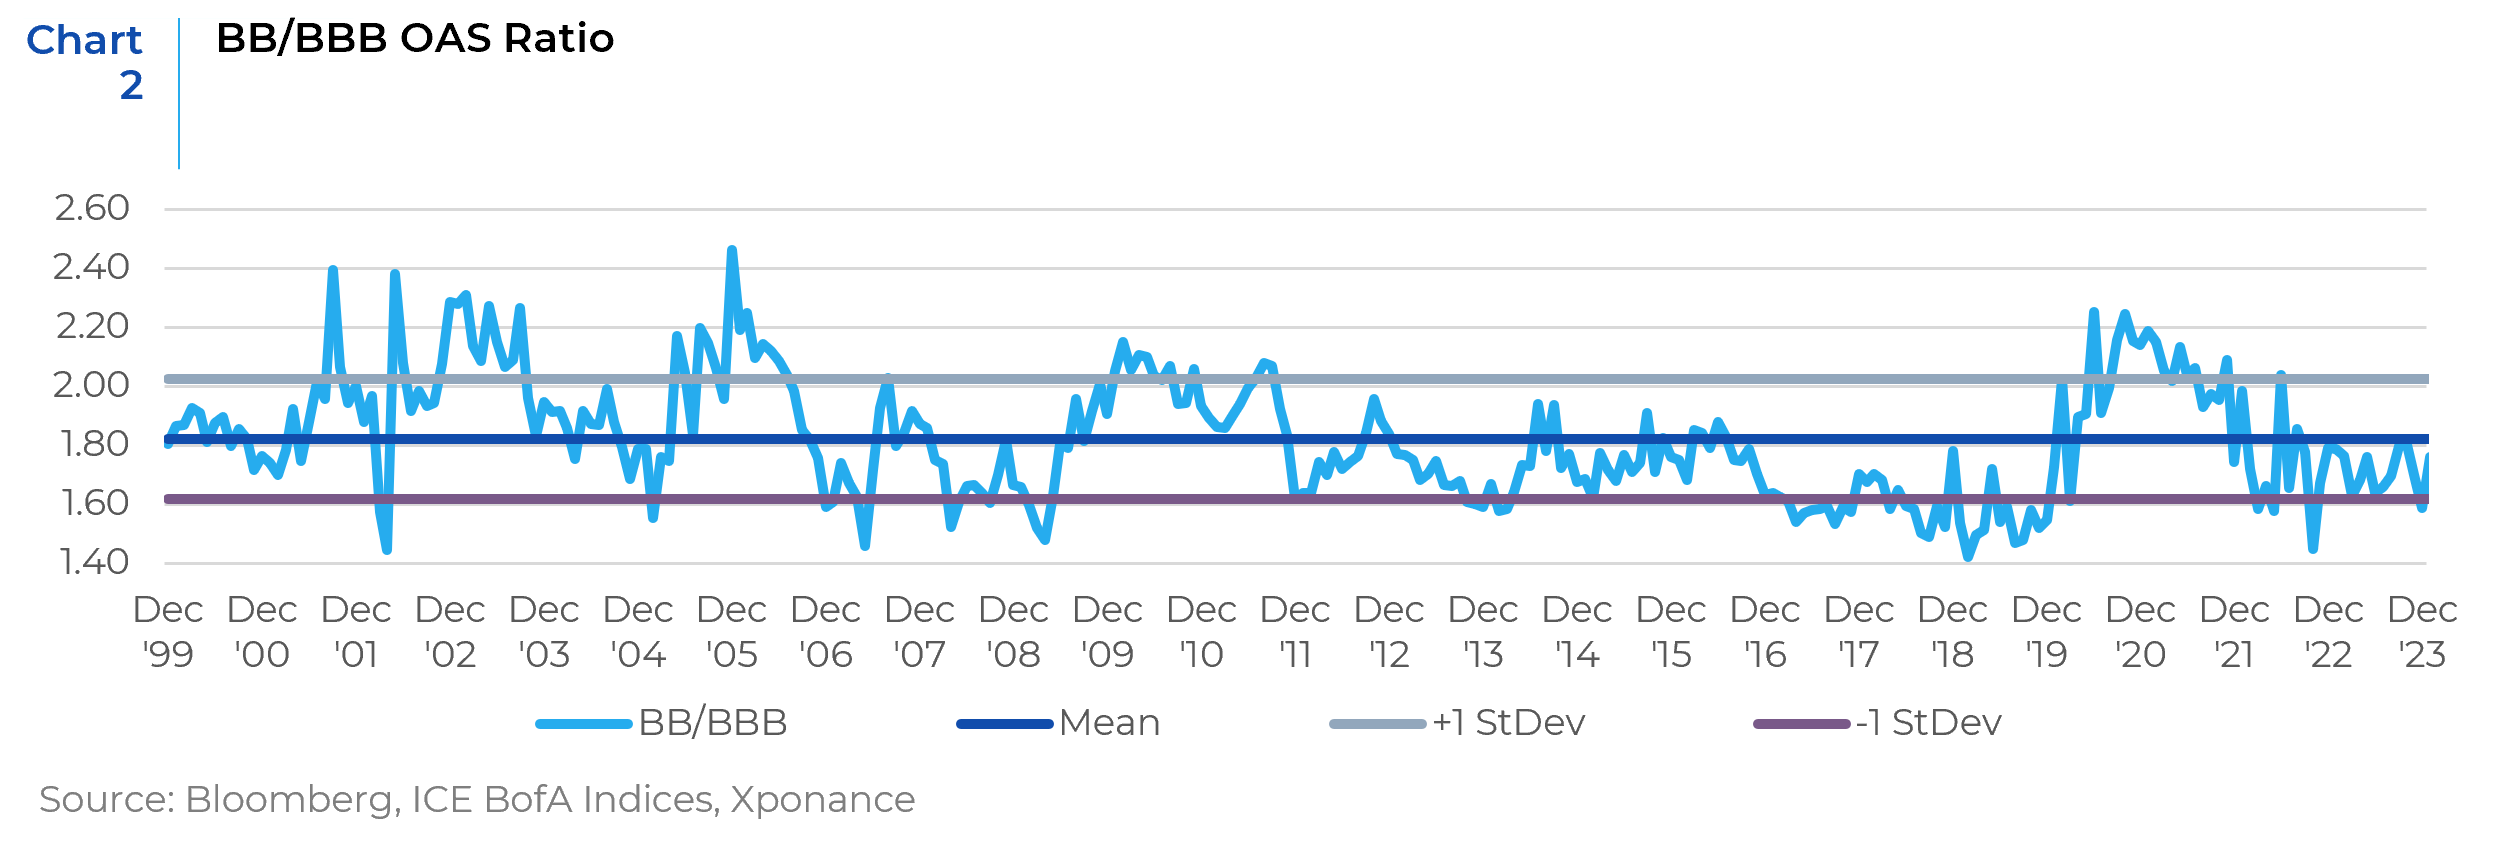
An additional noteworthy observation is the complete lack of differentiation between BBB and BB spreads. This is intriguing for two reasons: First, the 5-year default rate for BB corporates is significantly higher than that for BBBs (7.26% vs. 1.79%). Second, BBs tend to migrate to lower rating levels more frequently than BBBs transitioning to high yield. As we highlighted in our last quarter’s analysis, default rates have risen and are not expected to decline significantly in the near term due to the substantial increase in interest costs and the persistence of this dynamic within an overall higher-for-longer rate regime.
Our final observation is an interesting one against the backdrop of both tight credit spreads and the “higher for longer” rate dynamic. Investment-grade credit instruments—typically corporate bonds but also taxable municipals, sovereigns, and supranationals—generally exhibit different spreads depending on their deviation from par. High-dollar price bonds (i.e., those with a coupon significantly greater than market rate coupons) have historically provided extra spread compensation compared to a par bond for a given tenor. As a rule of thumb, this compensation amounted to approximately 1 basis point (bp) premium for each dollar of price premium.
Although the low dollar price dynamic that prevailed after the Federal Open Market Committee (FOMC) began its hiking cycle was a historical anomaly, discounted bonds exhibited the same dynamic, albeit in reverse. In the period immediately following the bulk of the tightening cycle, corporate bonds would typically have a 1 bp spread discount for each dollar of price discount. However, this feature of corporate bond trading has diminished. Deeply discounted bonds now have very little spread discount relative to par or premium bonds.
This shift has opened up a different set of trading opportunities compared to what we observed 6-12 months ago. The convexity of these lower dollar price bonds provides protection against upward spread or yield movements, but it also results in an owner’s coupon/income deficit in an environment where yields and spreads remain relatively static.
Given the discussion above, what does this mean for real-world fixed income portfolios? There is very little opportunity cost in avoiding potentially underperforming securities, especially considering that the spread component of total yield is significantly smaller compared to much of the post-GFC zero interest rate period (ZIRP). It is still possible to construct a yield-advantaged portfolio without exposing it to higher downside risk and greater volatility in specific securities and sectors. Given the compression between BBB and BB corporates, and the much higher potential spread for BB-rated instruments, keeping the high yield allocation minimal for investors benchmarked against the Bloomberg Aggregate is prudent. Furthermore, historically high beta sectors like REITs, finance companies, and midstream energy currently have nearly identical spreads to lower beta sectors, providing opportunities for equivalent yield with lesser downside risk. On the dollar price discount question, trading opportunities exist where one can exploit the changing relationship between dollar price and spread, and then reverse the trade as the relationships revert to more historical norms. As always, even when valuation metrics are stretched, opportunities remain in fixed income markets. Right now, these are more prevalent in the investment-grade space, but we anticipate more opportunities in high-quality high yield and peripheral markets like hybrids as the economic cycle continues to play out.
This report is neither an offer to sell nor a solicitation to invest in any product offered by Xponance® and should not be considered as investment advice. This report was prepared for clients and prospective clients of Xponance® and is intended to be used solely by such clients and prospective clients for educational and illustrative purposes. The information contained herein is proprietary to Xponance® and may not be duplicated or used for any purpose other than the educational purpose for which it has been provided. Any unauthorized use, duplication or disclosure of this report is strictly prohibited.
This report is based on information believed to be correct but is subject to revision. Although the information provided herein has been obtained from sources which Xponance® believes to be reliable, Xponance® does not guarantee its accuracy, and such information may be incomplete or condensed. Additional information is available from Xponance® upon request. All performance and other projections are historical and do not guarantee future performance. No assurance can be given that any particular investment objective or strategy will be achieved at a given time and actual investment results may vary over any given time.