
Balancing on a Tightrope
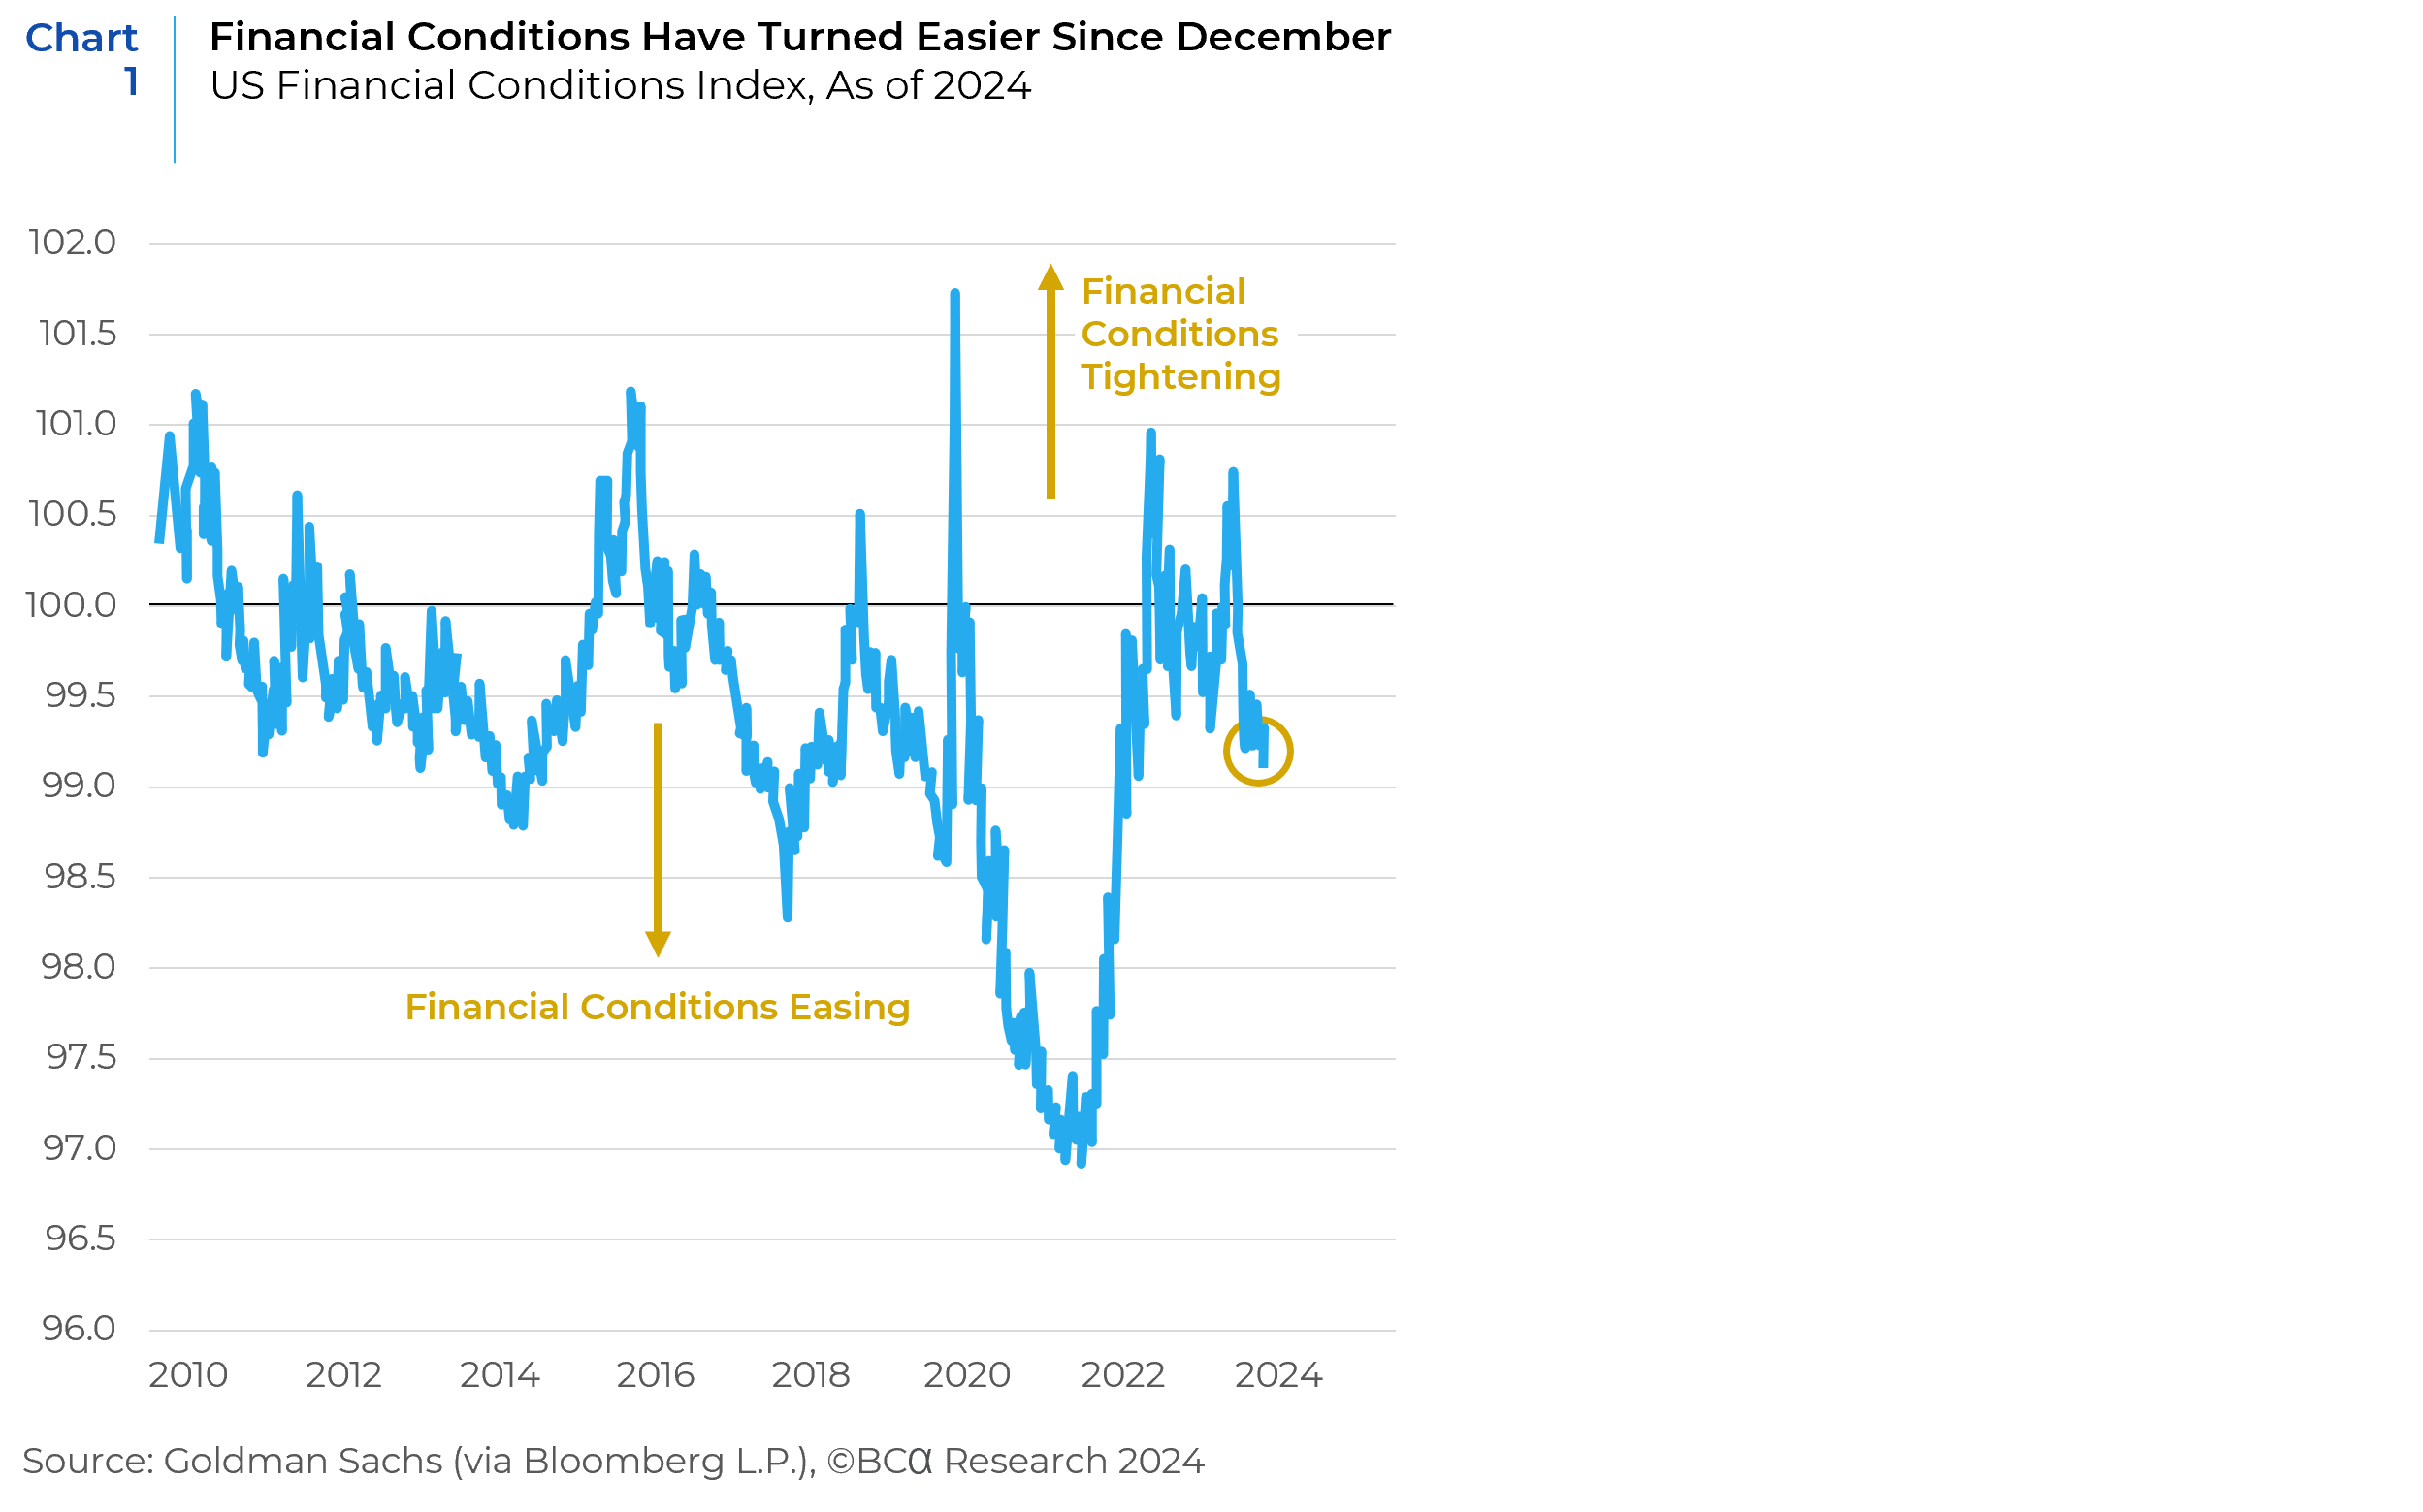
The soft-landing narrative caused the rally in equity markets to broaden in the first quarter of 2024. While the Fed has not delivered the anticipated interest rate cuts, there seems to be more confidence about the 2024 outlook for the US economy than there was at the end of last year. Financial conditions have improved (Chart 1), GDP numbers look promising, corporate earnings have been better than anticipated, labor market conditions remain strong, manufacturing has increased, and market breadth has expanded. However, this has happened alongside higher-than-expected inflation figures, a rise in consumer debt, a fall in consumer spending, and dropping levels of consumer confidence. As we enter the second quarter of the year, market participants appear to be performing a balancing act on a tightrope amidst the crosscurrents of the macroeconomic data flow.
The Good News First…
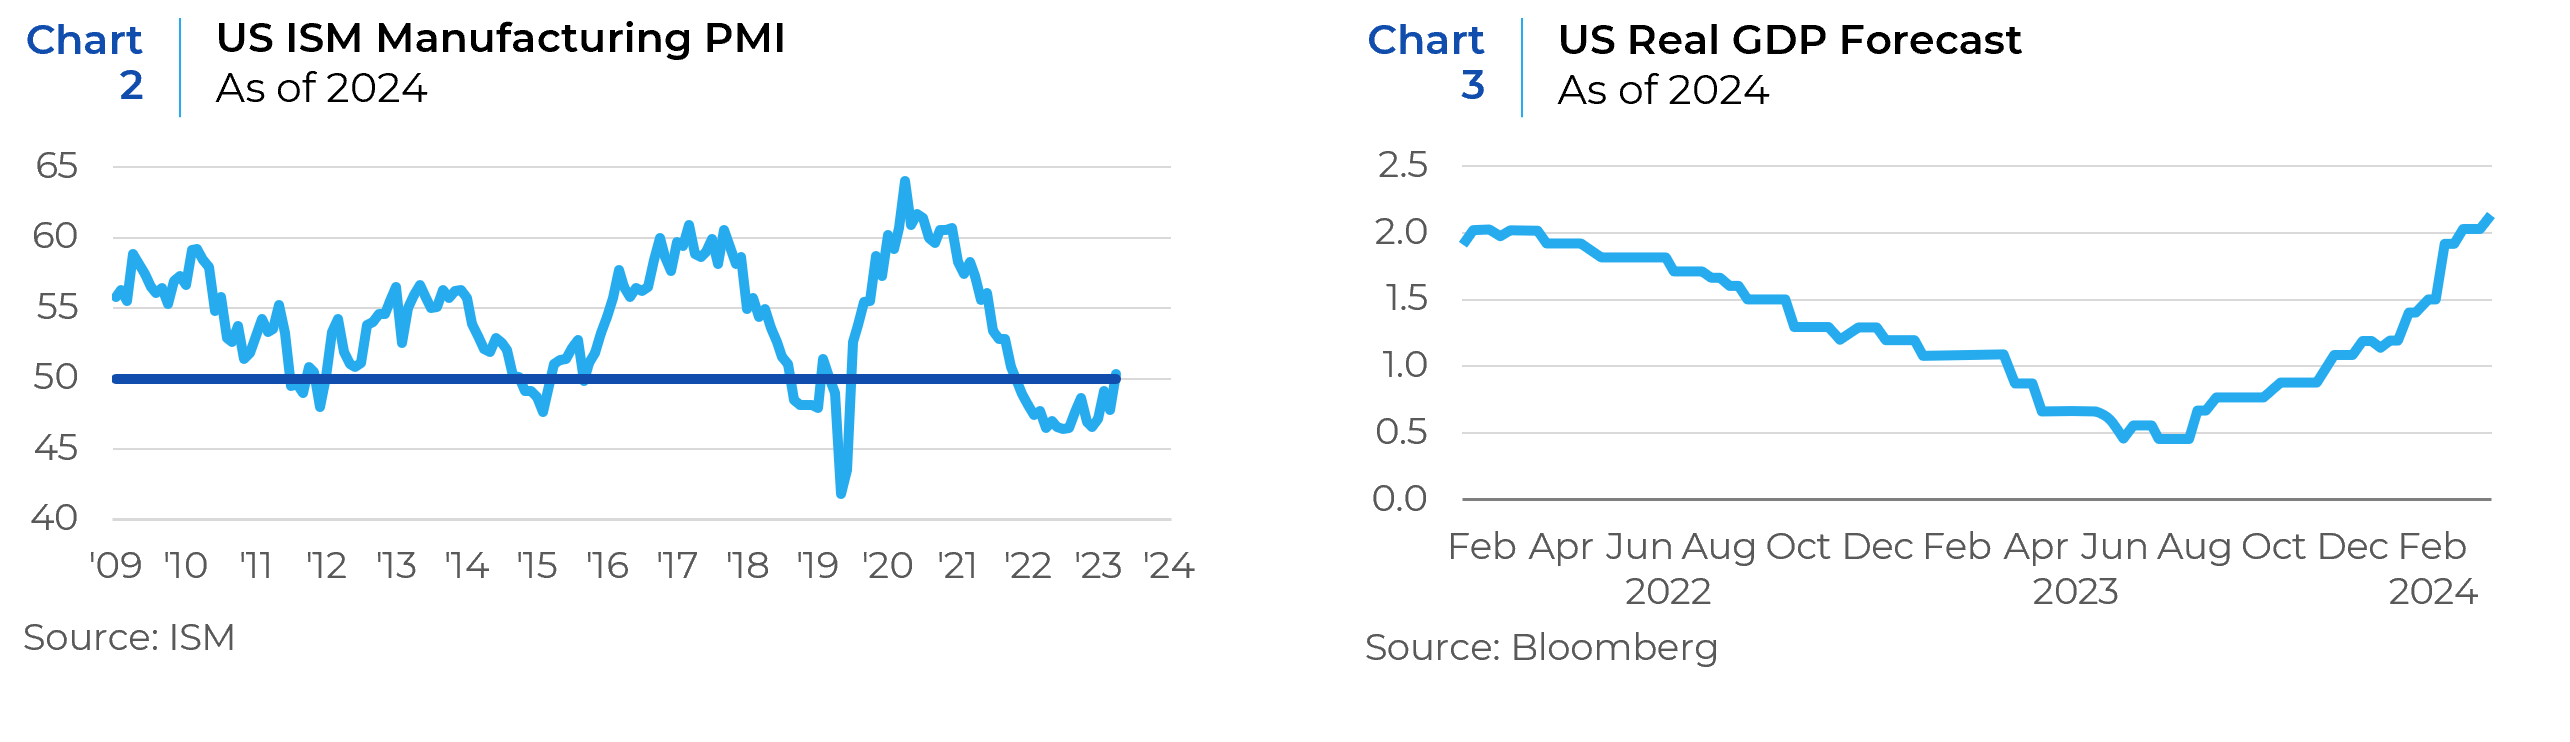
There has been a slew of positive US economic data, all suggesting that economic conditions remain robust. The ISM Manufacturing PMI crossed into expansion territory for the first time since September 2022 (Chart 2). Similarly, the Atlanta Fed GDPNow model has Q1 GDP growth tracking 2.5%, up from a low of 2.0% in mid-March and economists continue to upgrade their US GDP growth forecasts for 2024 (Chart 3).
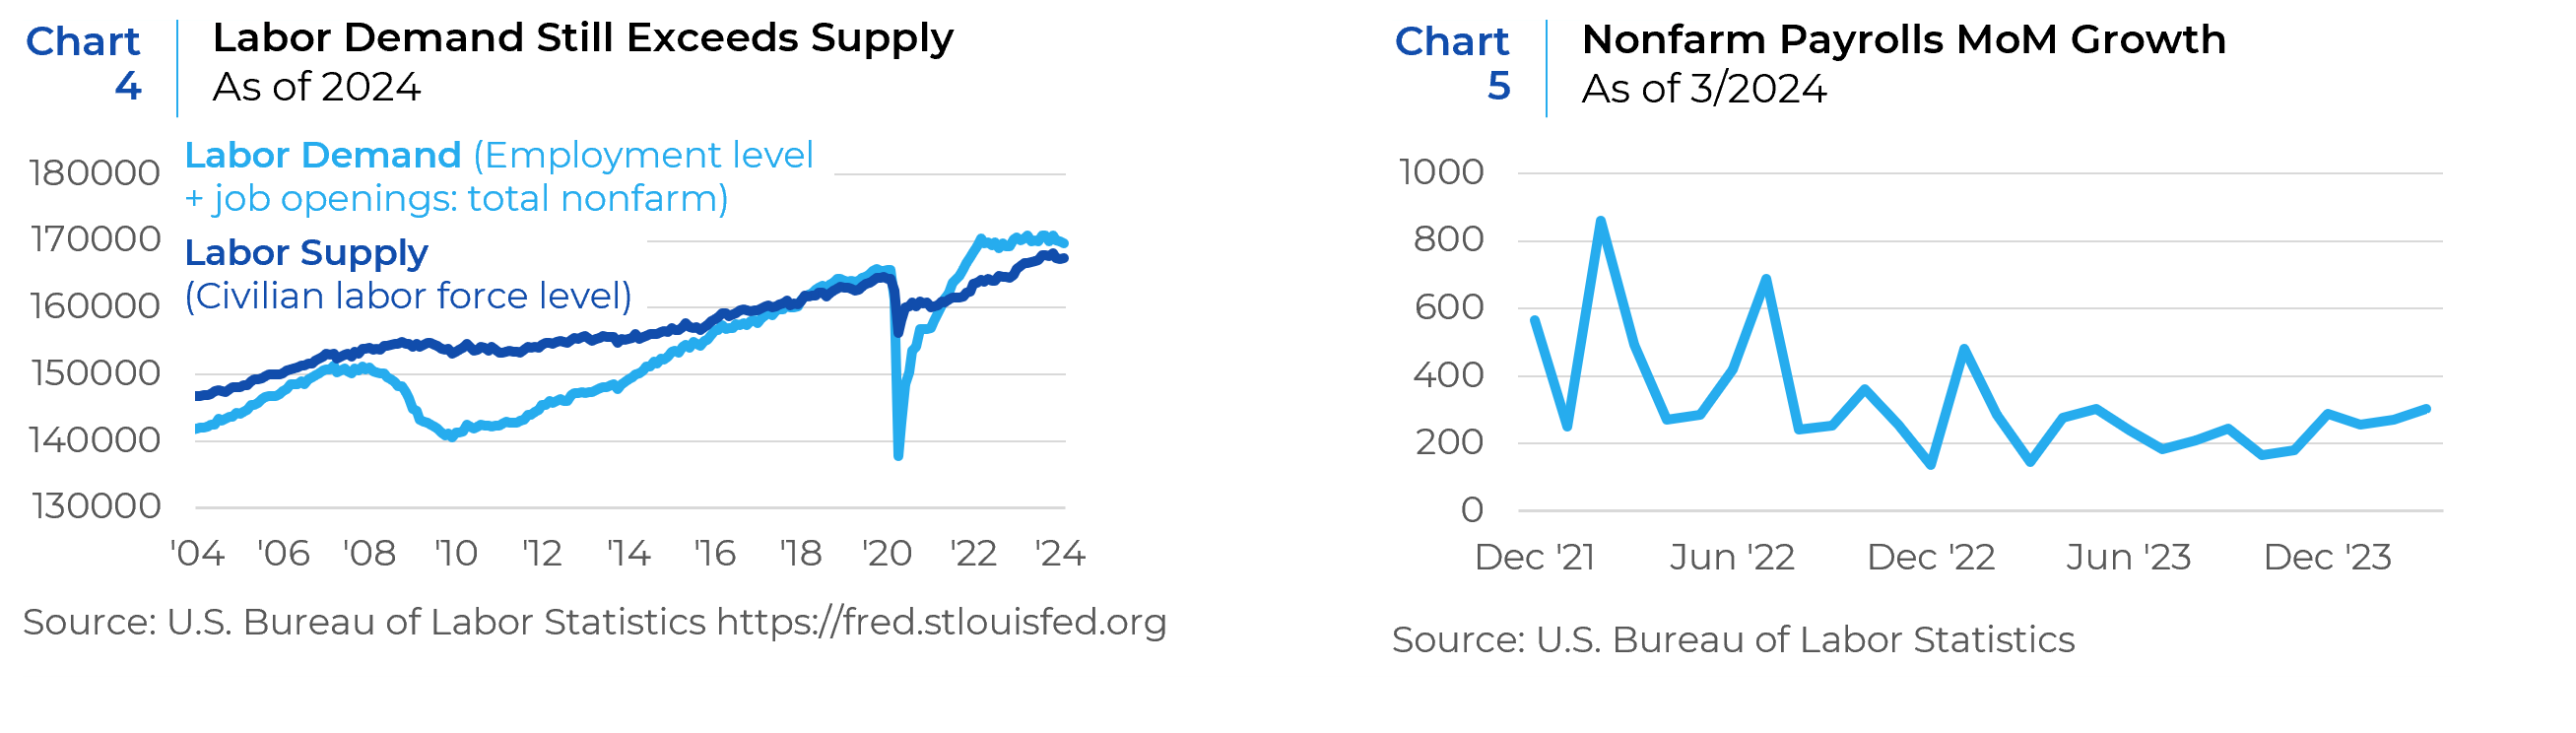
The labor market continues to remain resilient and is not flashing any recessionary signals. Labor demand still exceeds supply (Chart 4) and job growth continues to be strong (Chart 5)
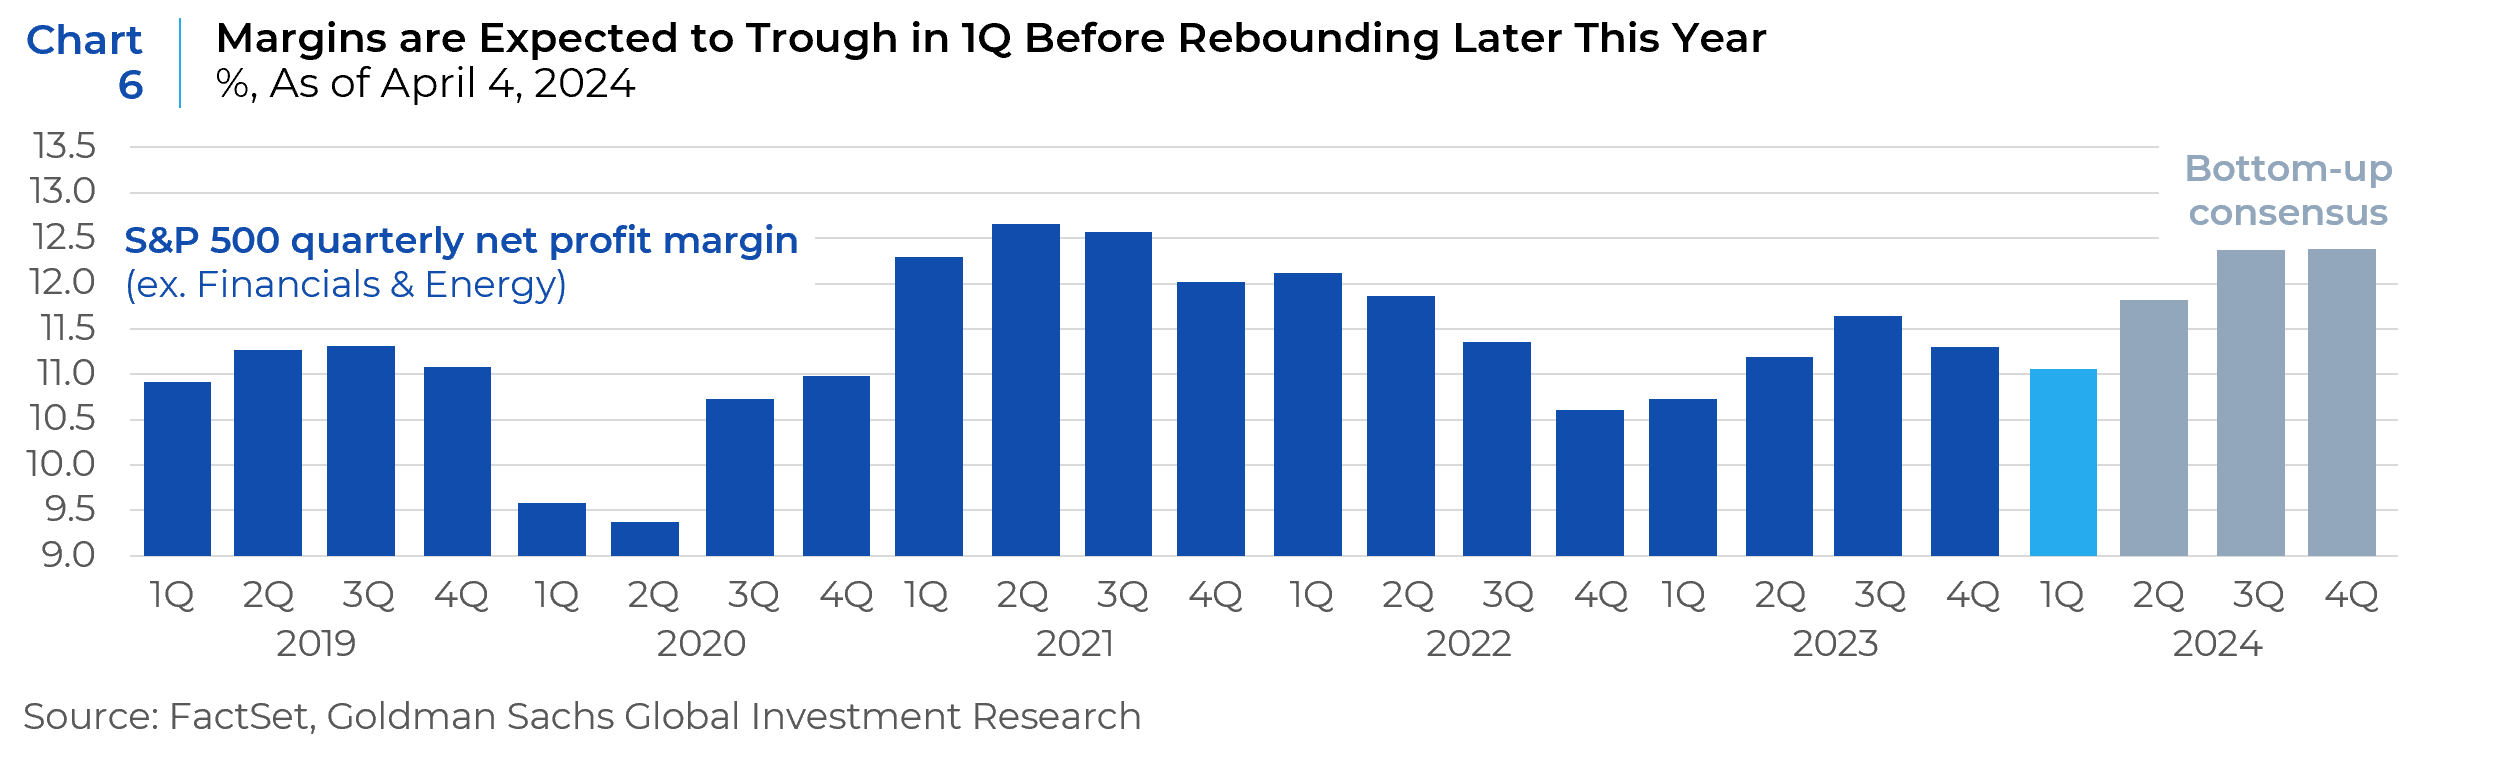
Investors have also become more optimistic. Results of a recent AAII (American Association of Individual Investors) Sentiment Survey show that over half of respondents describe the current economic state as “good” or “great,” 39% consider it “mixed,” and only 8% view it as “lousy.” A resilient economy and strong consumer demand are expected to fuel a rise in earnings growth for S&P 500 companies. S&P 500 margins are expected to sequentially trough in 1Q but expected to rebound in the following quarters of the year (Chart 6).
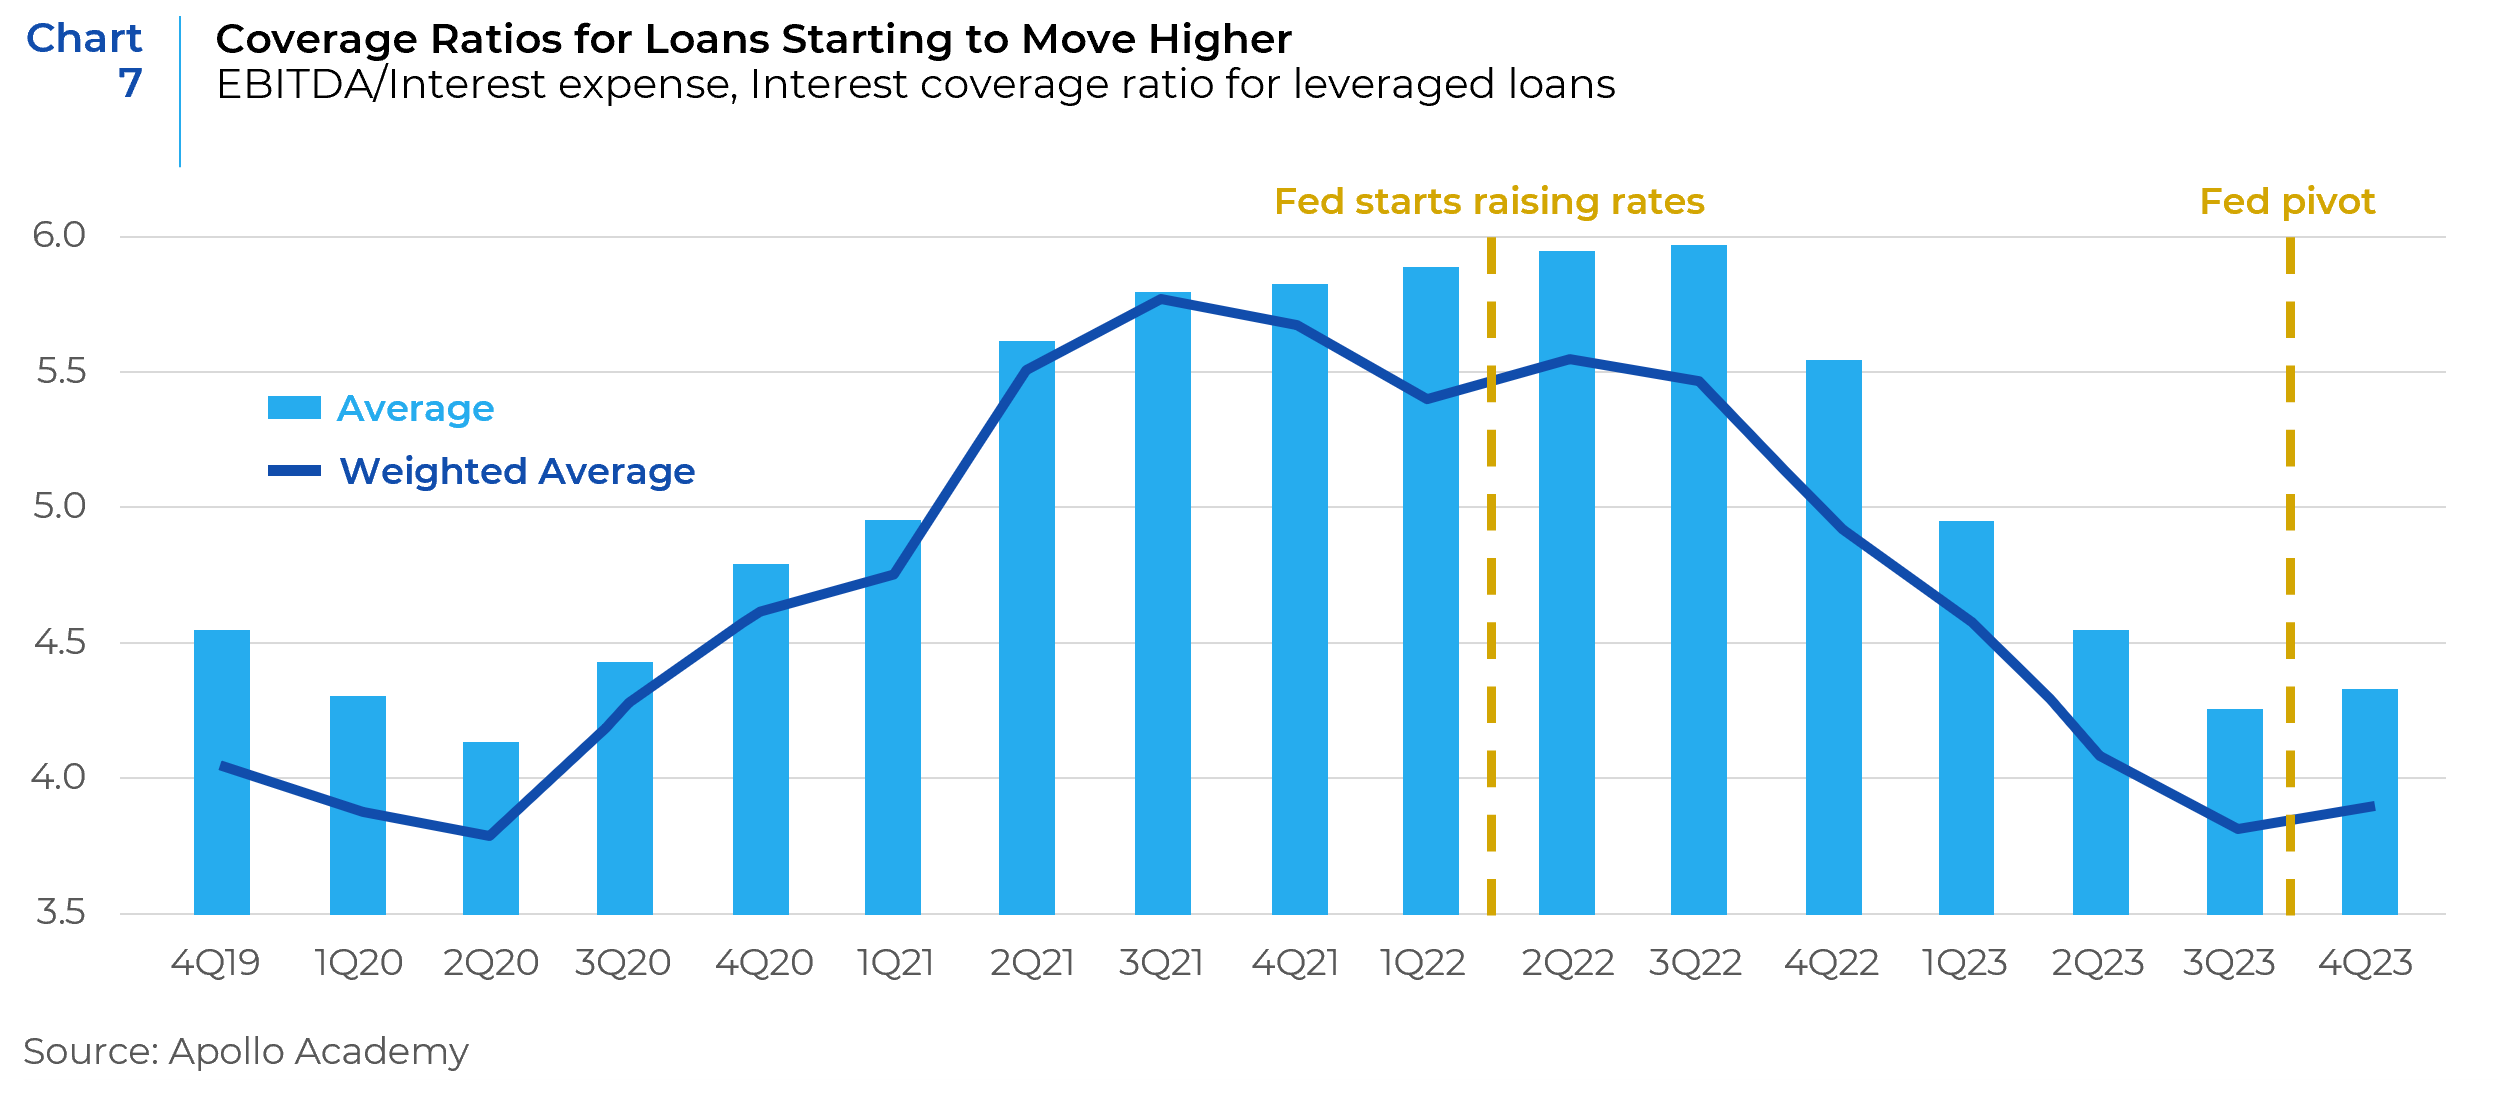
Better revenues and margins are leading to higher interest coverage. Coverage ratios started to decline (Chart 7) when the Fed began hiking rates in March 2022, and started to recover when the Fed became more accommodative at the November 2023 FOMC meeting. The robust economy and earnings along with very favorable financial conditions are helping companies manage their balance sheets, including high debt levels.
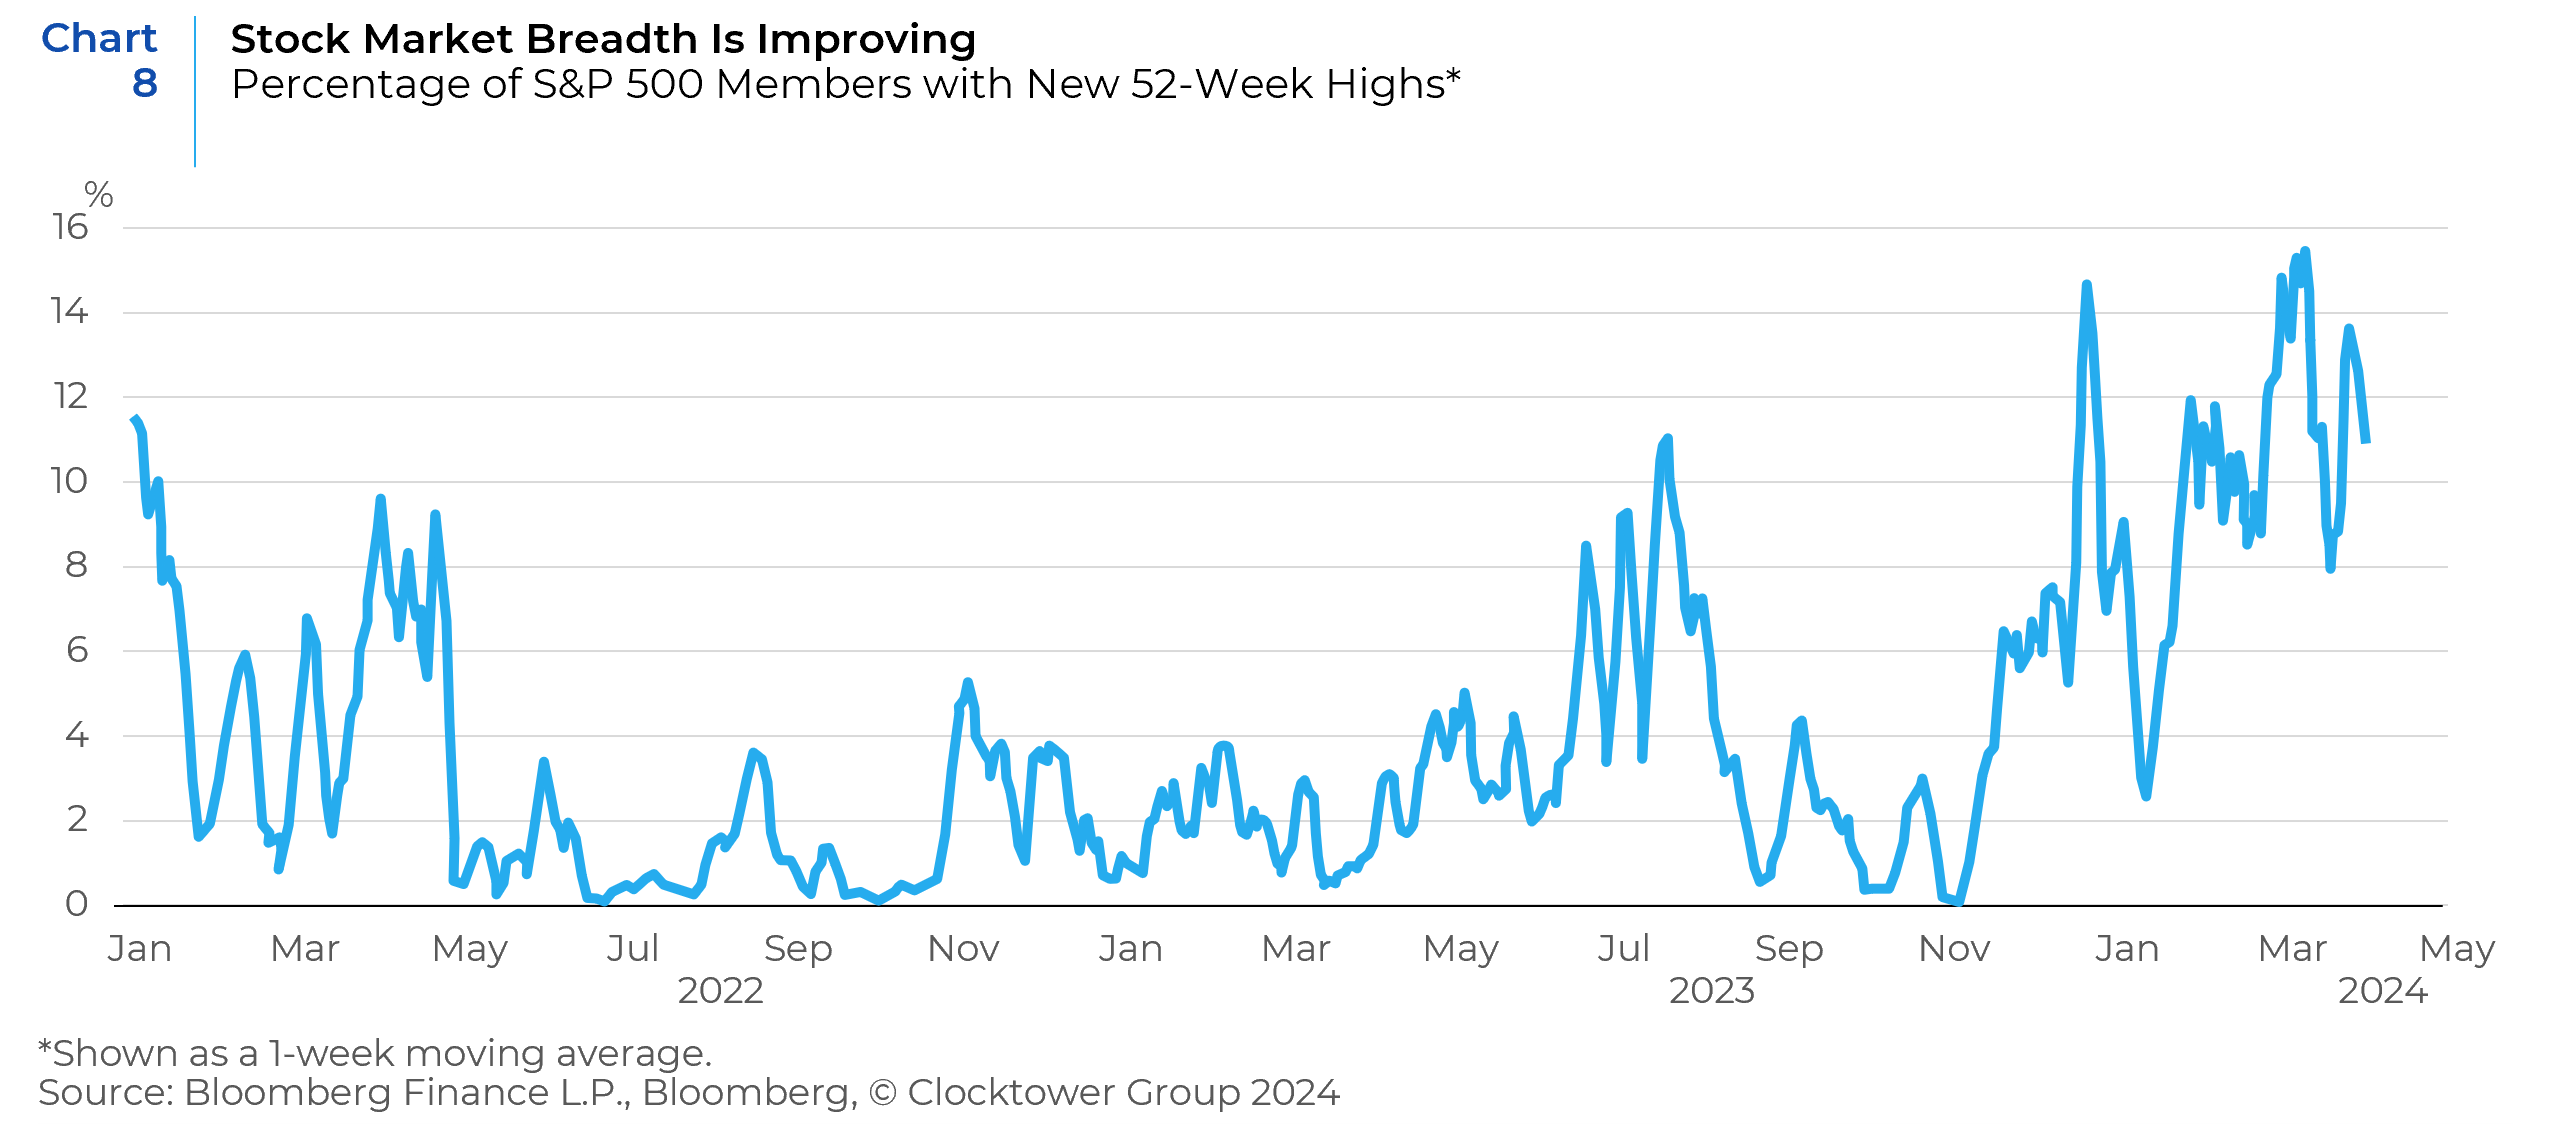
In an environment of resilient growth, equities have delinked from rate expectations. The market is now expecting three to no rate cuts in 2024, down from seven at the beginning of the year, but equities have shrugged it off and signs of increasing breadth in equity markets are emerging (Chart 8).
…And Now the Not So Good News
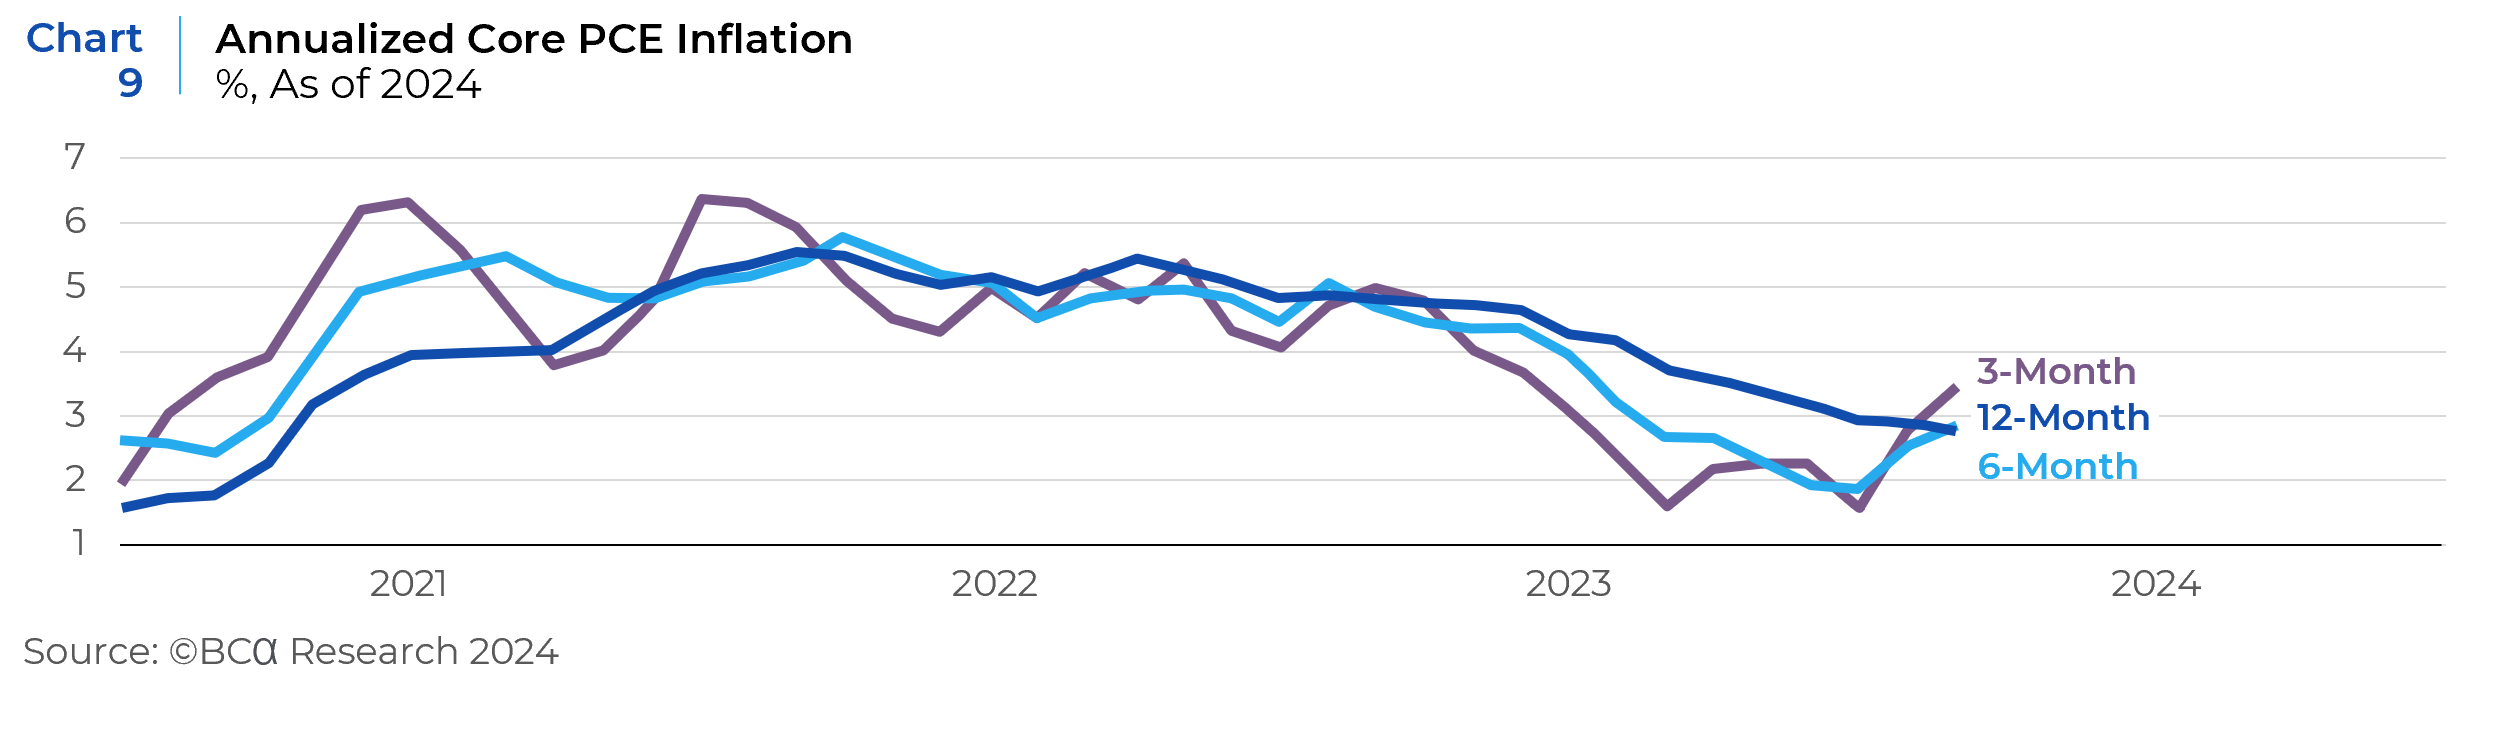
Inflationary pressures remain stubborn. The 3-month rate of change of core PCE (Chart 9) and core CPI (Chart 10) is an early indication that inflation might be reaccelerating. The underlying strength in the US economy, could spark a second wave of inflation, and in turn, prevent the Fed from easing as much as they want to.
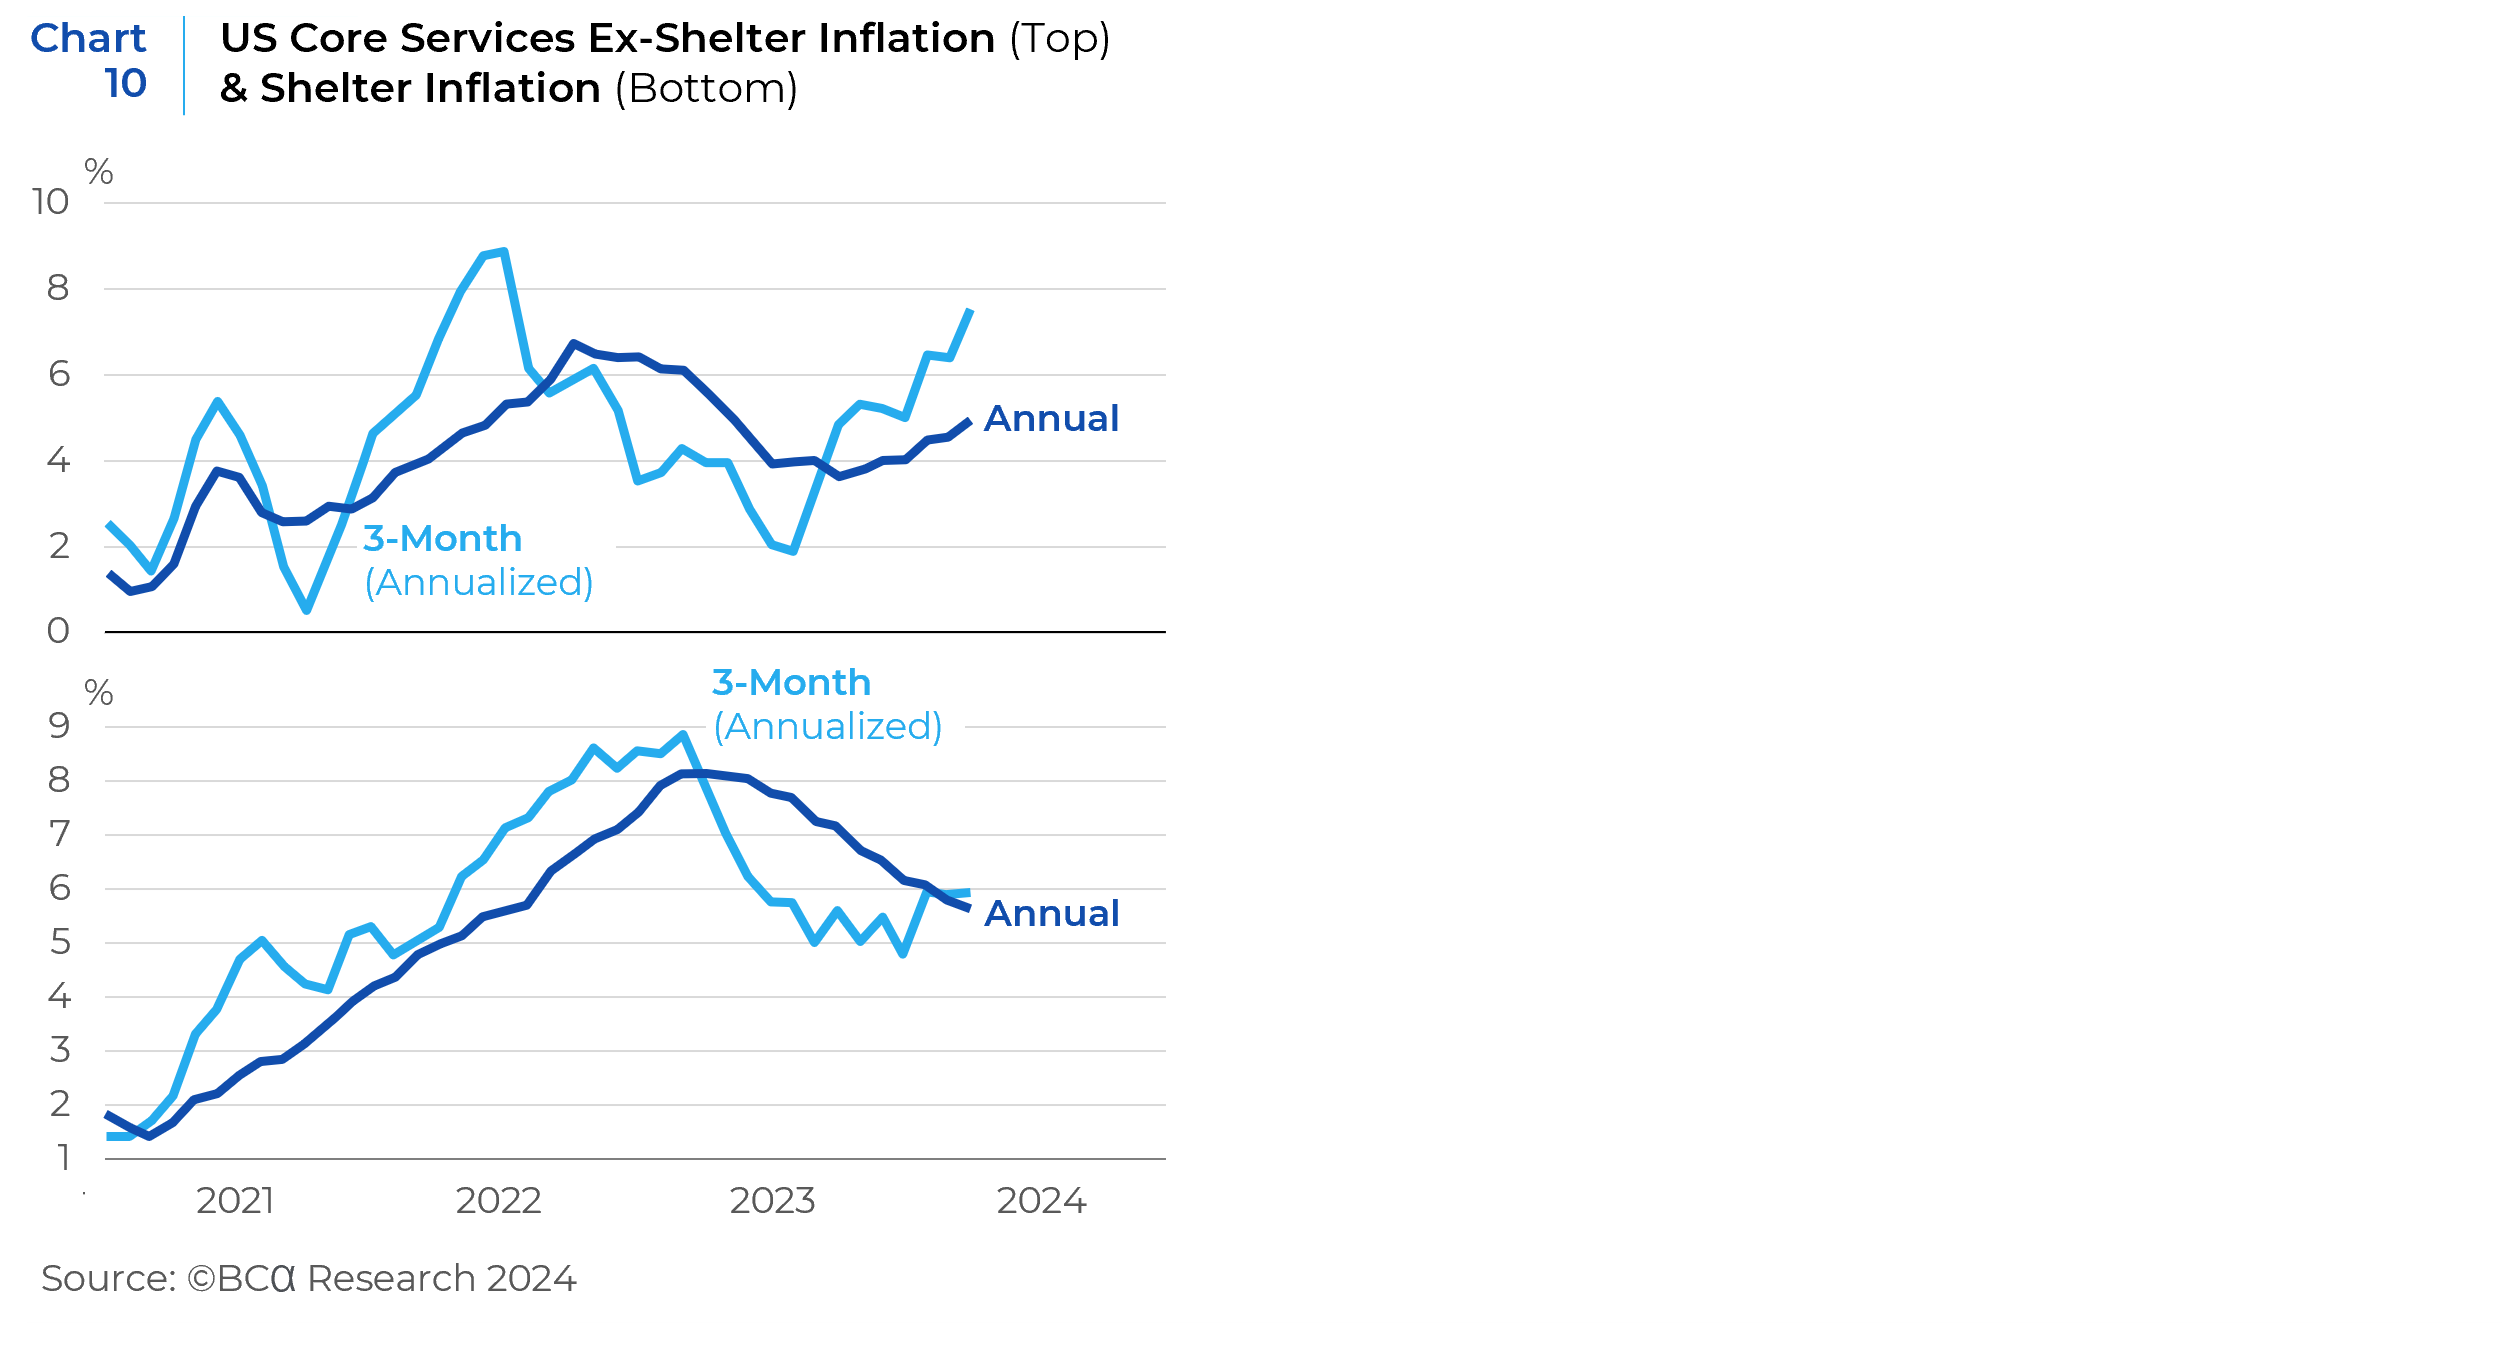
There are two worrying aspects of the CPI data. First, shelter inflation is not receding fast enough and has instead plateaued at 5%, preventing the Core CPI from declining. This remains a key concern. One saving grace is that shelter has a lower weight in the PCE basket, which is the preferred measure of the Fed. Second, core services ex shelter inflation is also rising rapidly. The annual rate of change of this measure ticked up to 5.0% while the 3-month annualized change stands near 7.8%, its highest point since June 2022 (Chart 10). While most of this rise is associated with transportation services, Fed officials have often linked this measure to wage growth and underlying inflation.
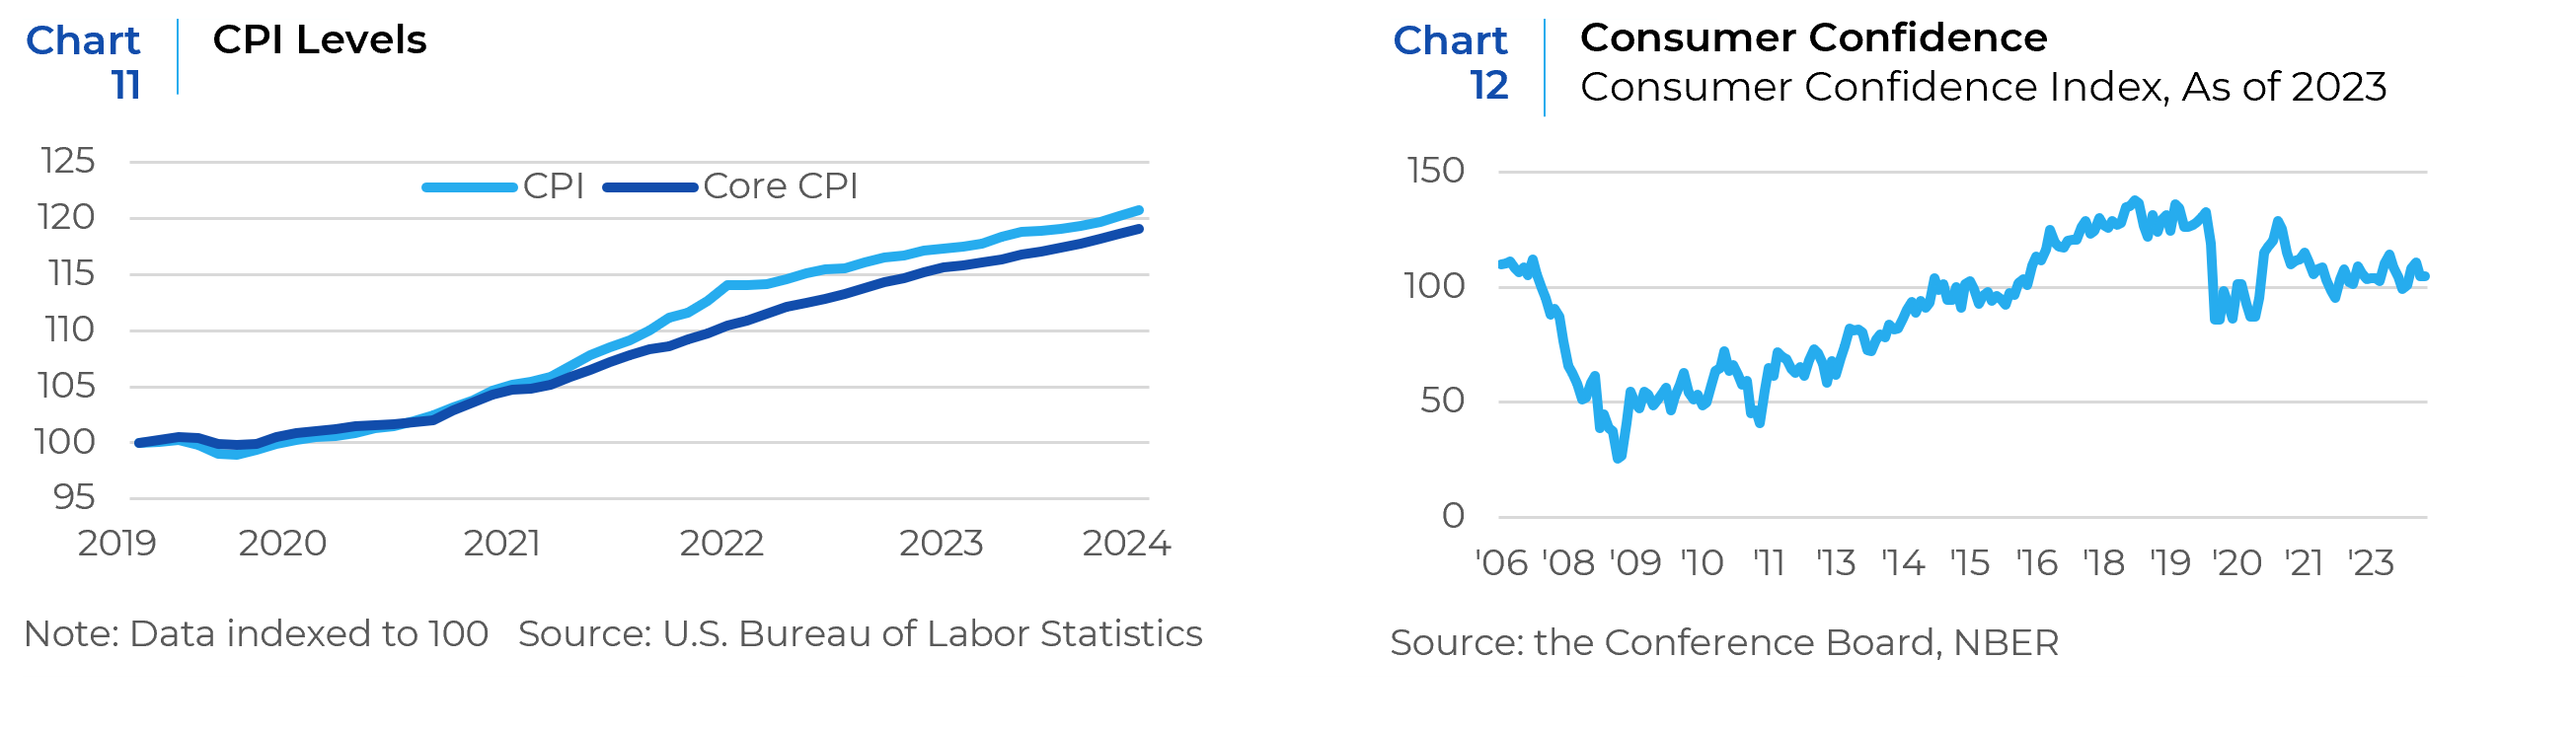
Despite the recent increase, inflation has been notably lower since the CPI reached its highest point in mid-2022. But there’s a catch. Whether it is Fed observers, market analysts, or economists, inflation is measured by how much it changes from month to month or from year to year. Consumers, however, usually think of inflation in terms of where prices are or in other words, the level of inflation. As shown below (Chart 11), headline CPI prices are still about 20% higher than they were before the pandemic started, with core CPI prices close behind. This has a negative effect on consumer confidence (Chart 12).
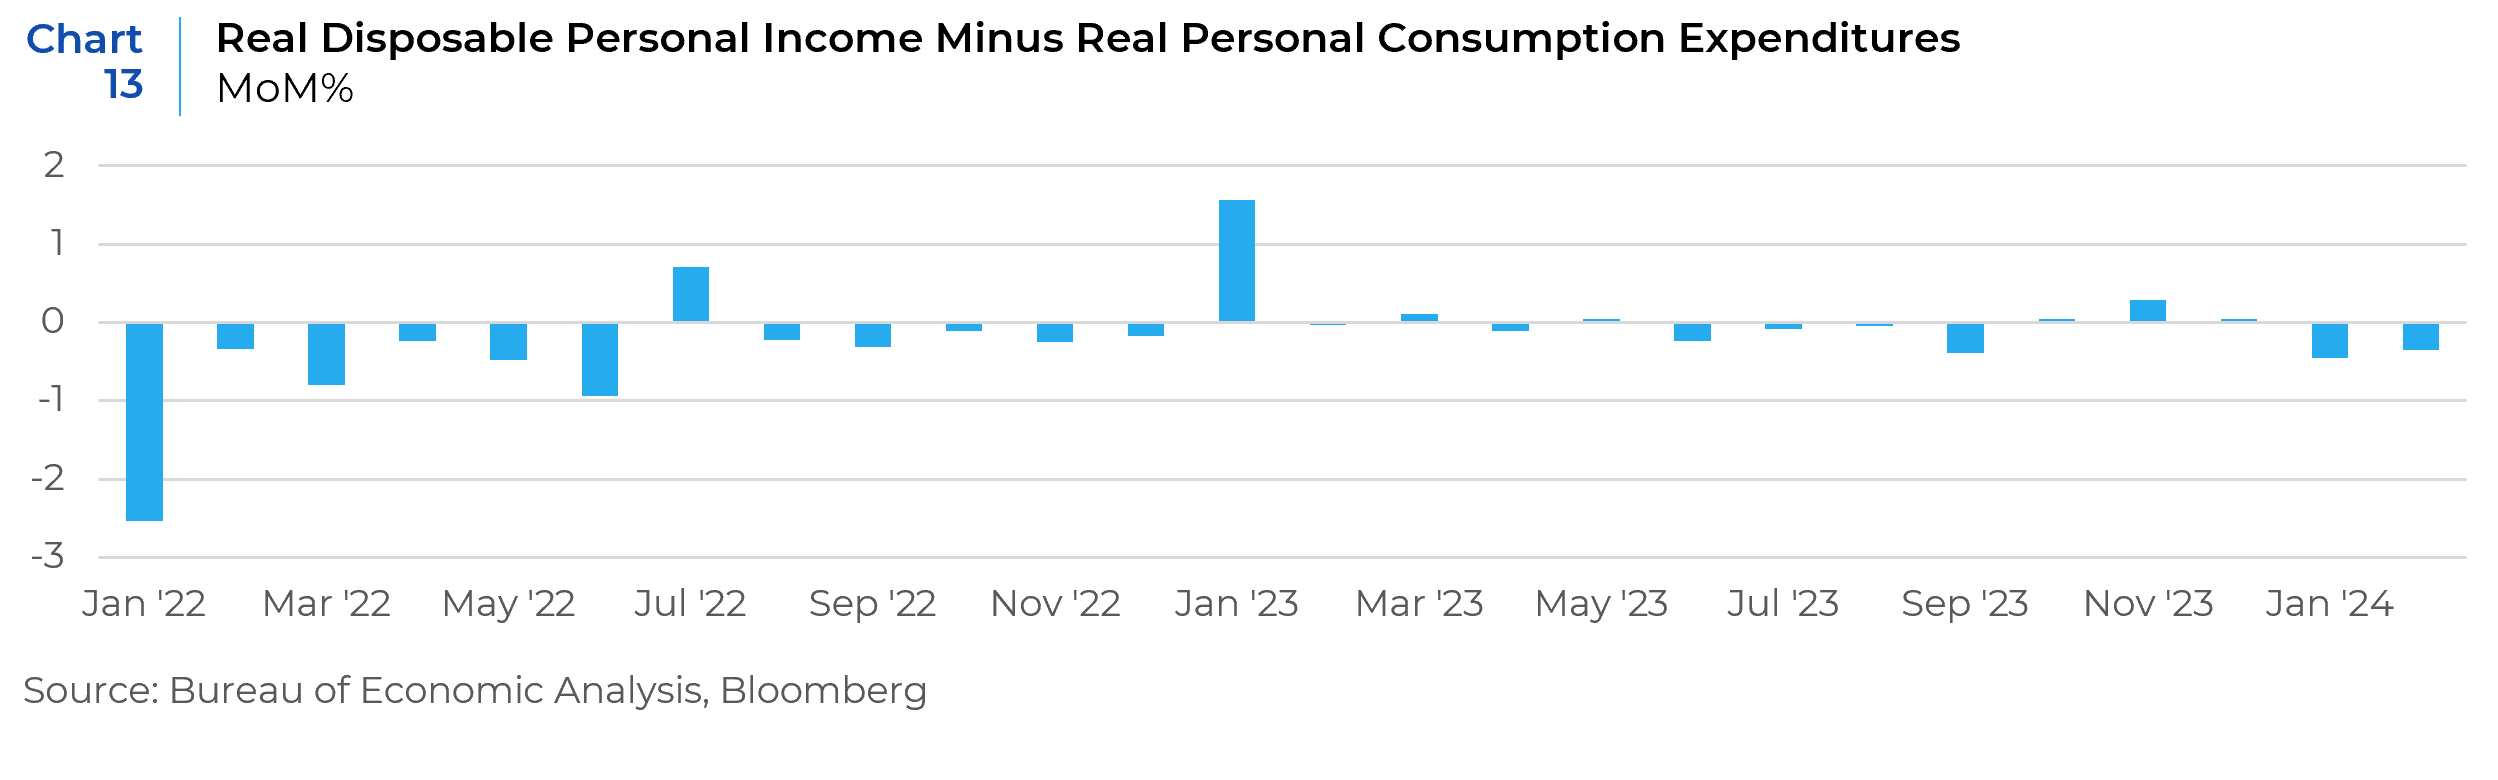
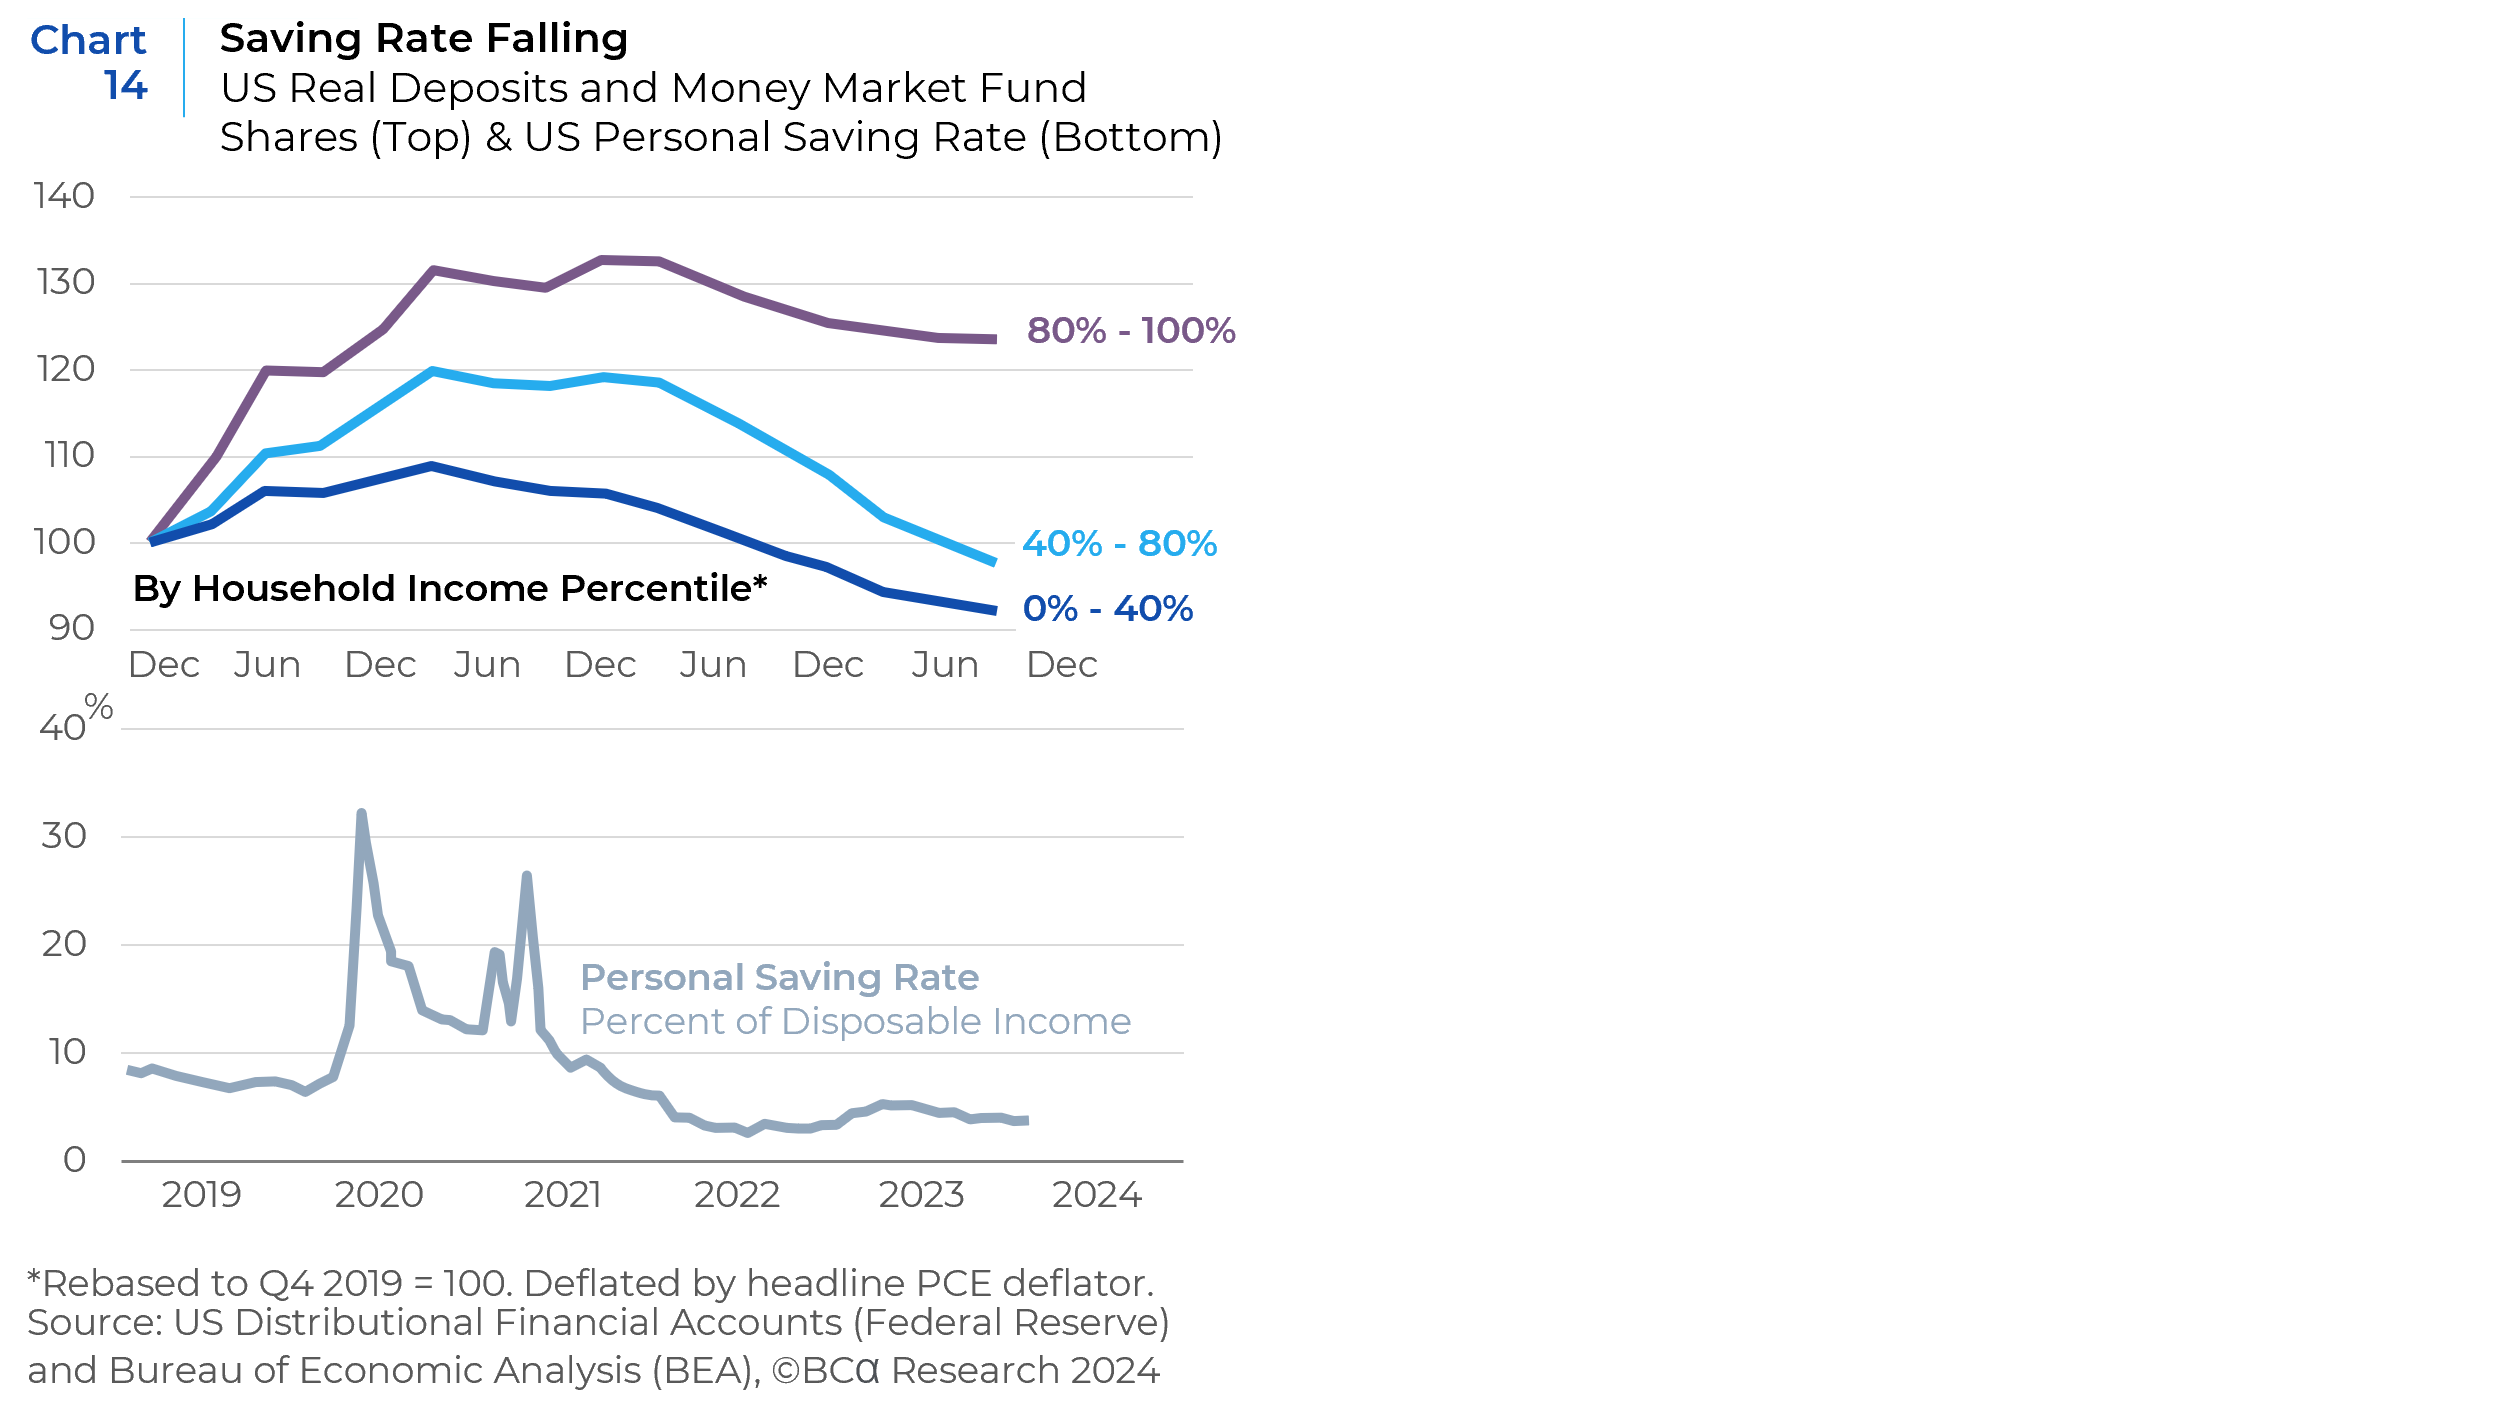
Consumer spending is already showing signs of strain (Chart 13), which shows that real spending has been outpacing real disposable personal income growth for most of the past year. This decline in income growth relative to spending means consumers are dipping further into their savings to fuel their purchases. That has also pulled down personal savings rates over the last few months (Chart 14).
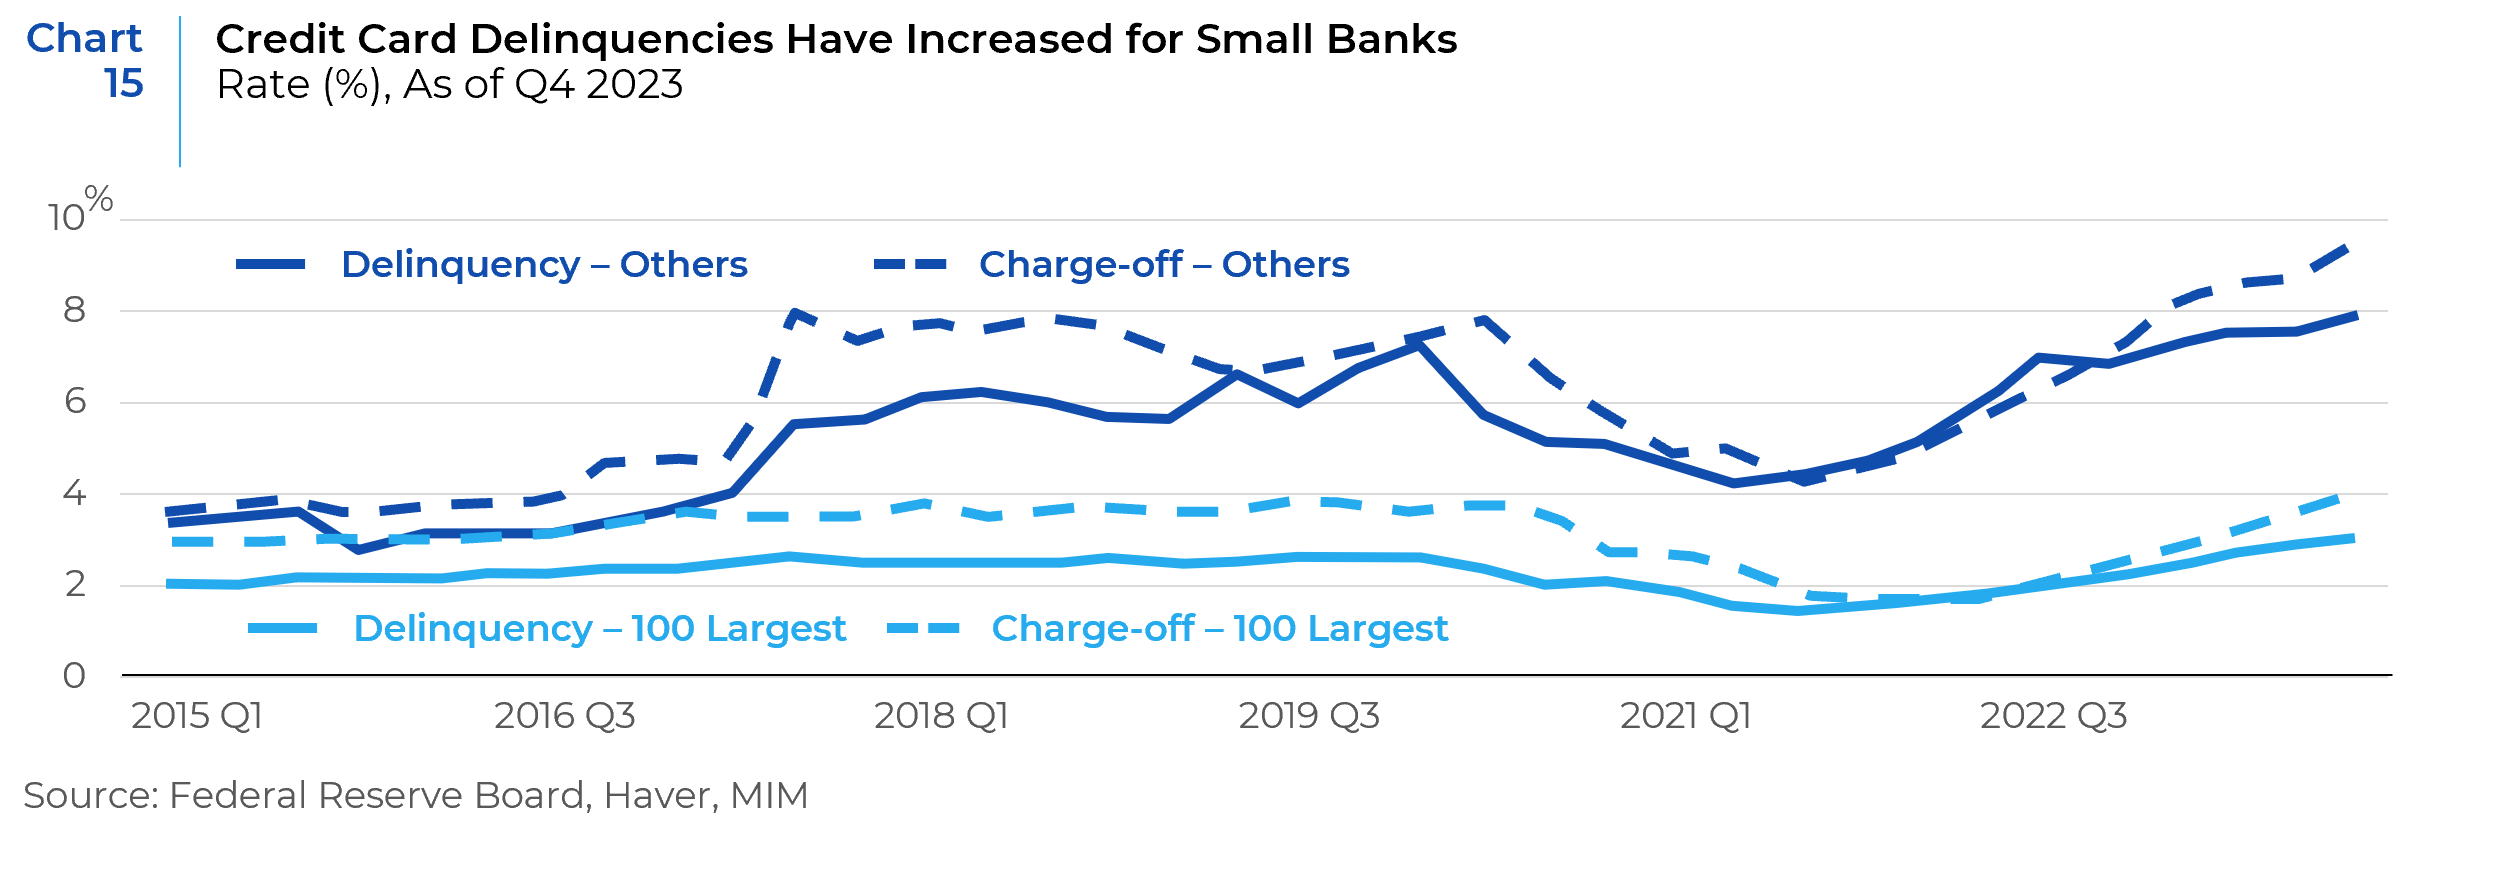
Many consumers are struggling to pay back their debt. Recent data from the Federal Reserve Board of Governors shows that the rate of consumer credit card loans that have been written off as uncollectible has reached 4.2%, the highest since 2012. Smaller banks face a significantly higher impact, as the credit card delinquency rate for banks other than the largest 100 has reached 7.8% and their charge-off rate reached 9.5%, both surpassing even the peaks seen in the 2008 financial crisis (Chart 15). Even as consumers keep spending, the finances for some consumers, especially those that are younger and/or lower income who rely more on credit, are strained by higher prices, higher rates, and the highest credit card interest margins in history.
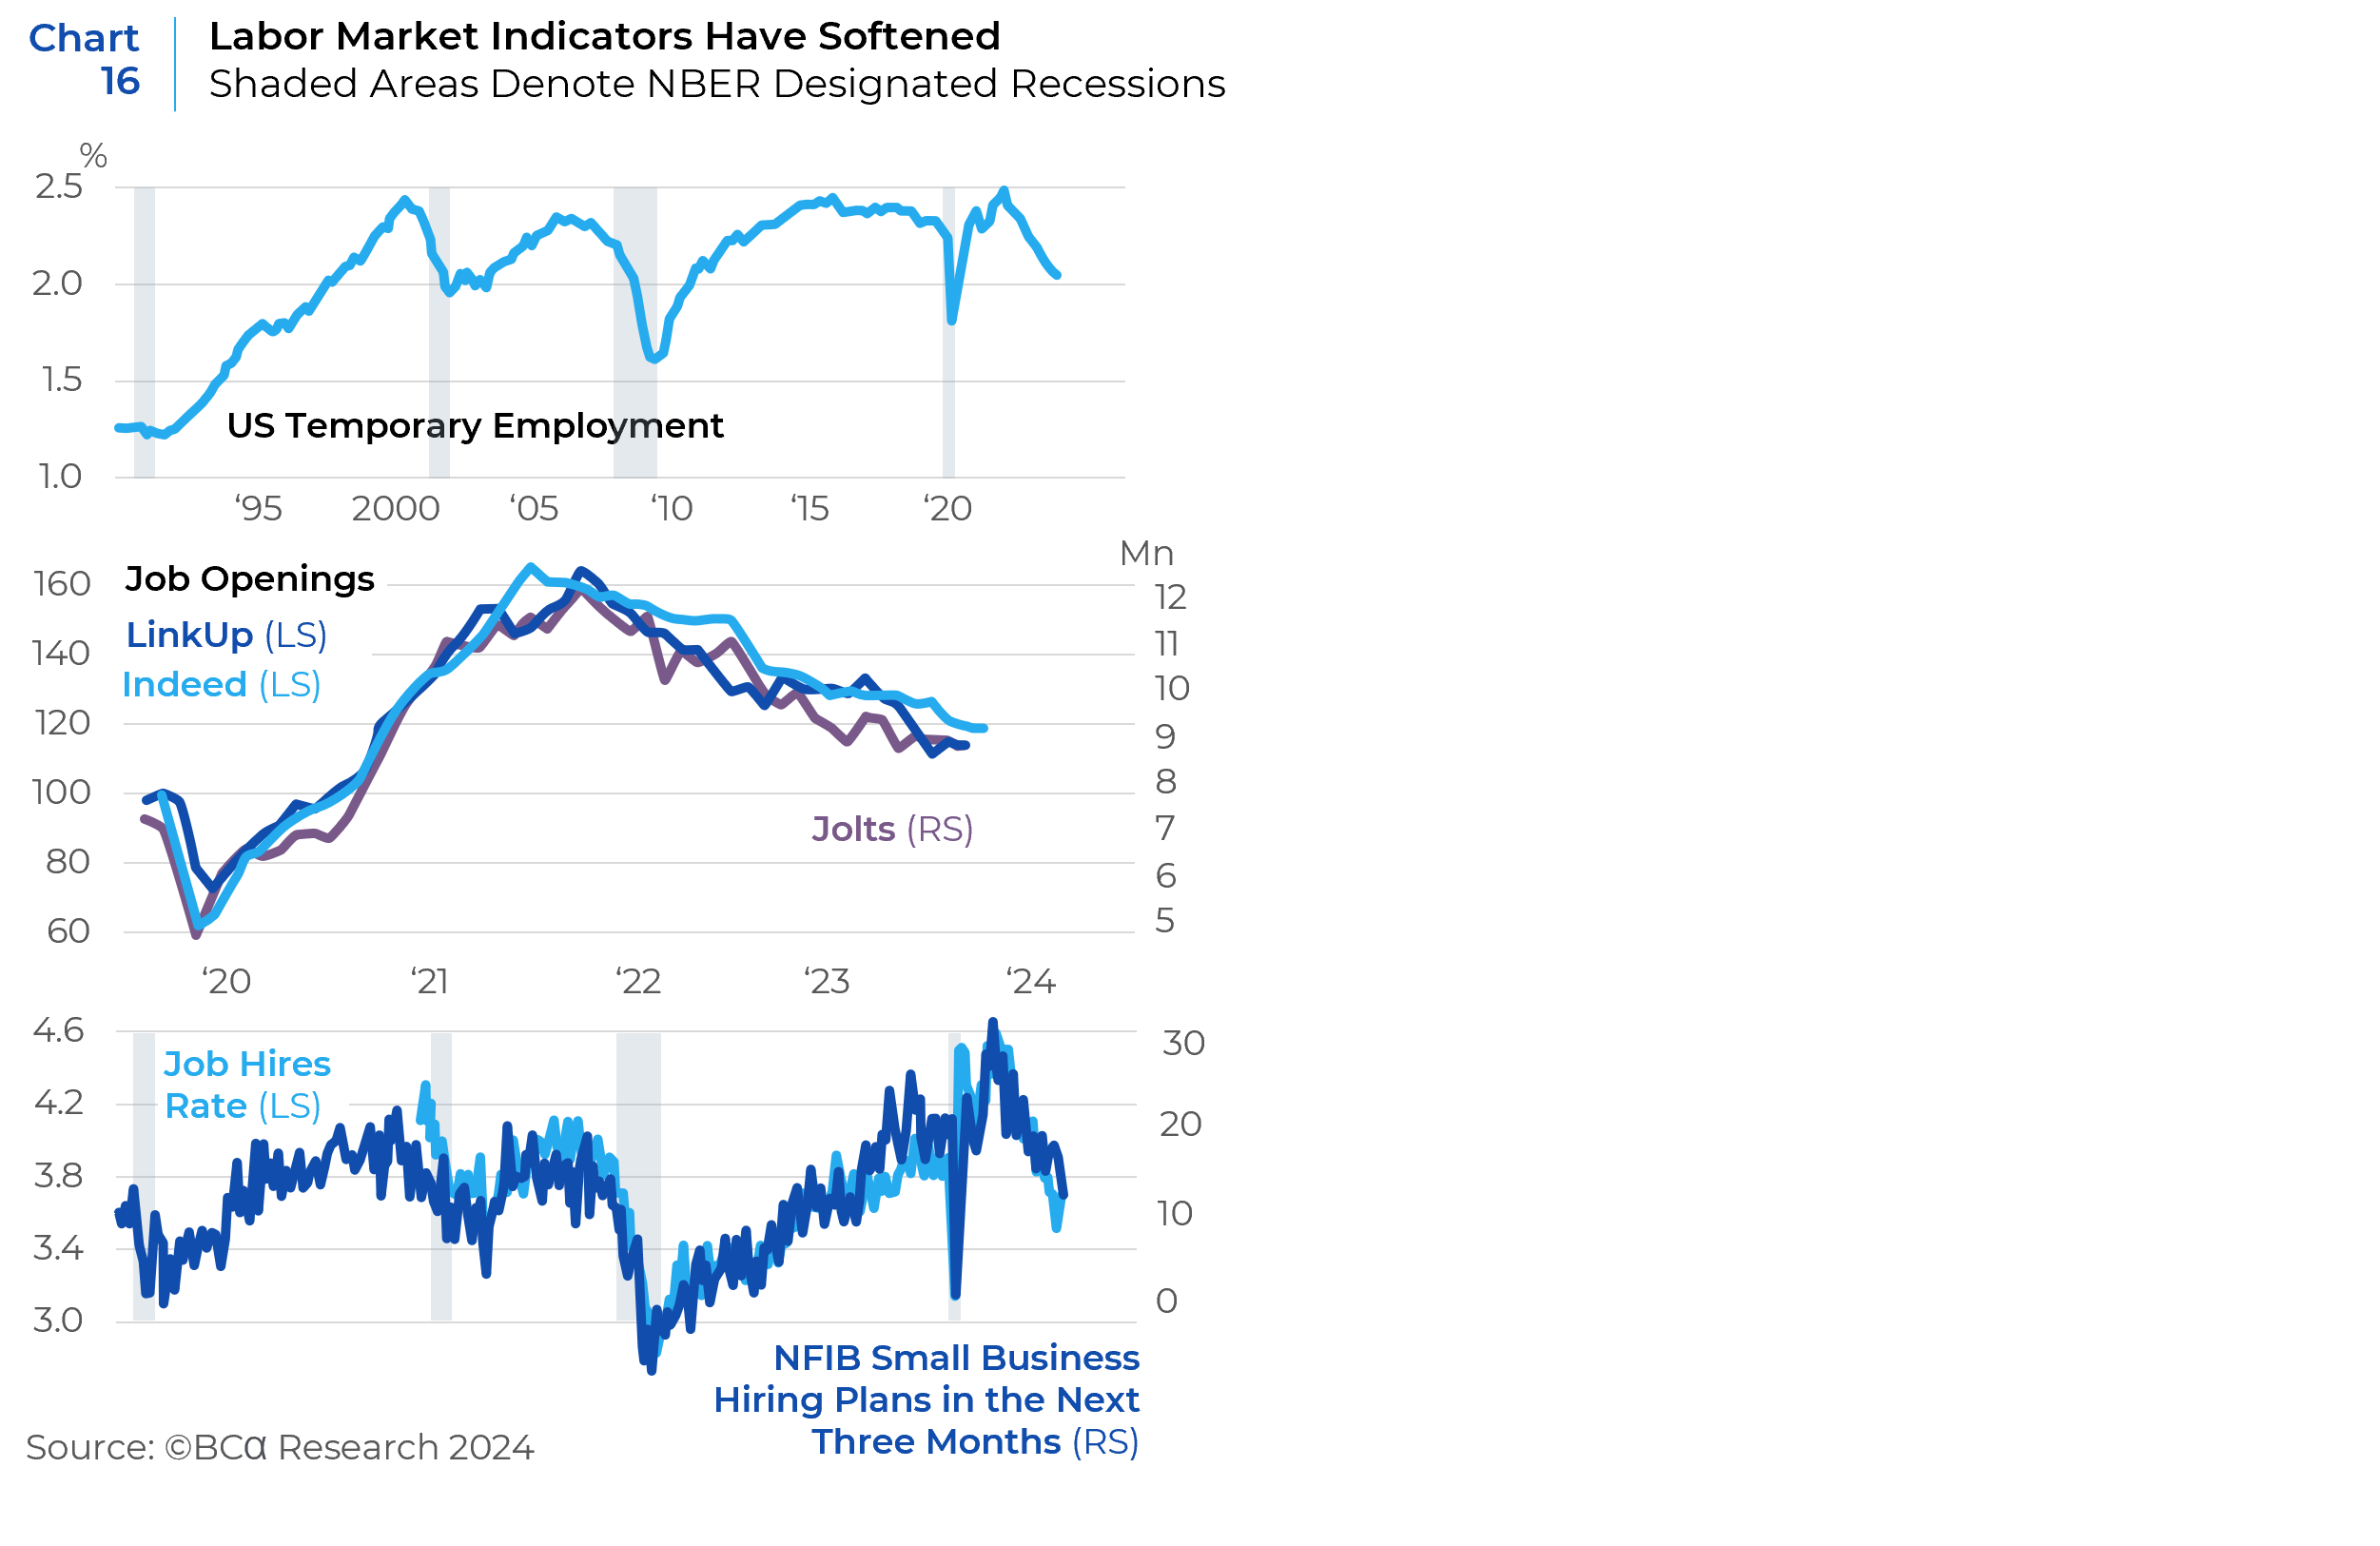
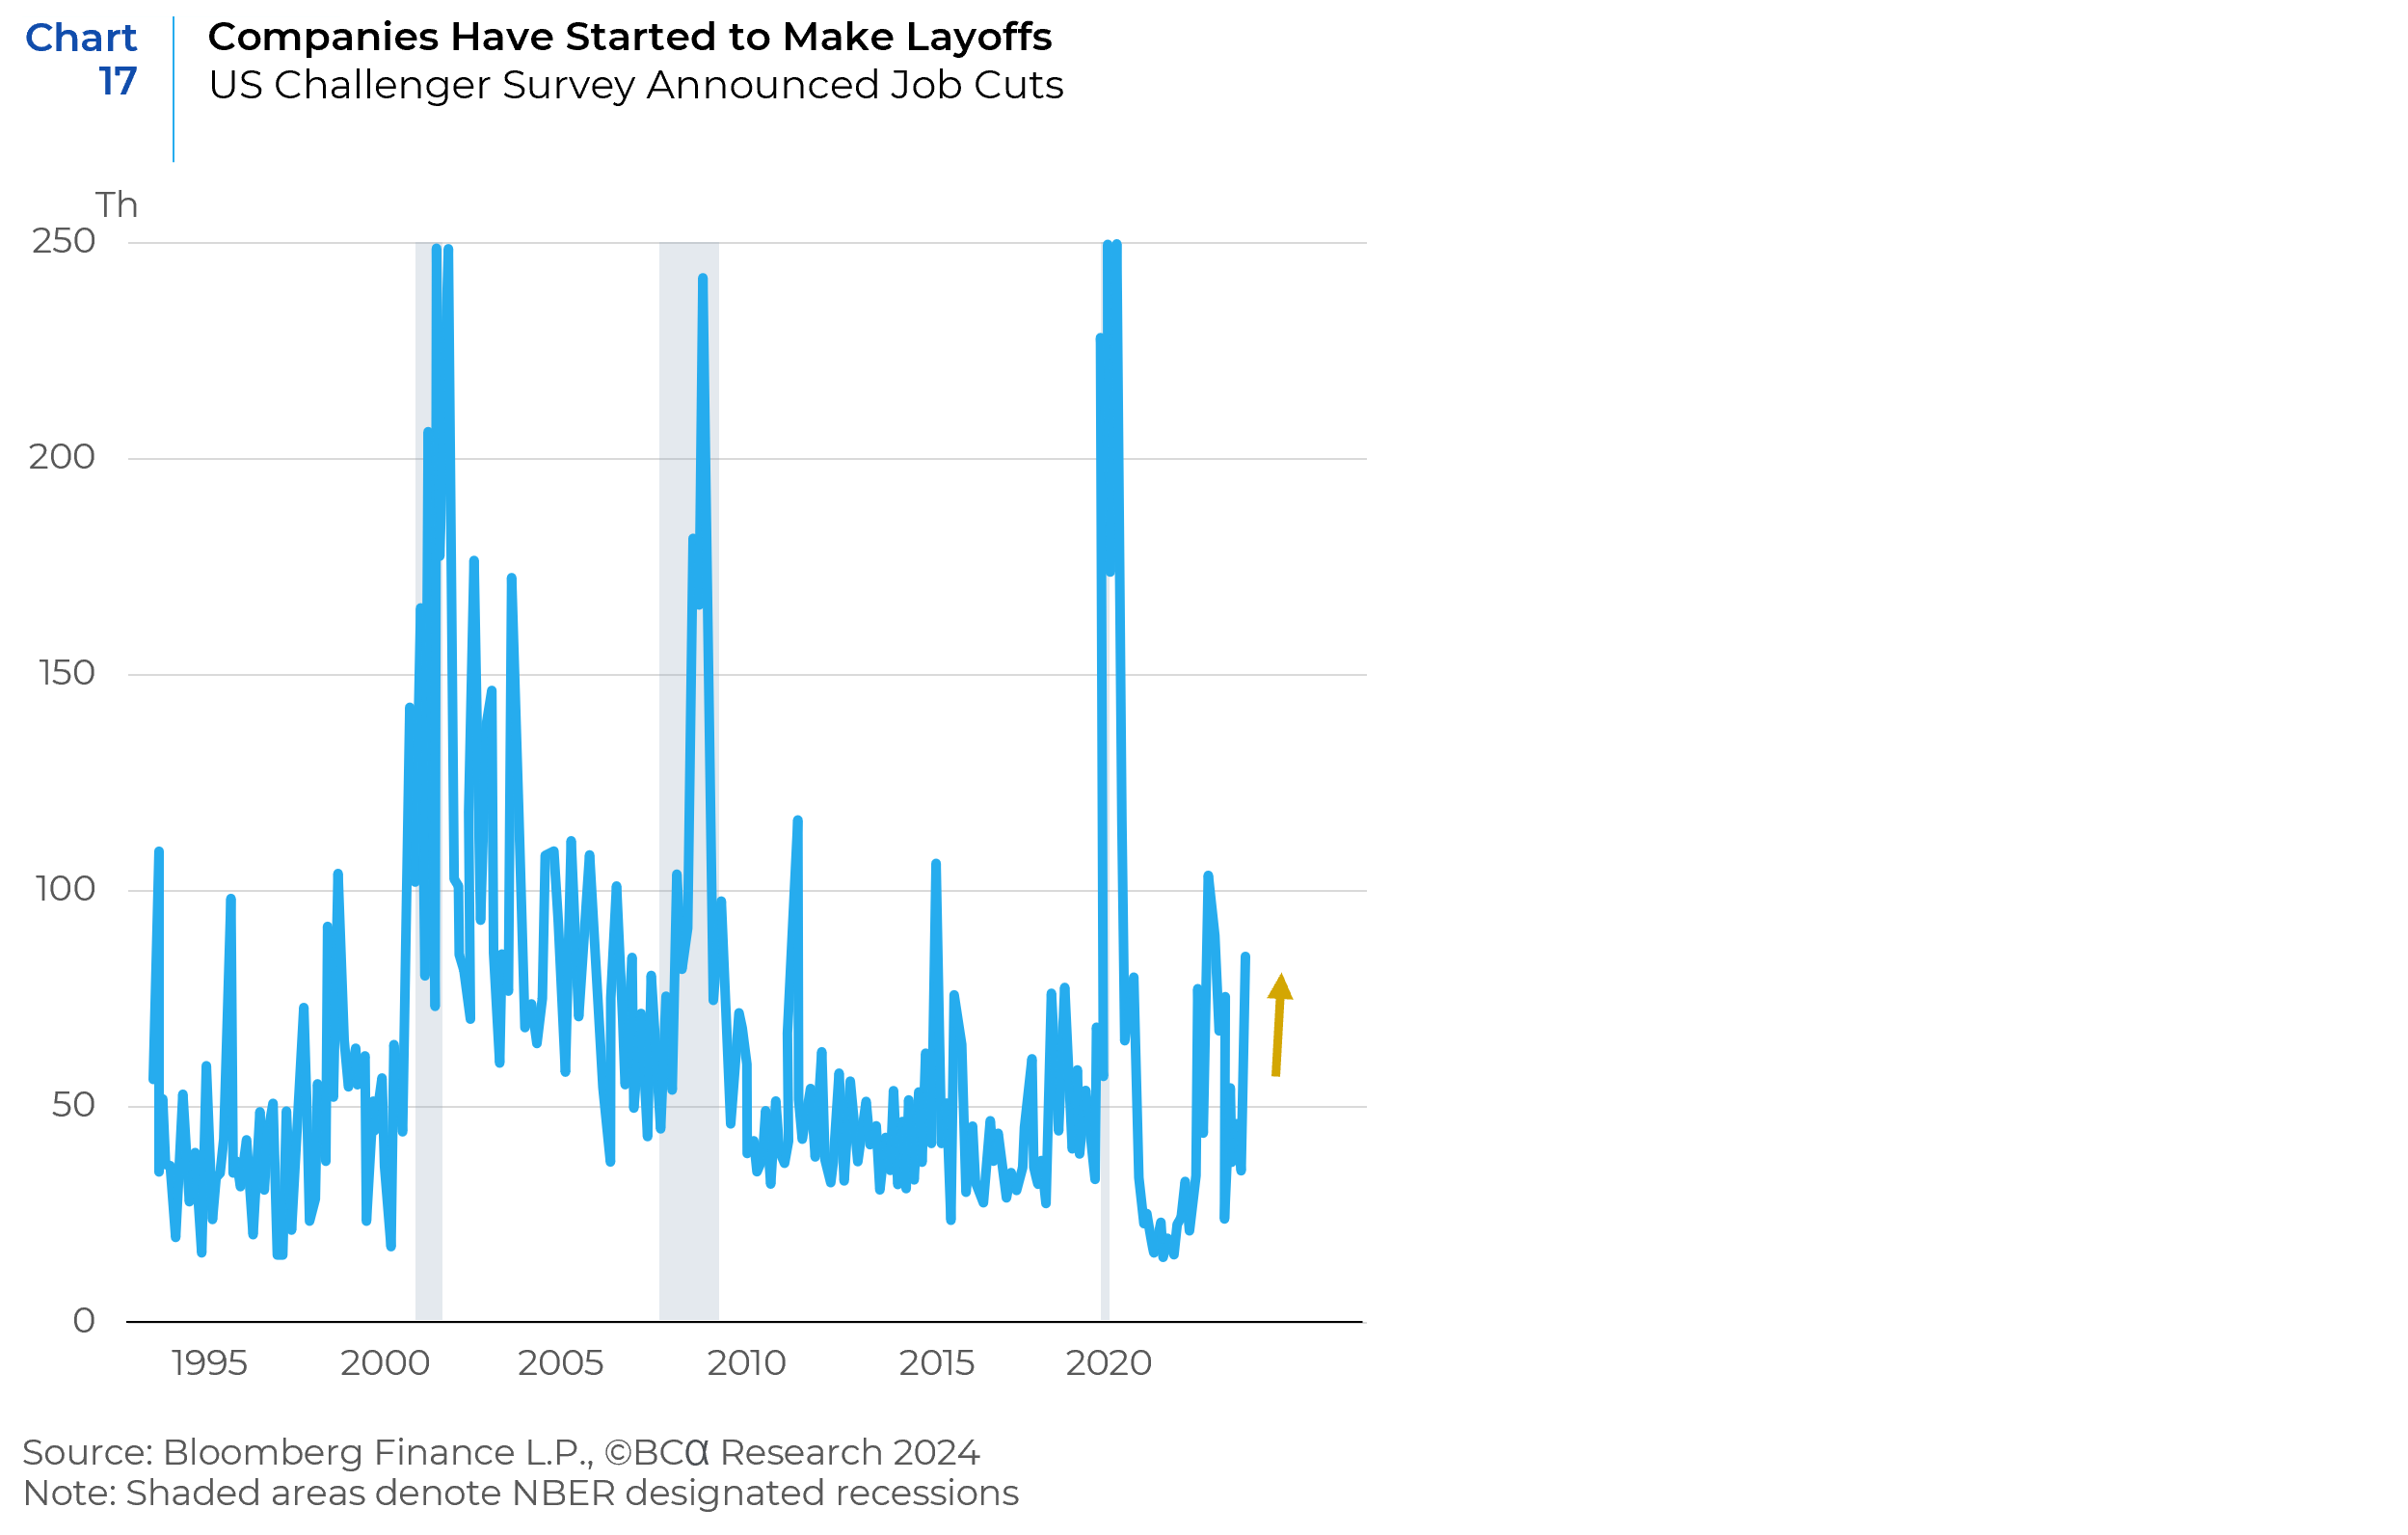
Although aggregate economic and labor market indicators continue to be strong and payroll growth has held up well, there have been declines in temporary employment, lower job openings, decreased hiring intentions (Chart 16), and increased layoff announcements (Chart 17).
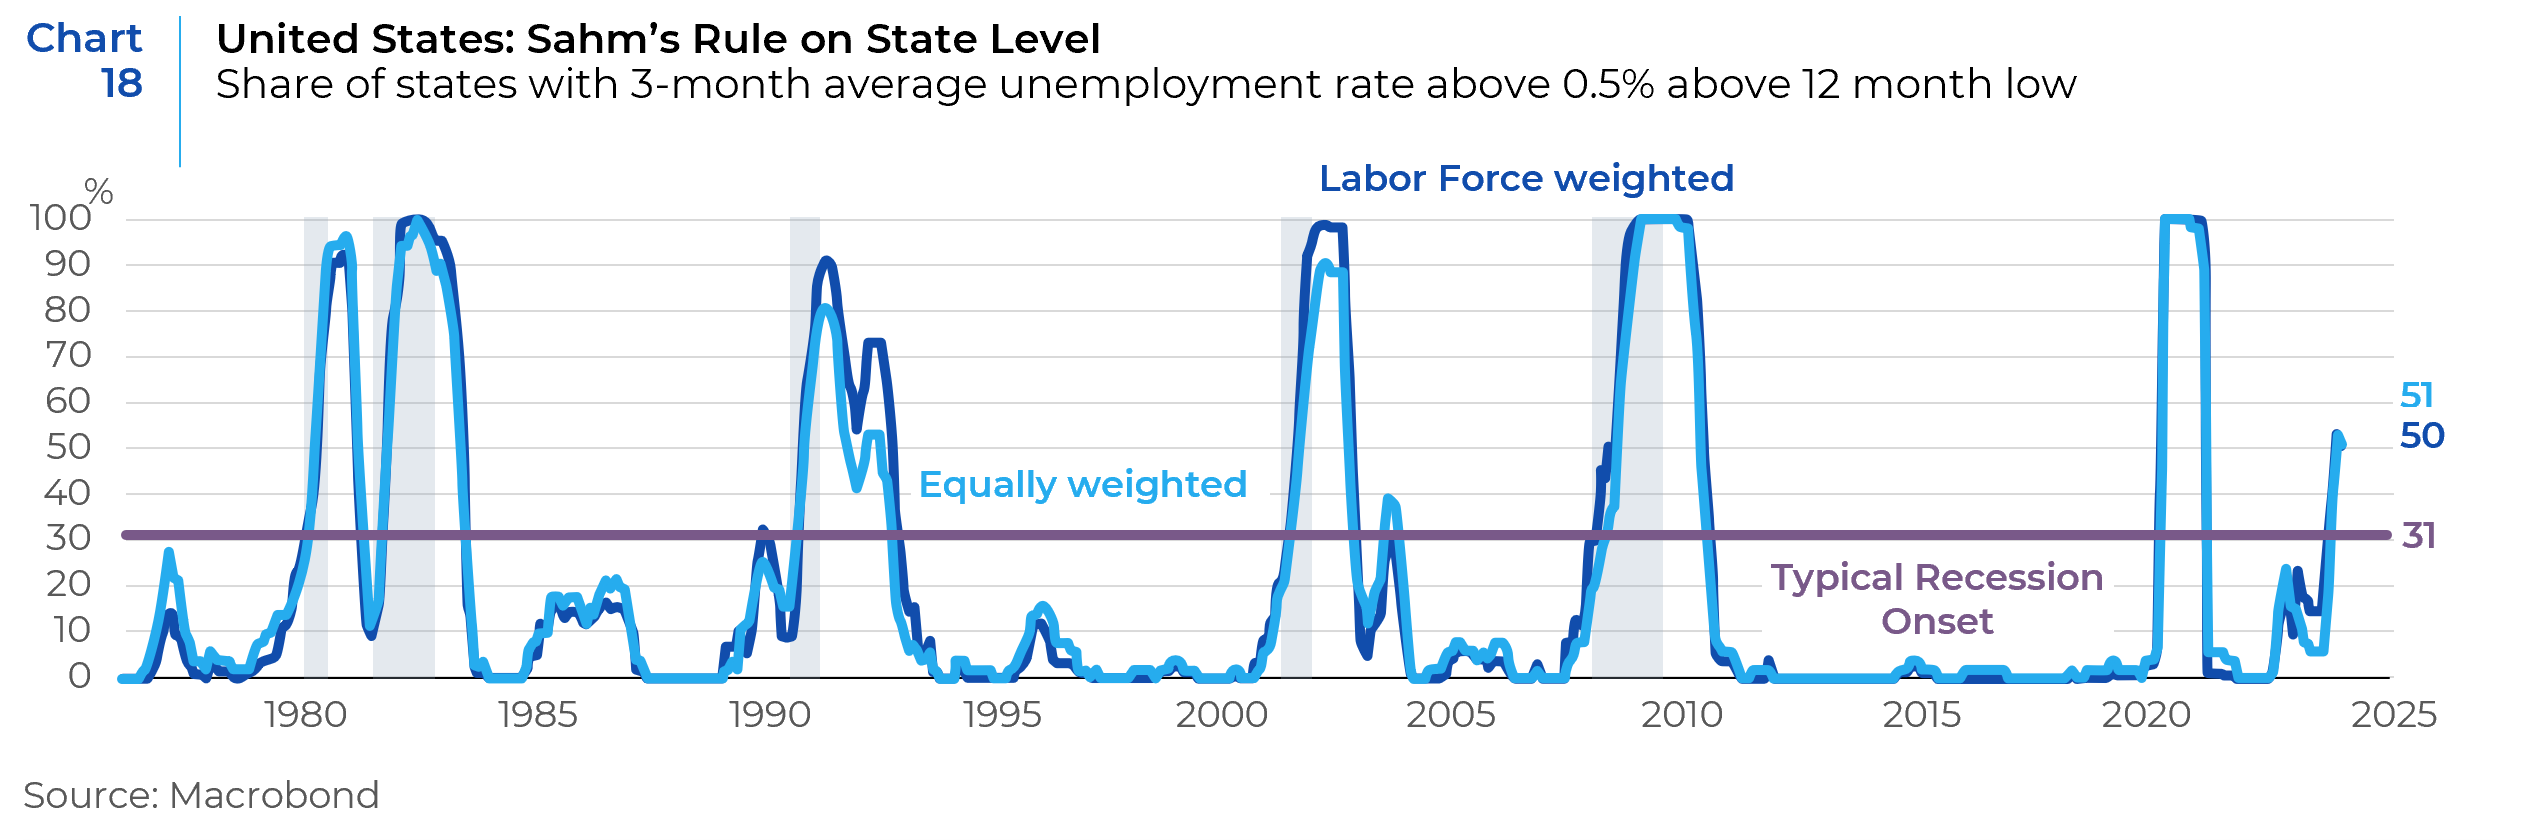
The Sahm rule, which looks at the three-month average of the US unemployment rate, indicates the likelihood of a future recession. The rule signals the start of a recession when the three-month average of the unemployment rate goes up by 0.5 percentage points or more compared to its low in the previous 12 months. The share of states that trigger the Sahm rule is now over 50 percent, much higher than the historical standard of 31 percent linked to recessions. The high number of layoffs in sectors like technology, finance and services heightens worries about an economic slowdown, reflecting sector-specific risks (Chart 18).
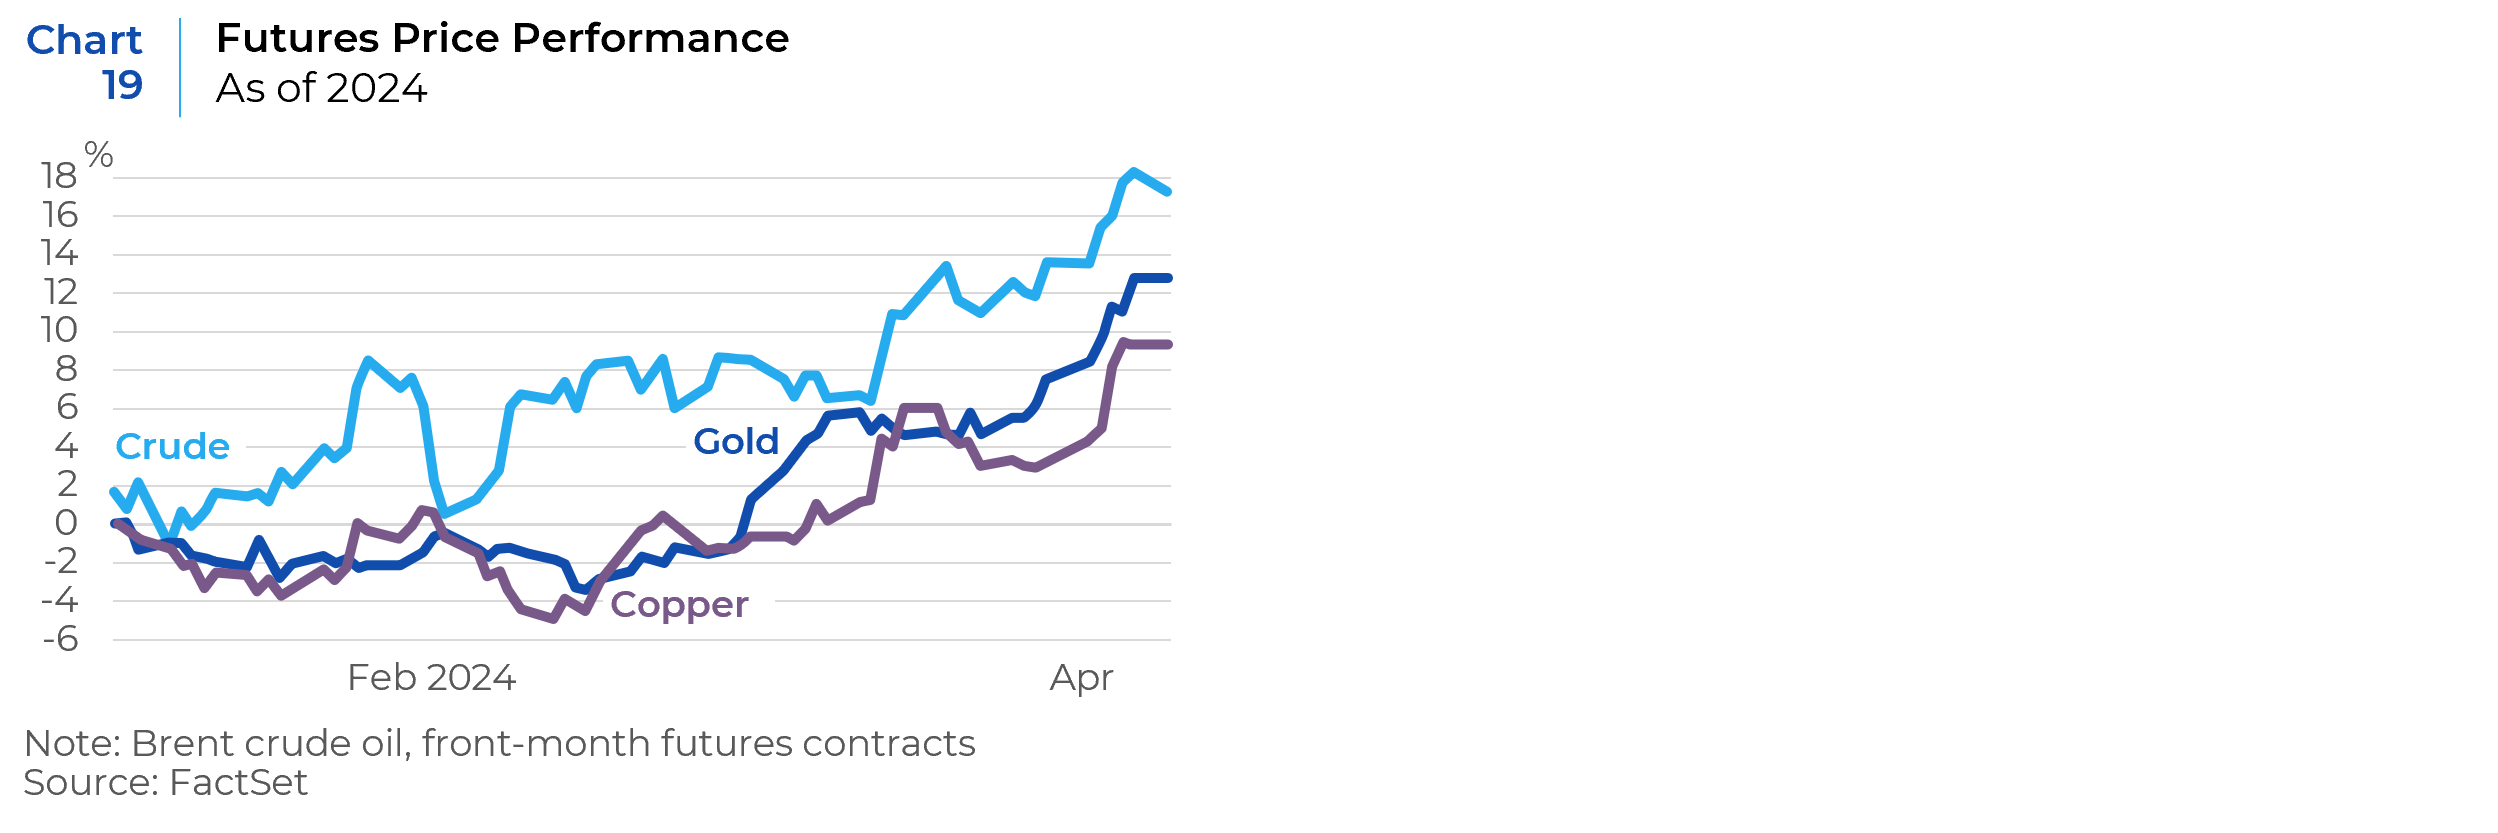
Commodities are making headlines with the prices of crude oil, copper, and gold all making sizeable gains since mid-February (Chart 19). Increased geopolitical risks amid concern of a broader conflict in the Middle East, Ukrainian drone strikes, voluntary production cuts by the OPEC+ coalition limiting the global supply of crude oil, and the closure of copper mines in Panama have all contributed to the rise in prices of these commodities. In addition to these idiosyncratic forces, a common driver of the commodity rally is optimism towards the global economy. While that is a positive sentiment, the implications of rising commodity prices may pose a problem for the Fed as it struggles to control inflation.
What Lies Ahead?
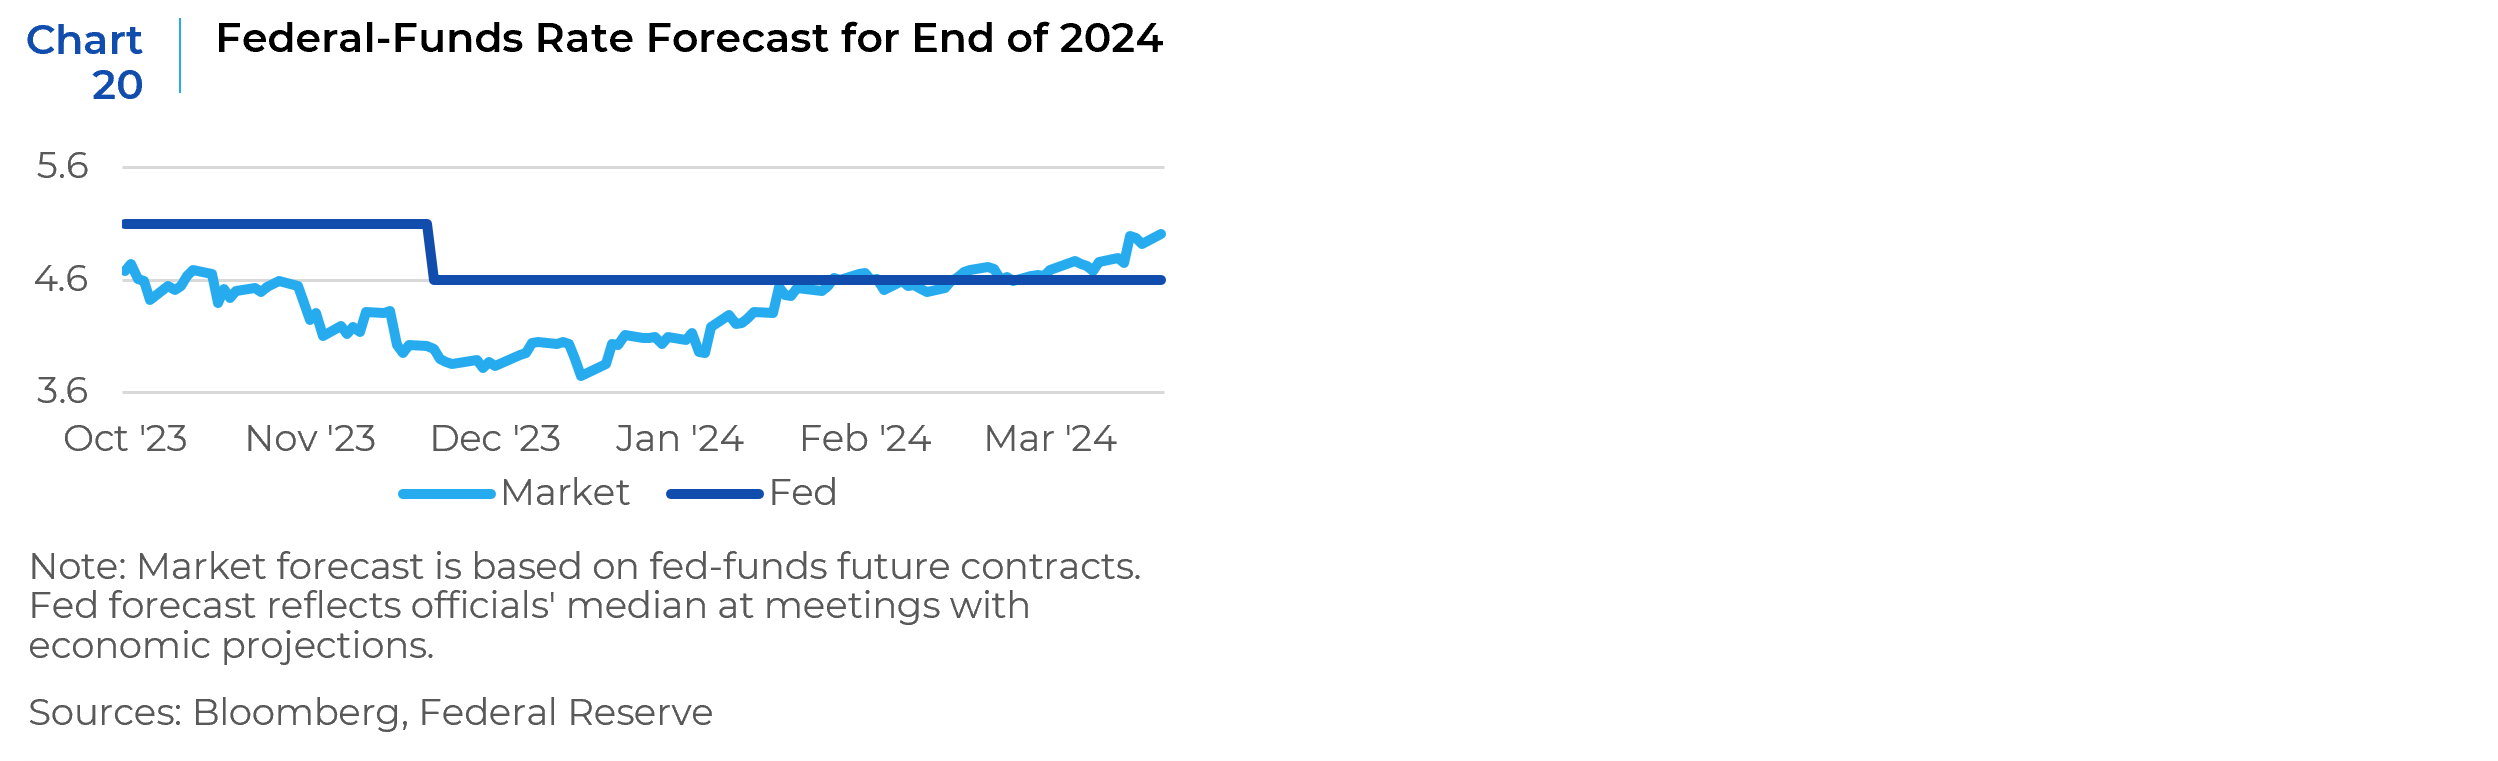
Market participants began the year betting on six or seven rate cuts in 2024. As the economy has proved stronger than expected and inflation has remained stubbornly sticky, investors have slowly walked back those bets. Futures tied to the fed-funds rate show the benchmark rate finishing the year around 5%, (Chart 20), above Fed officials’4.6% forecast from March. Those contracts had showed rates ending 2024 below 4% just a few months ago. These changes reflect concerns about the underlying strength in the US economy that could spark a second wave of inflation, and in turn, prevent the Fed from easing as much as they want to.
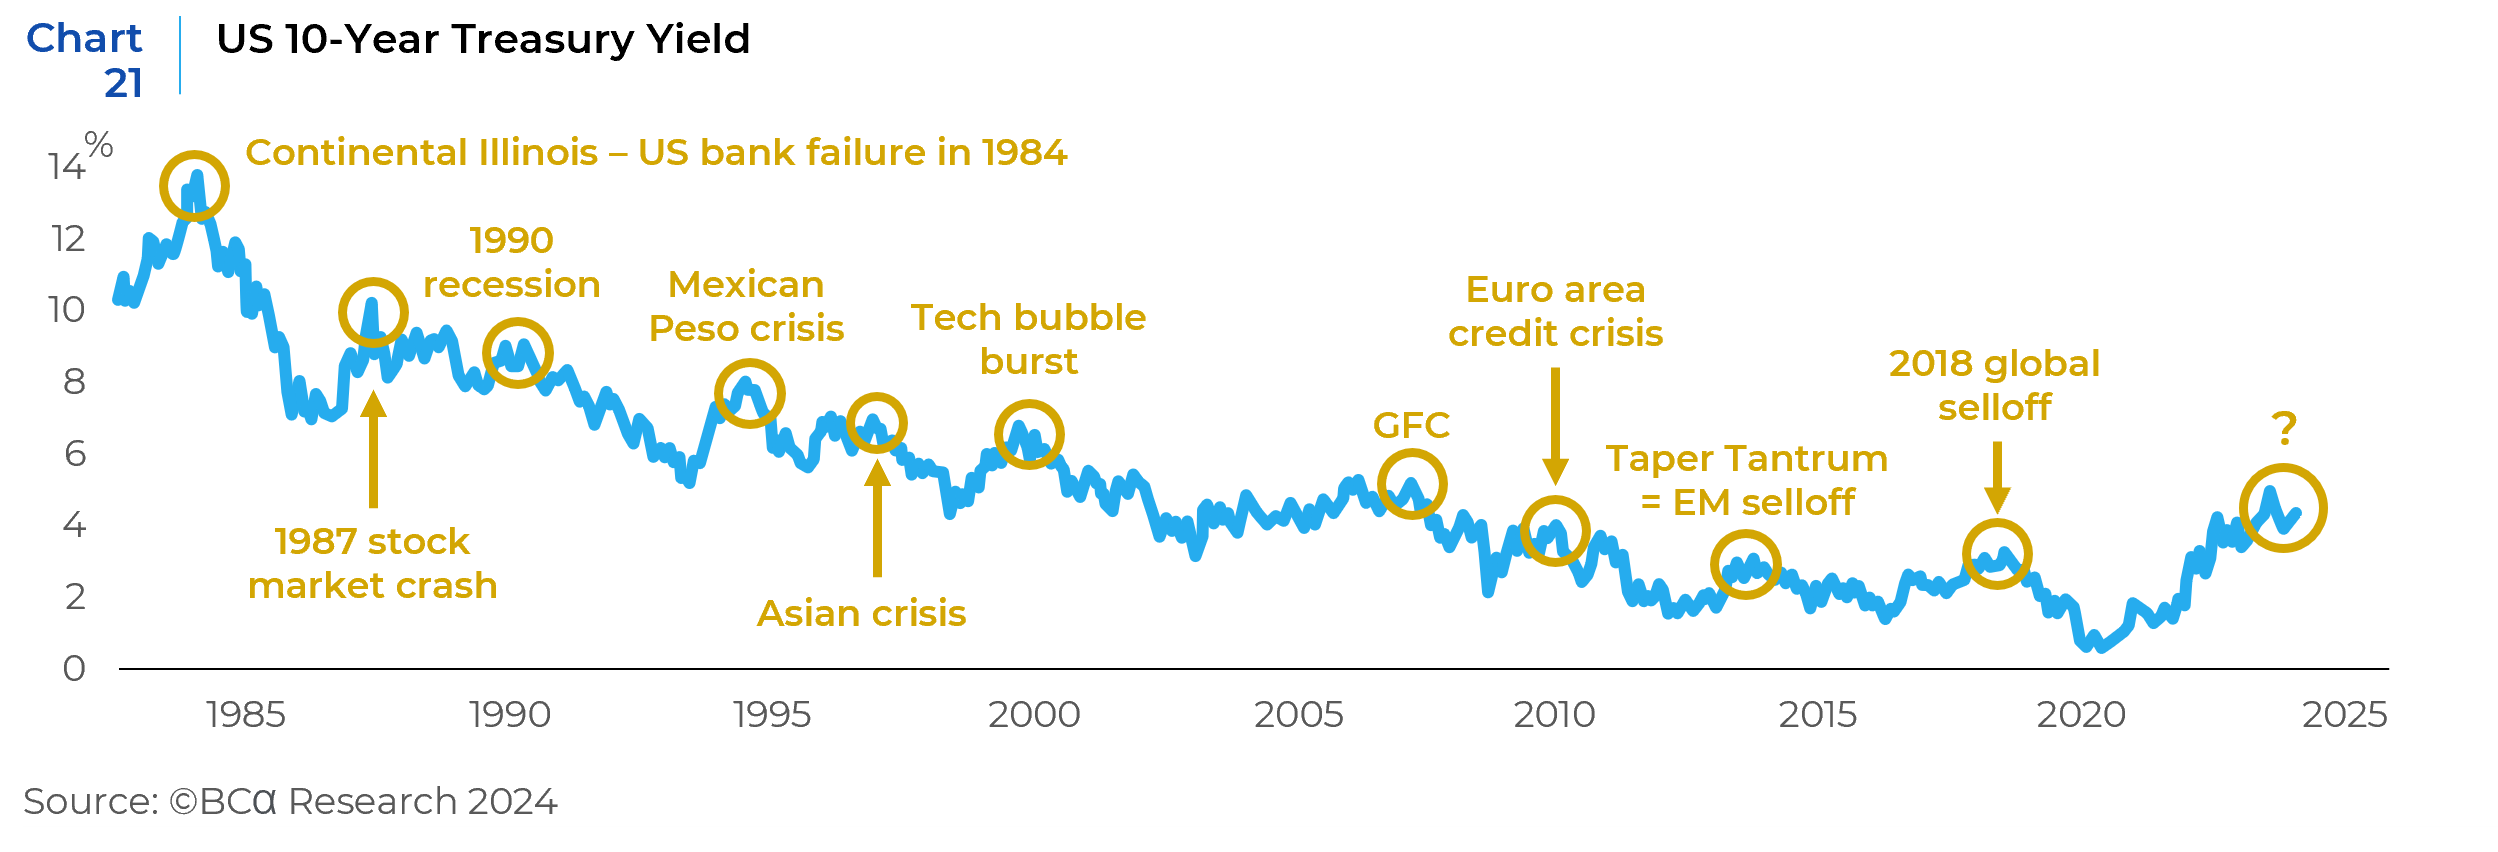
Rising US bond yields usually lead to financial turmoil. In the past, when US 10-year bond yields reached peak levels, something usually broke. Even during the long-term fall in US bond yields from 1982 to 2021, short-term increases in yields stopped only after a burst of financial turmoil (Chart 21). It would be odd if this current bond yield rise (the biggest bond market decline ever) ended without any damage to the global financial system. The point is that a drop in global risk assets is very likely before US Treasury yields start a sustainable decline.
While the possibility of another wave of inflation exists, the risk of recession is higher. The Fed will start to lower rates before inflation falls to their 2% target, but it will most probably adopt a slow pace of rate cuts. Corporate profits and equities may keep growing in the short term, but the factors that support consumption are under pressure as extra savings from the pandemic shrink, lending standards for consumer loans get tighter, and a further weakening of labor markets cause wage growth to slow down. Under these circumstances, a mild to moderate slowdown or recession towards the end of the year or in early 2025 appears to be likely. Some of the risks that could make things worse are a sudden increase in inflation and a Fed shift back to raising rates, or a stagflationary situation with sticky inflation and slower growth. On the other hand, steady growth that is above average but not inflationary could result in a more benign economic environment.
References: Bloomberg, FactSet, BCA Research, Clocktower Research, wsj.com
This report is neither an offer to sell nor a solicitation to invest in any product offered by Xponance® and should not be considered as investment advice. This report was prepared for clients and prospective clients of Xponance® and is intended to be used solely by such clients and prospective clients for educational and illustrative purposes. The information contained herein is proprietary to Xponance® and may not be duplicated or used for any purpose other than the educational purpose for which it has been provided. Any unauthorized use, duplication or disclosure of this report is strictly prohibited.
This report is based on information believed to be correct but is subject to revision. Although the information provided herein has been obtained from sources which Xponance® believes to be reliable, Xponance® does not guarantee its accuracy, and such information may be incomplete or condensed. Additional information is available from Xponance® upon request. All performance and other projections are historical and do not guarantee future performance. No assurance can be given that any particular investment objective or strategy will be achieved at a given time and actual investment results may vary over any given time.