


The first half of 2026 has been unusually eventful. The on-again, off-again war in Iran has continued to exact a human toll and weigh on the global economy. Fixed income performance also shifted sharply between the first and second quarters. In this research note, we decompose 2Q26 fixed income returns, examine how AI-related corporate issuance is changing fixed income indices, offer our initial assessment of new Federal Reserve Chair Kevin Warsh, and discuss our outlook and portfolio positioning for the remainder of the year.
Second-Quarter Fixed Income Performance
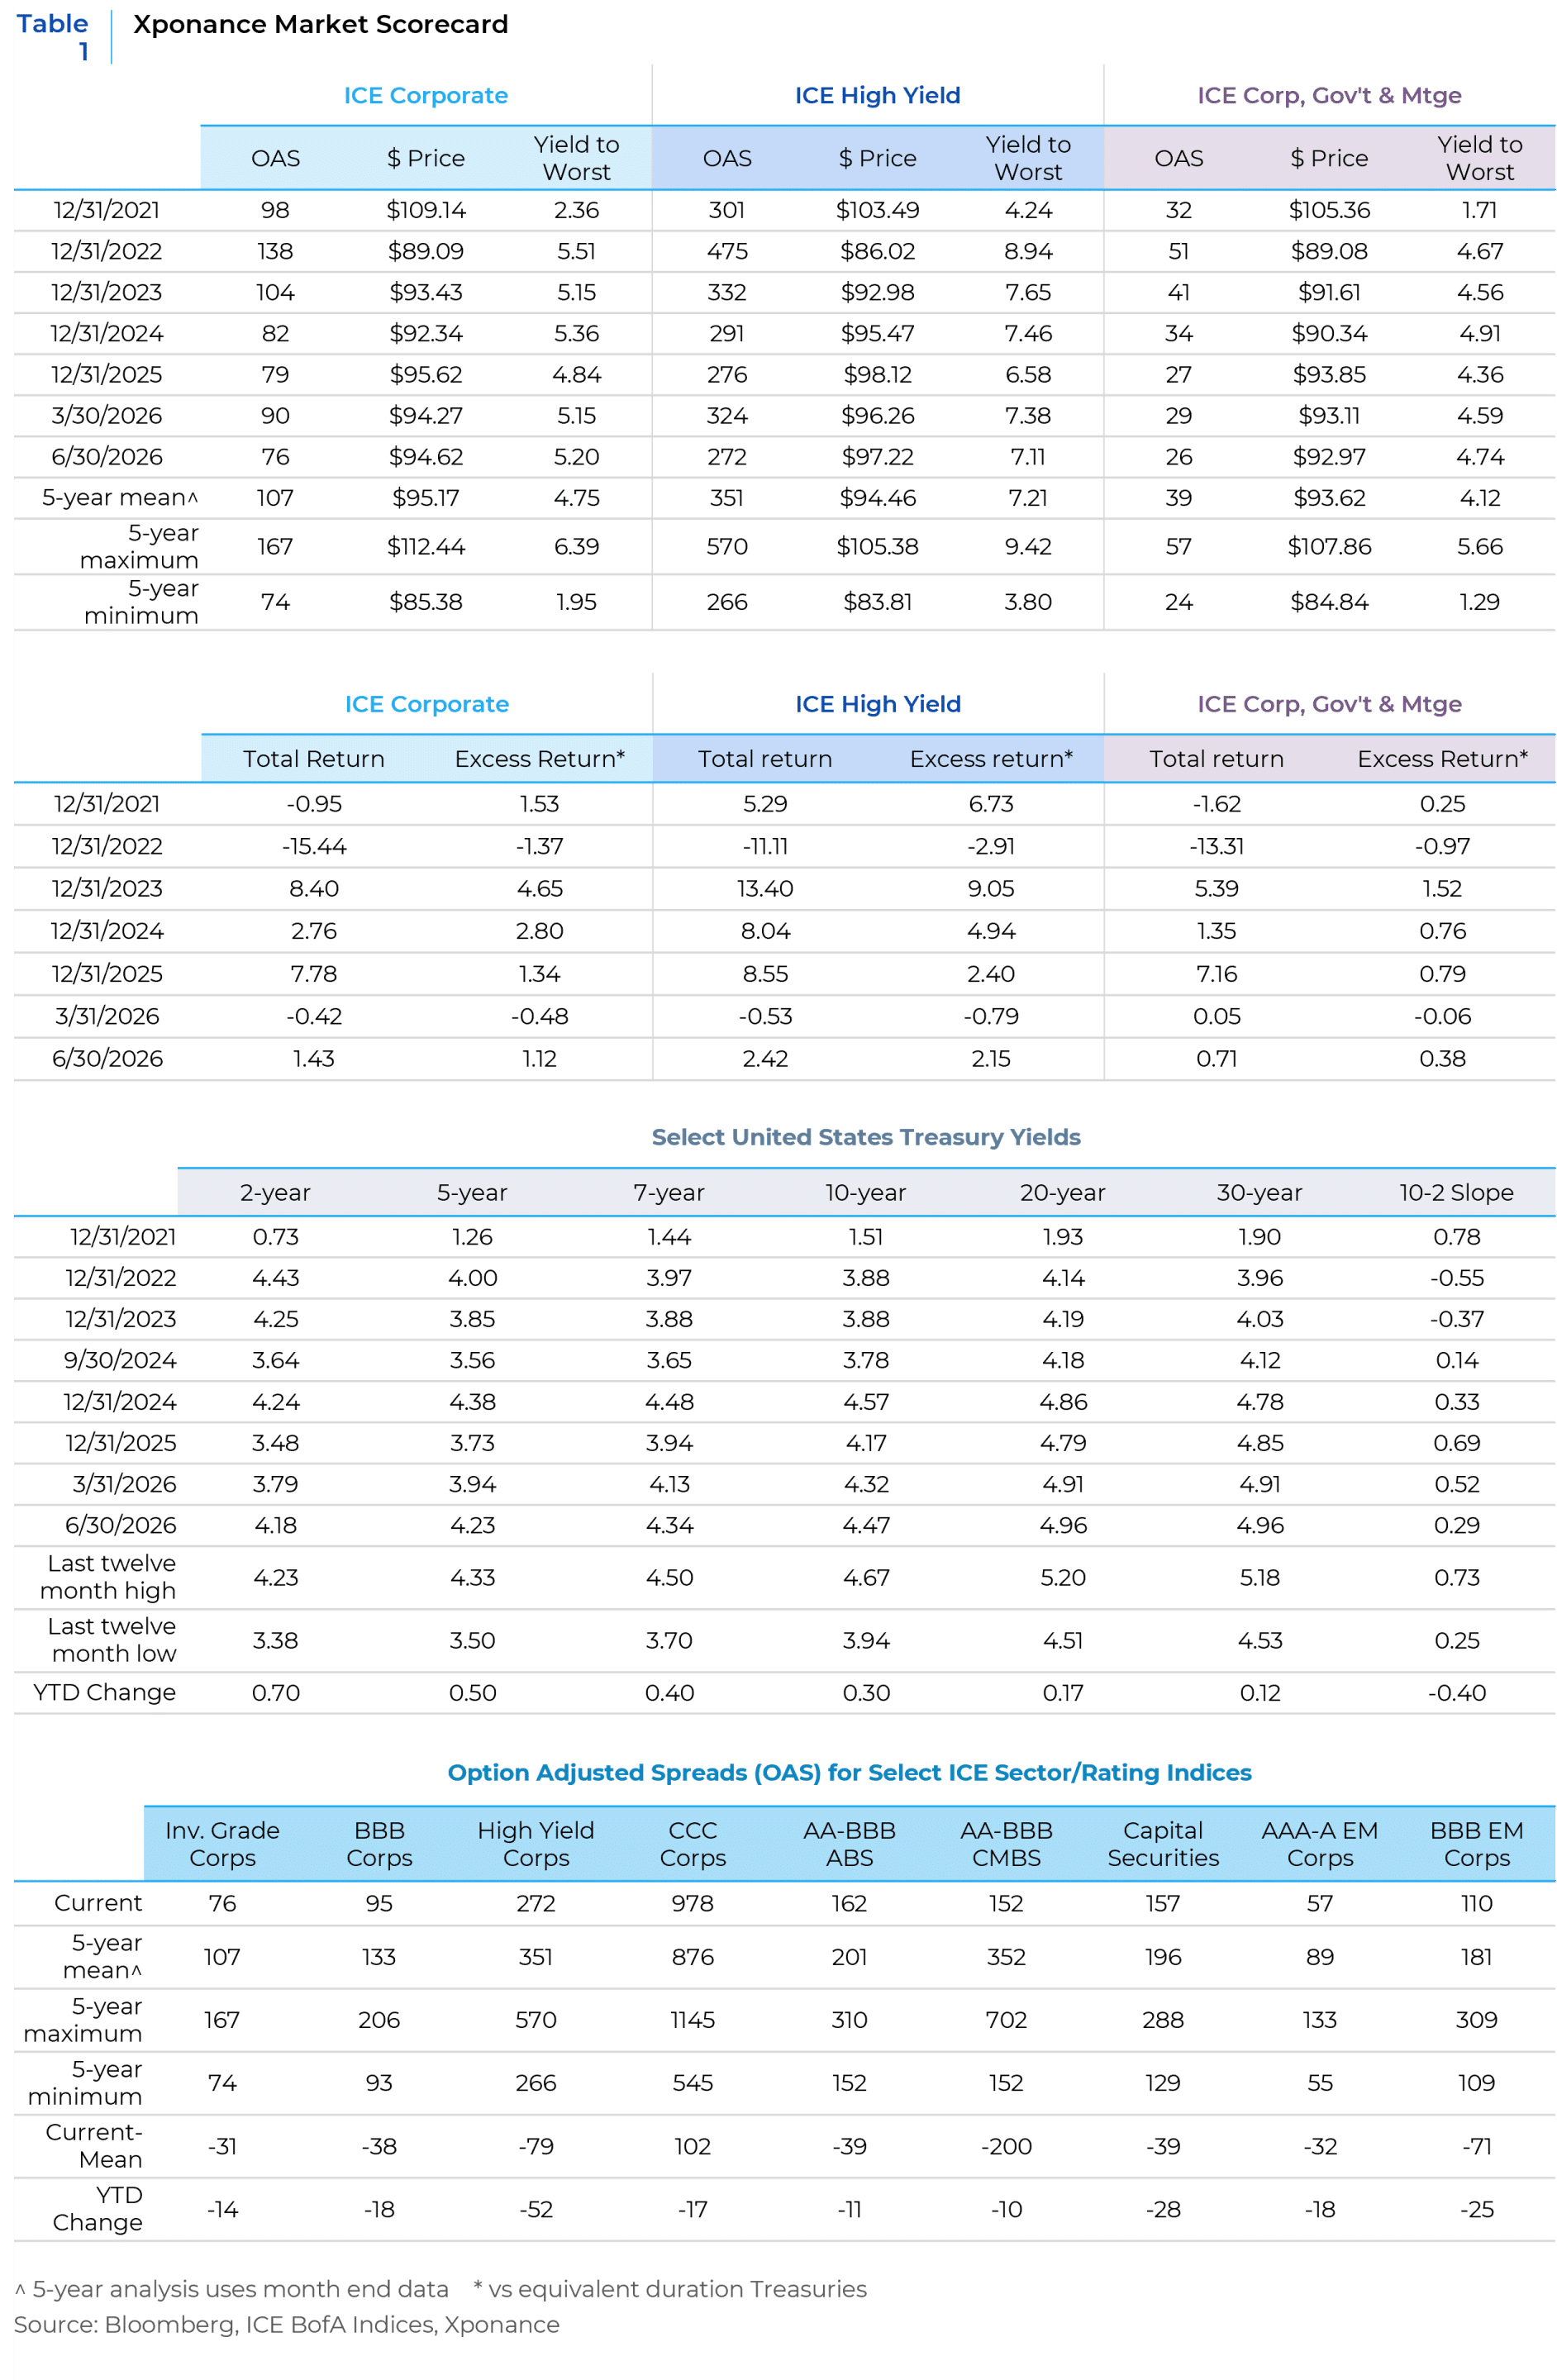
Broad fixed income returns turned positive in the second quarter after a difficult start to the year. At quarter-end, aggregate-like indices had a yield to worst of approximately 4.75% and a duration of roughly 5.8 years. That yield implies quarterly carry of about 1.2% before price changes, roll-down, and spread movement. Since the index returned only 0.70%, coupon income and carry contributed roughly +1.2%, while net price effects detracted approximately 0.5%. The 10-year Treasury yield began the quarter near 4.30%, reached 4.67% in May, and ended June at 4.47%. Thus, intra-quarter rate volatility was substantial even though the net increase in the 10-year yield was modest. The belly of the curve was particularly difficult for duration investors. Because the Aggregate has significant exposure to intermediate maturities, a bear-steepening or belly-led selloff can consume much of its coupon income.
The index therefore earned positive carry but only a modest total return. Several concerns drove the increase in rates:
- higher energy prices and renewed inflation risk related to the Iran conflict;
- diminished expectations for near-term Federal Reserve easing and a perceived shift toward a tightening bias;
- persistent fiscal and Treasury-supply concerns; and
- uncertainty about the Federal Reserve’s reaction function following Kevin Warsh’s confirmation as Chair.
Investment-grade corporates returned approximately 1.40%, more than twice the Aggregate’s return and well above the 0.32% return for Treasuries. Credit’s additional yield, rather than duration, was the benchmark’s primary positive return differentiator. Agency mortgage-backed securities (MBS), by contrast, returned approximately 0.66%, nearly matching the Aggregate. As is generally true in fixed income, except during brief periods of mark-to-market volatility, starting yield is the dominant driver of total return.
Opportunities Beyond the Aggregate
At Xponance, we search across the broad bond market for investment opportunities. Depending on the market cycle, we invest not only in index-eligible securities but also in core-like sectors and securities outside the index. Several of these areas again outperformed the Aggregate this quarter. Taxable municipals trailed investment-grade corporates but delivered a strong 1.11% total return. Credit ABS, which we define as the AA-to-BBB portion of the market, returned 1.05%. Treasury Inflation-Protected Securities (TIPS), which remain attractive given our inflation outlook, returned 0.81%. Because TIPS have low coupons by design, most of that return came from inflation accrual.

AI-Related Issuance and the Changing Corporate Indices
We have spent considerable time evaluating the AI investment cycle from a credit perspective. Fundamental credit analysis asks two basic questions: Will the company repay its debt, and does its financial policy provide adequate spread compensation while protecting creditors’ capital? Many observers describe the AI buildout as an infrastructure cycle. In a traditional infrastructure investment, such as a utility, REIT, or pipeline, capital spending initially raises leverage, which later declines as new assets generate revenue. The AI cycle is different in scale and visibility. Debt issuance and capital spending are enormous, yet there is limited assurance that EBITDA will grow enough to reduce and stabilize leverage. Or whether rapid technological obsolescence will leave stranded debt with little or no cash flow to service it. The resulting issuance is also entering corporate indices, affecting benchmark composition and the active share of managed portfolios. Although we do not favor passive fixed income, given the major bond indices’ historically bottom-quartile performance, passive investors are becoming increasingly exposed to the AI trade.
As noted in previous commentaries, companies are funding AI-related capital expenditure through several channels, making the full amount of debt difficult to measure. Our 1Q26 commentary focused largely on issuance through the ABS market. Traditional corporate issuance has since drawn more attention as investors recognize how quickly corporate indices are changing. Much of the financing remains off balance sheet and therefore outside traditional fixed income indices, but public issuance in both the U.S. and European bond markets has accelerated. From December 2024 through June 2026, the ICE BofA U.S. Corporate Index shifted away from traditional financial sectors and toward technology and utilities, while overall credit quality remained stable. Sector changes in the smaller ICE BofA Euro Corporate Index were different and more heavily influenced by the refinancing needs of individual issuers.
In the U.S. Corporate Index, Utilities (+0.75%) and Technology & Electronics (+0.48%) recorded the largest allocation increases. Within Technology, Software/Services grew the most (+0.42%), driven by issuance from cloud-computing and enterprise-software companies. Electric-Integrated utilities also expanded (+0.29%) as issuers raised debt to fund the power infrastructure required by AI. The company-level changes are equally notable. Amazon, previously outside the top 20, is now the ninth-largest issuer, with $96 billion of debt. Meta entered at number 11, with $84 billion in face value, while Oracle rose from 12th to 5th as its debt increased from $75 billion to $117 billion. Seven of the 10 issuers with the largest increases in face value are directly connected to the AI trade. SpaceX entered the index through its inaugural $25 billion deal, while NextEra Energy (an AI-exposed utility) became the 19th-largest issuer.
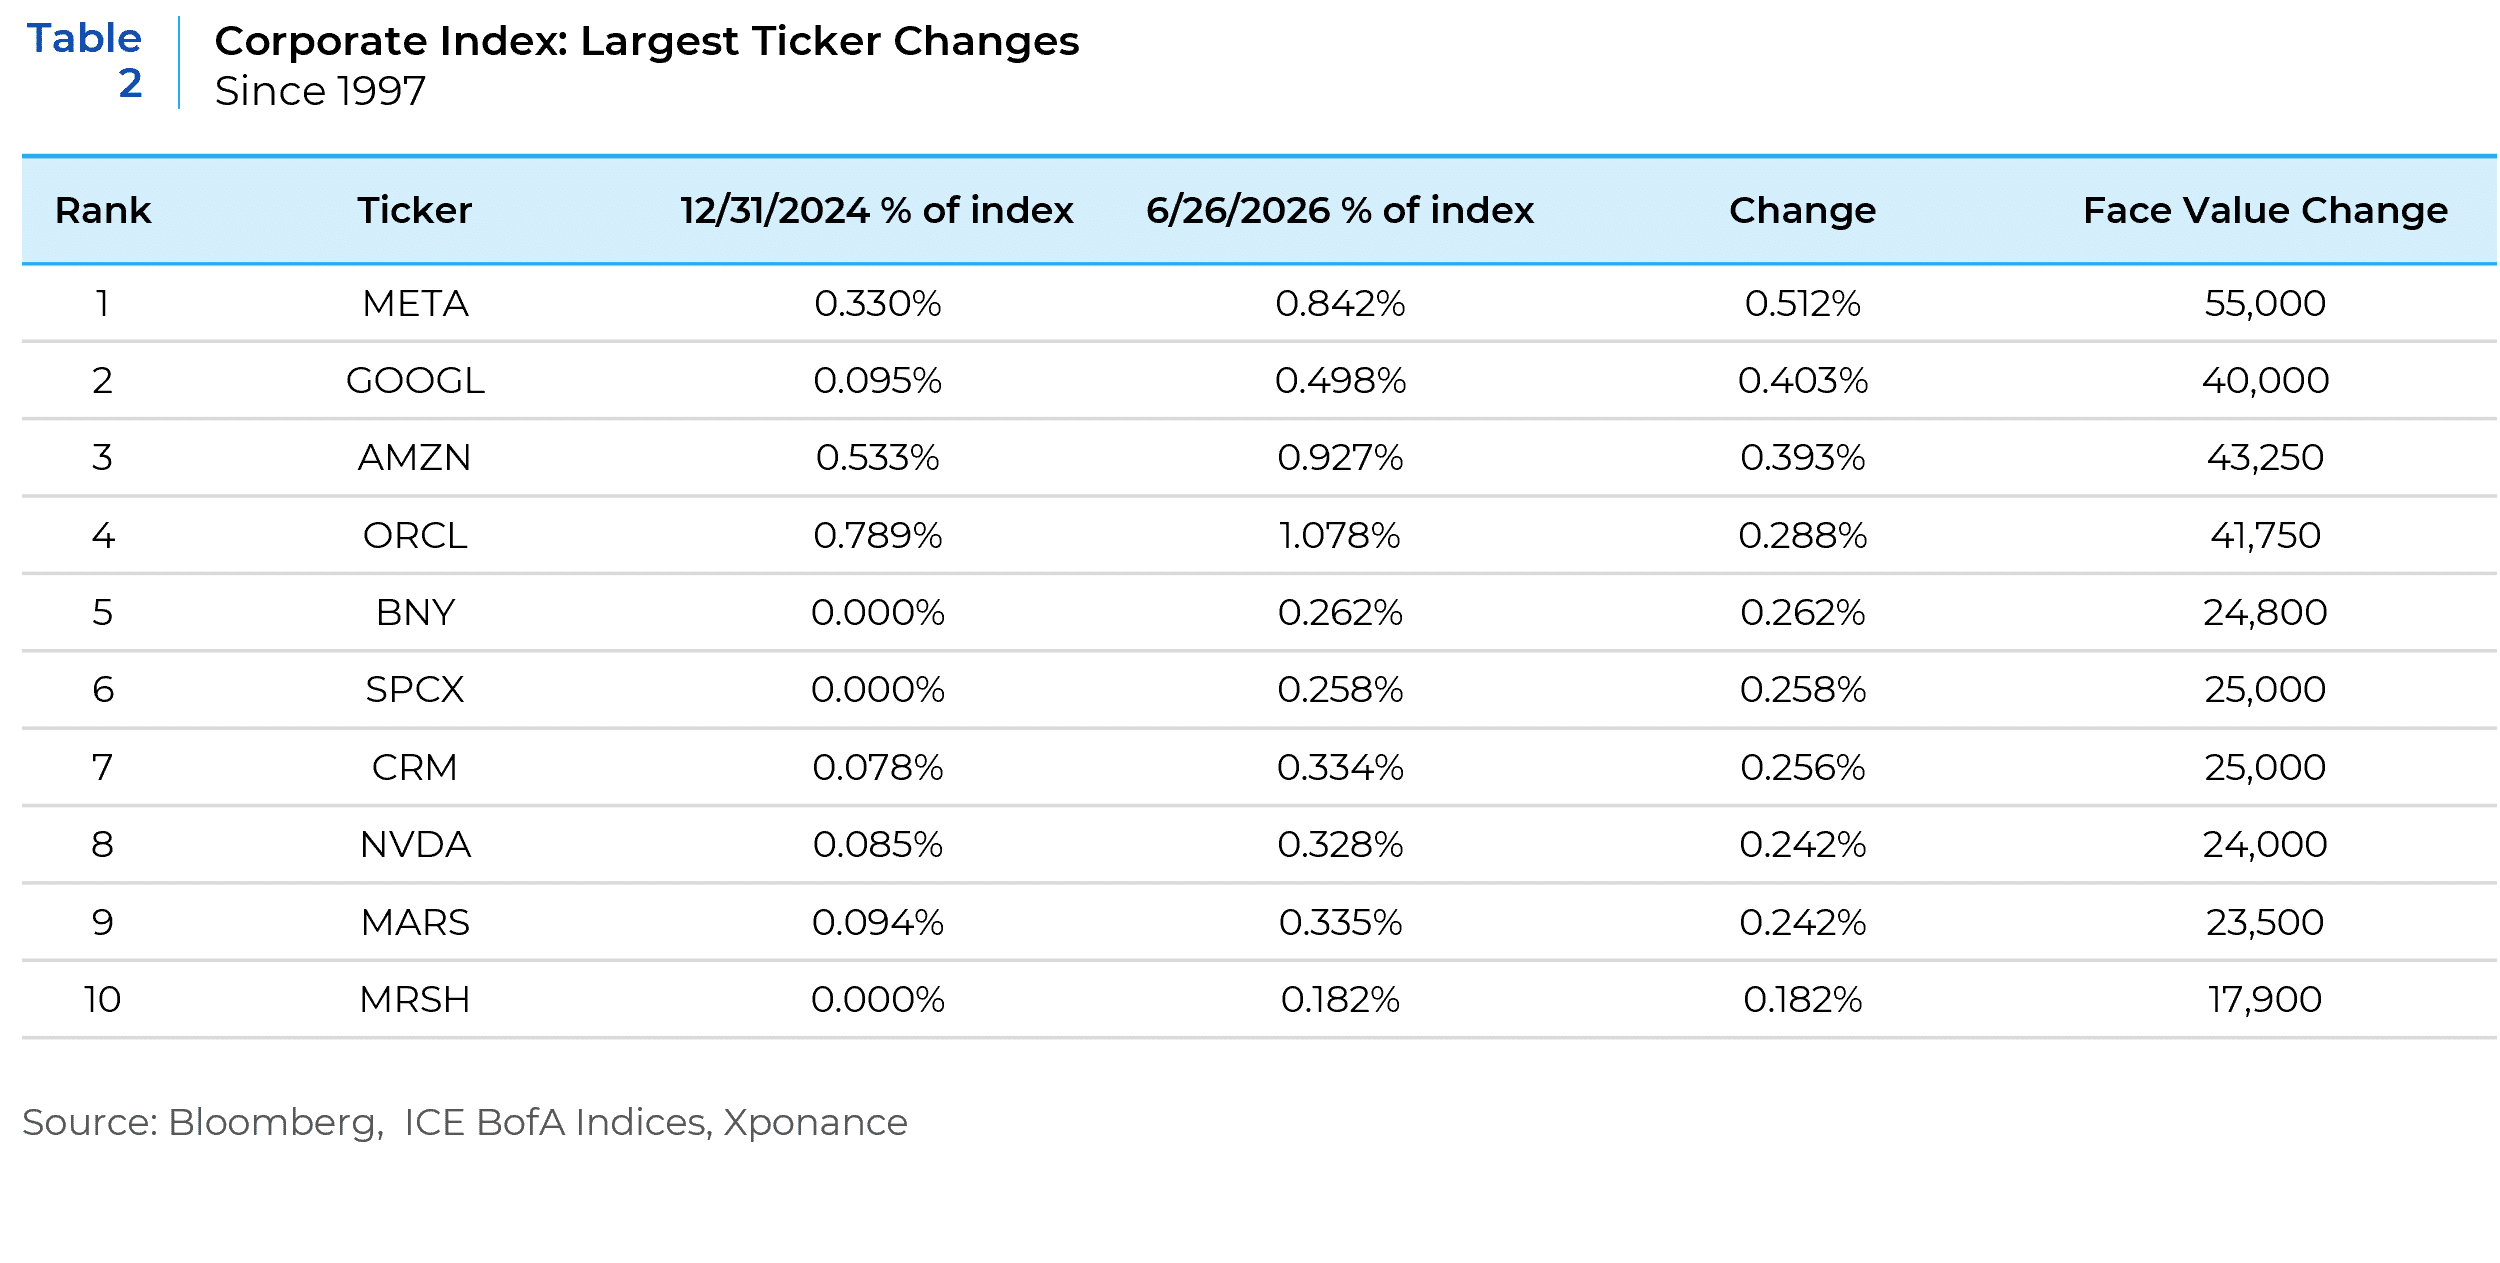 The Euro Corporate Index followed a different pattern. Software/Services recorded the fifth-largest sector increase, while Alphabet (Google) and Amazon were the two largest new entrants to the euro-denominated market, at €22.25 billion and €12.75 billion, respectively. Alphabet is now the index’s 20th-largest issuer, and we expect it to continue issuing in both Europe and the United States. Alphabet, Amazon, and NextEra Energy, which increased debt outstanding in both markets, were the only AI-related names among the 10 largest increases in face value. Given the announced capital-spending plans of these and other companies, AI-related issuers should continue to have an outsized effect on index composition.
The Federal Reserve Under Kevin Warsh
Kevin Warsh is the first Federal Reserve Chair since Ben Bernanke to undertake a fundamental reassessment of the role after succeeding a long-serving predecessor. On July 9, he announced five task forces, co-led by external advisers, to examine areas central to the conduct of monetary policy. Using the Federal Reserve’s descriptions, the task forces are:
- Communications: Review how the Federal Reserve conveys policy deliberations and decisions amid uncertainty.
- Balance Sheet Policy: Examine the costs, benefits, and institutional implications of the Federal Reserve’s current balance sheet regime.
- Data: Improve the quality and timeliness of real economic signals that inform the Federal Reserve’s policy judgments.
- Productivity and Jobs: Assess the economic impact of new general-purpose technologies, including artificial intelligence, to inform the Federal Reserve’s policy judgments.
- Inflation Frameworks: Revisit how the Federal Reserve understands and responds to the drivers of inflation.
Together, the five task forces challenge several elements of the status quo. Warsh has also questioned forward guidance, and the Fed is changing the conventions that govern public communication by Reserve Bank presidents and Board governors.
Several articles have argued that new Fed Chairs typically bring higher market volatility, particularly if Warsh ends forward guidance. Our research finds little evidence for that claim. Volatility depends more on prevailing economic and monetary conditions than on a change in leadership. Several recent policy tools, including zero interest-rate policy (ZIRP), quantitative easing (QE), the dot plot, and the Summary of Economic Projections (SEP), may ultimately prove specific to a particular period rather than permanent features of central banking. In our view, the greater transparency introduced under Bernanke was partly a response to the near-obstinate opacity of the Alan Greenspan era. Changes to balance sheet policy could be particularly important, affecting markets both immediately and over time. A smaller or differently managed balance sheet could also call the reliability of the ‘Fed put’ into question as well as potentially leading to higher equilibrium rates.
Other aspects of Warsh’s agenda may nevertheless increase volatility. His desire to shrink the balance sheet, limit public commentary by Fed officials, and establish a markedly different regulatory regime, as suggested by the five task forces, would represent the most significant changes in Federal Reserve practice since Bernanke took office before the Global Financial Crisis.
Outlook and Portfolio Positioning
Despite the volatility of the first half of 2026, our core investment themes remain largely unchanged. With credit spreads at or near all-time tights, security and sector selection are critical. Spreads do not adequately compensate investors for the risks in the economy, although today’s higher absolute yields provide some cushion against rising rates or wider spreads, as they did in 2Q26. The view that spreads are unattractive is hardly contrarian. Nevertheless, investors do not hire core fixed income managers simply to own Treasuries, a strategy that is likely to underperform over time. As discussed previously, we use a spread-beta framework to estimate downside risk and potential outperformance across index subsectors. Because spreads currently offer little differentiation between high- and low-beta issuers, we continue to favor names and sectors with less downside risk.
We also view long-end Treasuries as vulnerable given the fiscal backdrop, heavy issuance needs, persistently large budget deficits, and the potential for structurally higher inflation. Accordingly, our underweight in 20- to 30-year Treasuries is more pronounced than usual. We continue to believe that inflation will prove more persistent than current market pricing implies. The analysis of Treasury Inflation-Protected Securities (TIPS) in last quarter’s commentary therefore remains relevant, and we continue to find the sector attractive. Our broad-market portfolios are also at market weight in agency MBS, an atypical position for us.
Our defensive posture also favors short-duration spread exposure over long-duration spread exposure. Although the market value of our spread holdings remains near the upper end of its historical range, their contribution to portfolio duration is lower. This structure should limit downside and allow us to move quickly if spreads widen. When volatility creates better entry points, we are prepared to add higher-yielding, higher-beta sectors and asset classes. Potential areas for deployment include corporate hybrids, higher-quality high yield, longer-duration credit, and taxable municipals.
This report is neither an offer to sell nor a solicitation to invest in any product offered by Xponance® and should not be considered as investment advice. This report was prepared for clients and prospective clients of Xponance® and is intended to be used solely by such clients and prospective clients for educational and illustrative purposes. The information contained herein is proprietary to Xponance® and may not be duplicated or used for any purpose other than the educational purpose for which it has been provided. Any unauthorized use, duplication or disclosure of this report is strictly prohibited.
This report is based on information believed to be correct but is subject to revision. Although the information provided herein has been obtained from sources which Xponance® believes to be reliable, Xponance® does not guarantee its accuracy, and such information may be incomplete or condensed. Additional information is available from Xponance® upon request. All performance and other projections are historical and do not guarantee future performance. No assurance can be given that any particular investment objective or strategy will be achieved at a given time and actual investment results may vary over any given time.