
Consumer Resilience: What Lies Ahead?
The key question going into the final quarter of 2023 and glancing towards 2024, is whether U.S. consumers, that account for roughly two-thirds of its total activity, will continue to keep the economy afloat. The resiliency in consumer spending has been supported by three pivotal drivers:
- A robust labor market consistently fueling incomes, thus spurring increased spending and further labor demand.
- Households’ substantial savings accumulated during the pandemic, facilitated by considerable fiscal transfers.
- Enhanced household wealth, particularly fostered by lenient monetary policies during the pandemic era.
While these elements have been advantageous, potential obstacles loom ahead. Despite a moderating inflation rate, persistently high costs of food and fuel are pressuring consumers. Moreover, the revival of student loan payments after a prolonged hiatus could dent GDP growth by an estimated 0.8 percentage points in the fourth quarter of this year. Estimates suggest that surplus savings might be tapering off, and rising concerns over job security loom as wage growth begins to decelerate, even though the labor market remains sound.
A change in consumer spending trends can have a significant impact on the economy. With rising costs of living, consumer spending tends to be focused on necessities and spending on discretionary expenses like vacations, electronics, high-end retail items, and home improvement projects trend down. This in turn has a big impact on the inventory and sales of companies in the consumer discretionary sector. More broadly speaking, in an environment characterized by increasing and high interest rates, rising credit card debt, and dipping into past savings are consumer trends that can have a slowing effect on economic growth and company earnings.
Third Quarter Market Recap
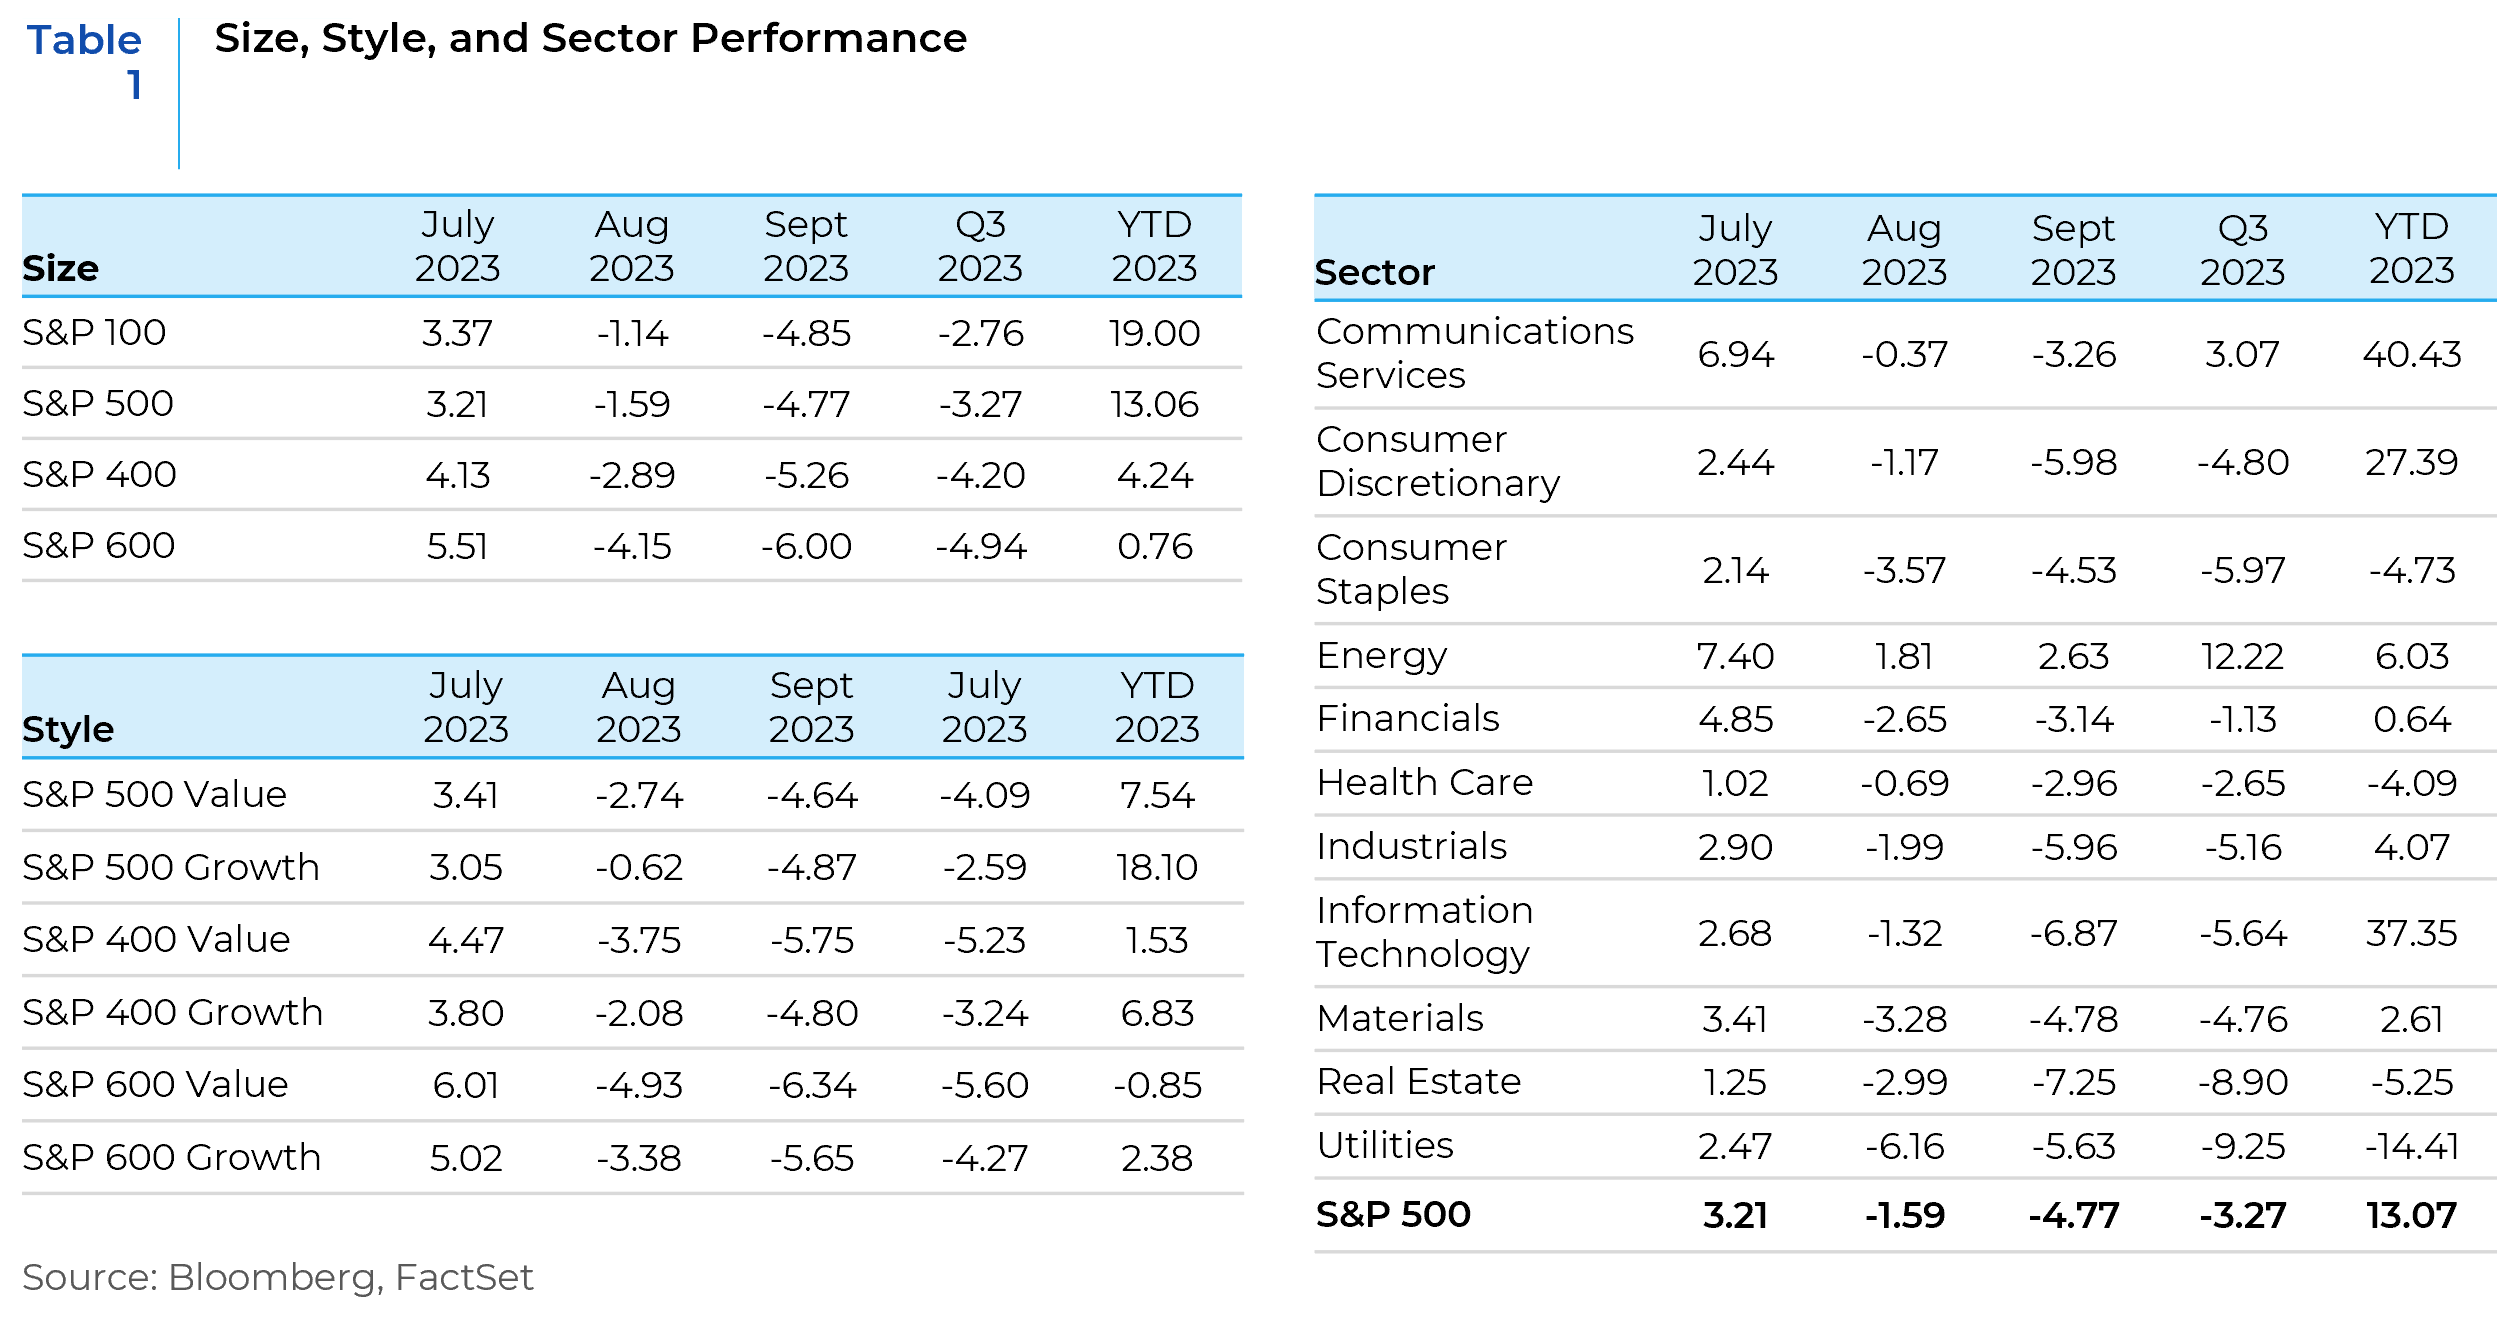
Most equity indices ended the third quarter of 2023 in the red, as inflation remained high, oil prices soared, and hopes of soft landing were dashed by the Fed’s ‘higher for longer’ guidance. The prospects of a US government shutdown added to investor nervousness in late September. Anemic China growth, disinflationary pressures on corporate earnings, and negative September seasonality also weighed on mega cap momentum. The S&P 500 hit its YTD closing high on 31st July, but fell thereafter, with the decline accelerating in September. There were also worries about the consumer impact on the coming resumption of student-loan payments in October; a long-threatened strike against Detroit automakers by the UAW union that erupted in September; and the vigorous debate around the status of consumers’ pandemic savings. The confluence of these themes resulted in the path of least resistance to the downside in the third quarter of the year.
Market Outlook – The State of the Consumer
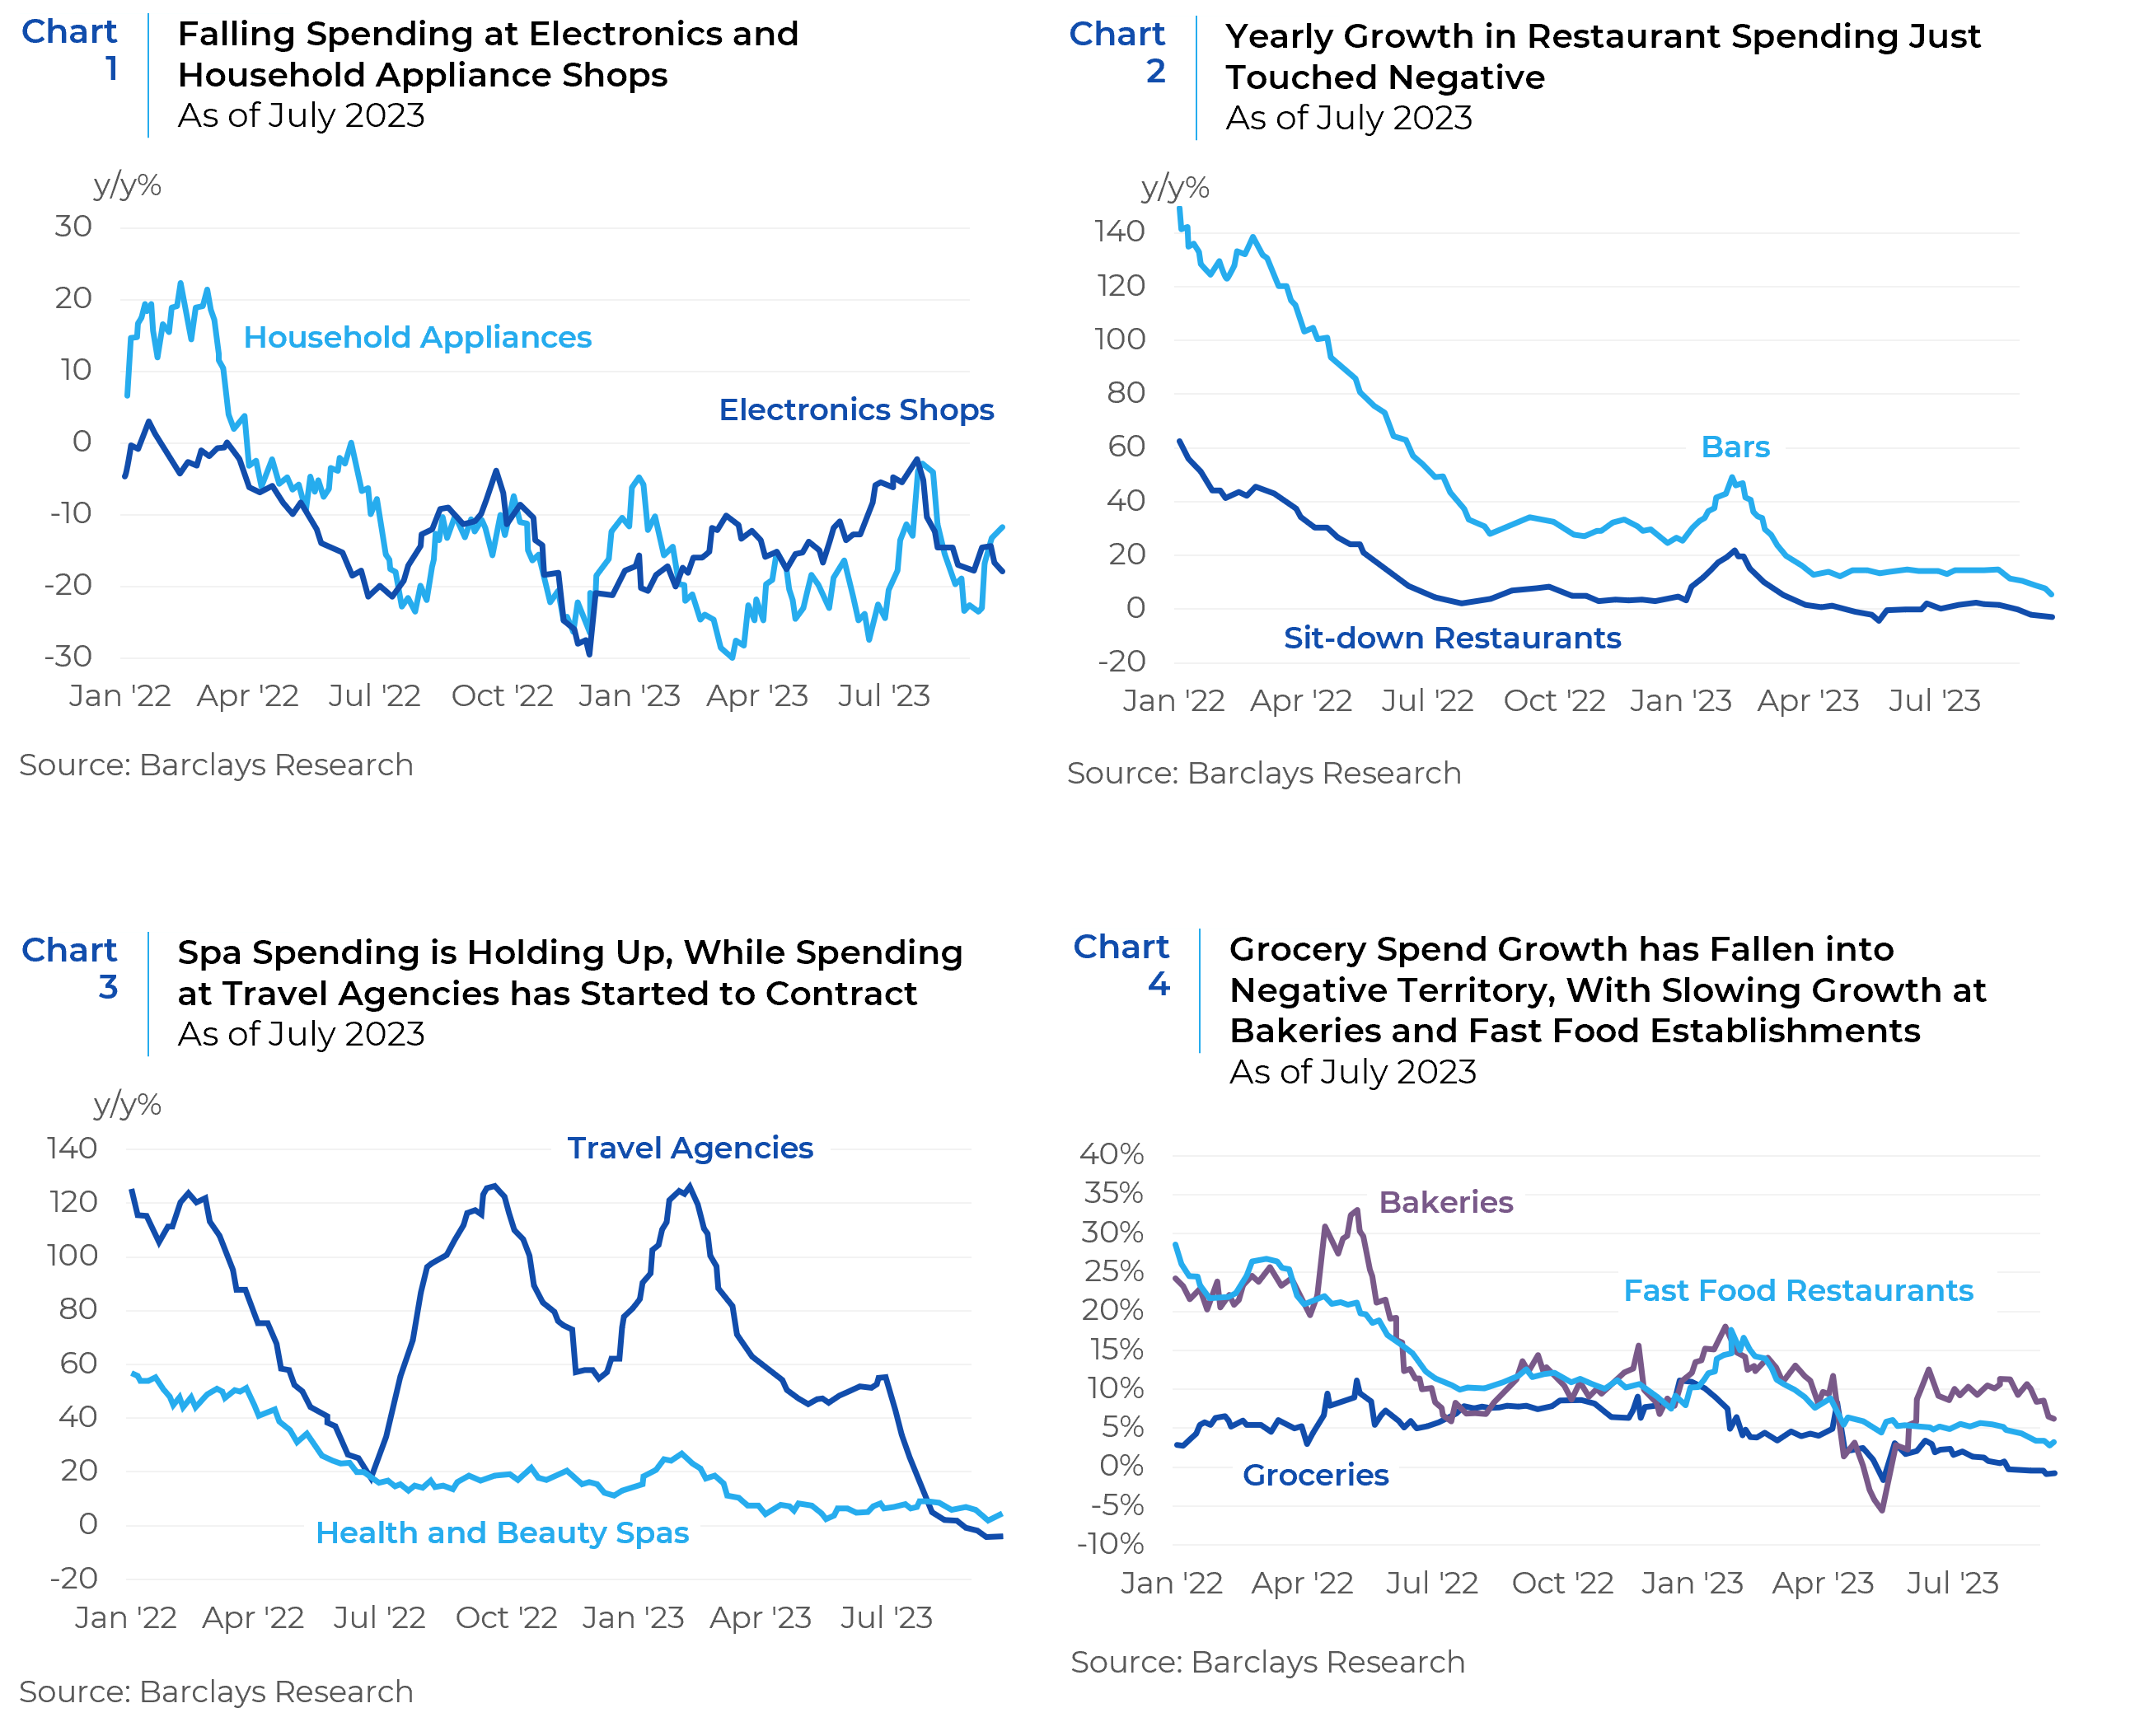
The consumer is increasingly likely to face some headwinds with labor demand slowing, resumption of student loan payments, elevated food and fuel prices, drawdown of excess savings, and the correction of the savings rate toward pre-pandemic norms. Some of the consumer spending trends in Charts 1 to 4 below lend support to the stretched consumer theory –
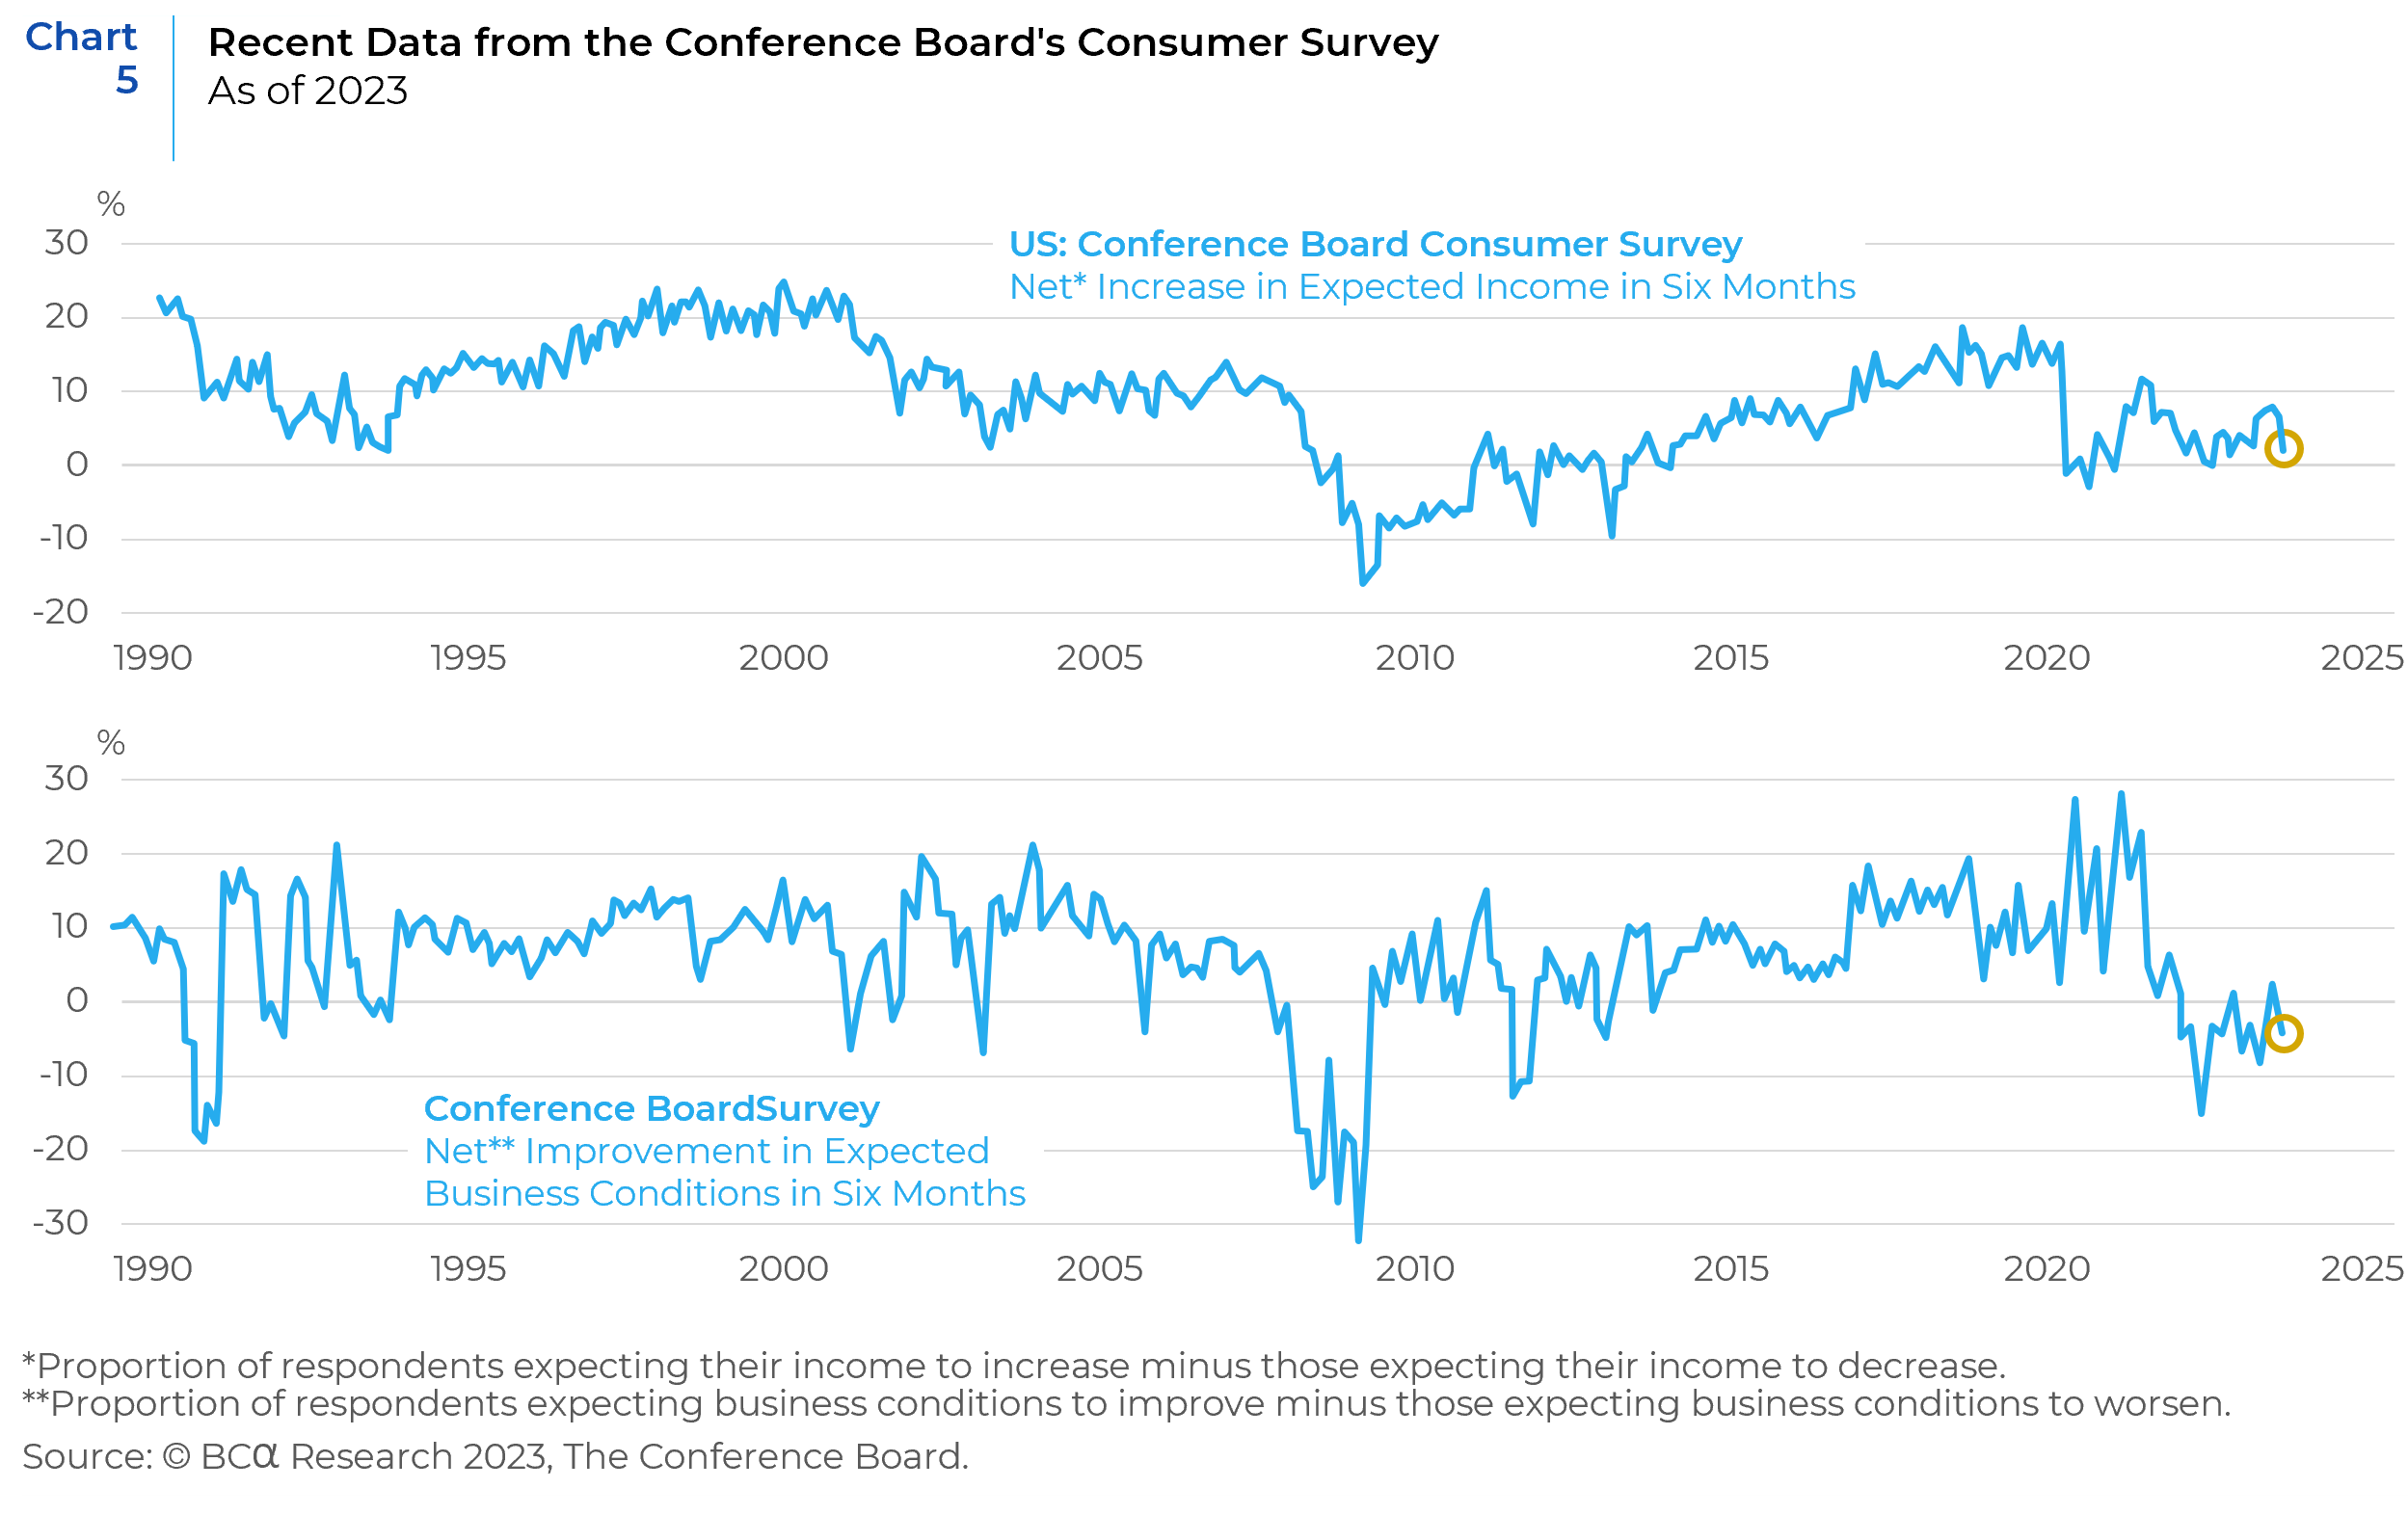
Recent data from the Conference Board’s Consumer Survey paints a mixed picture, with noticeable declines in both Expected Income and Expected Business Conditions as illustrated in Chart 5. Although the present conditions remain strong, there’s a discernible shift in sentiment, indicating that US households harbor growing doubts about the economic trajectory over the next half year. The outlook for short-term business conditions has deteriorated due to a dual effect: not only is there a reduction in the number of respondents that are optimistic about the future, but there’s also a rise in those bracing for more challenging times. This declining consumer confidence has broader ramifications. As optimism ebbs, households may become more circumspect about their spending, particularly on non-essentials. A pullback in discretionary spending can reverberate through the economy, potentially dampening growth and further testing the resilience of equity markets.
Softening Labor Market Metrics
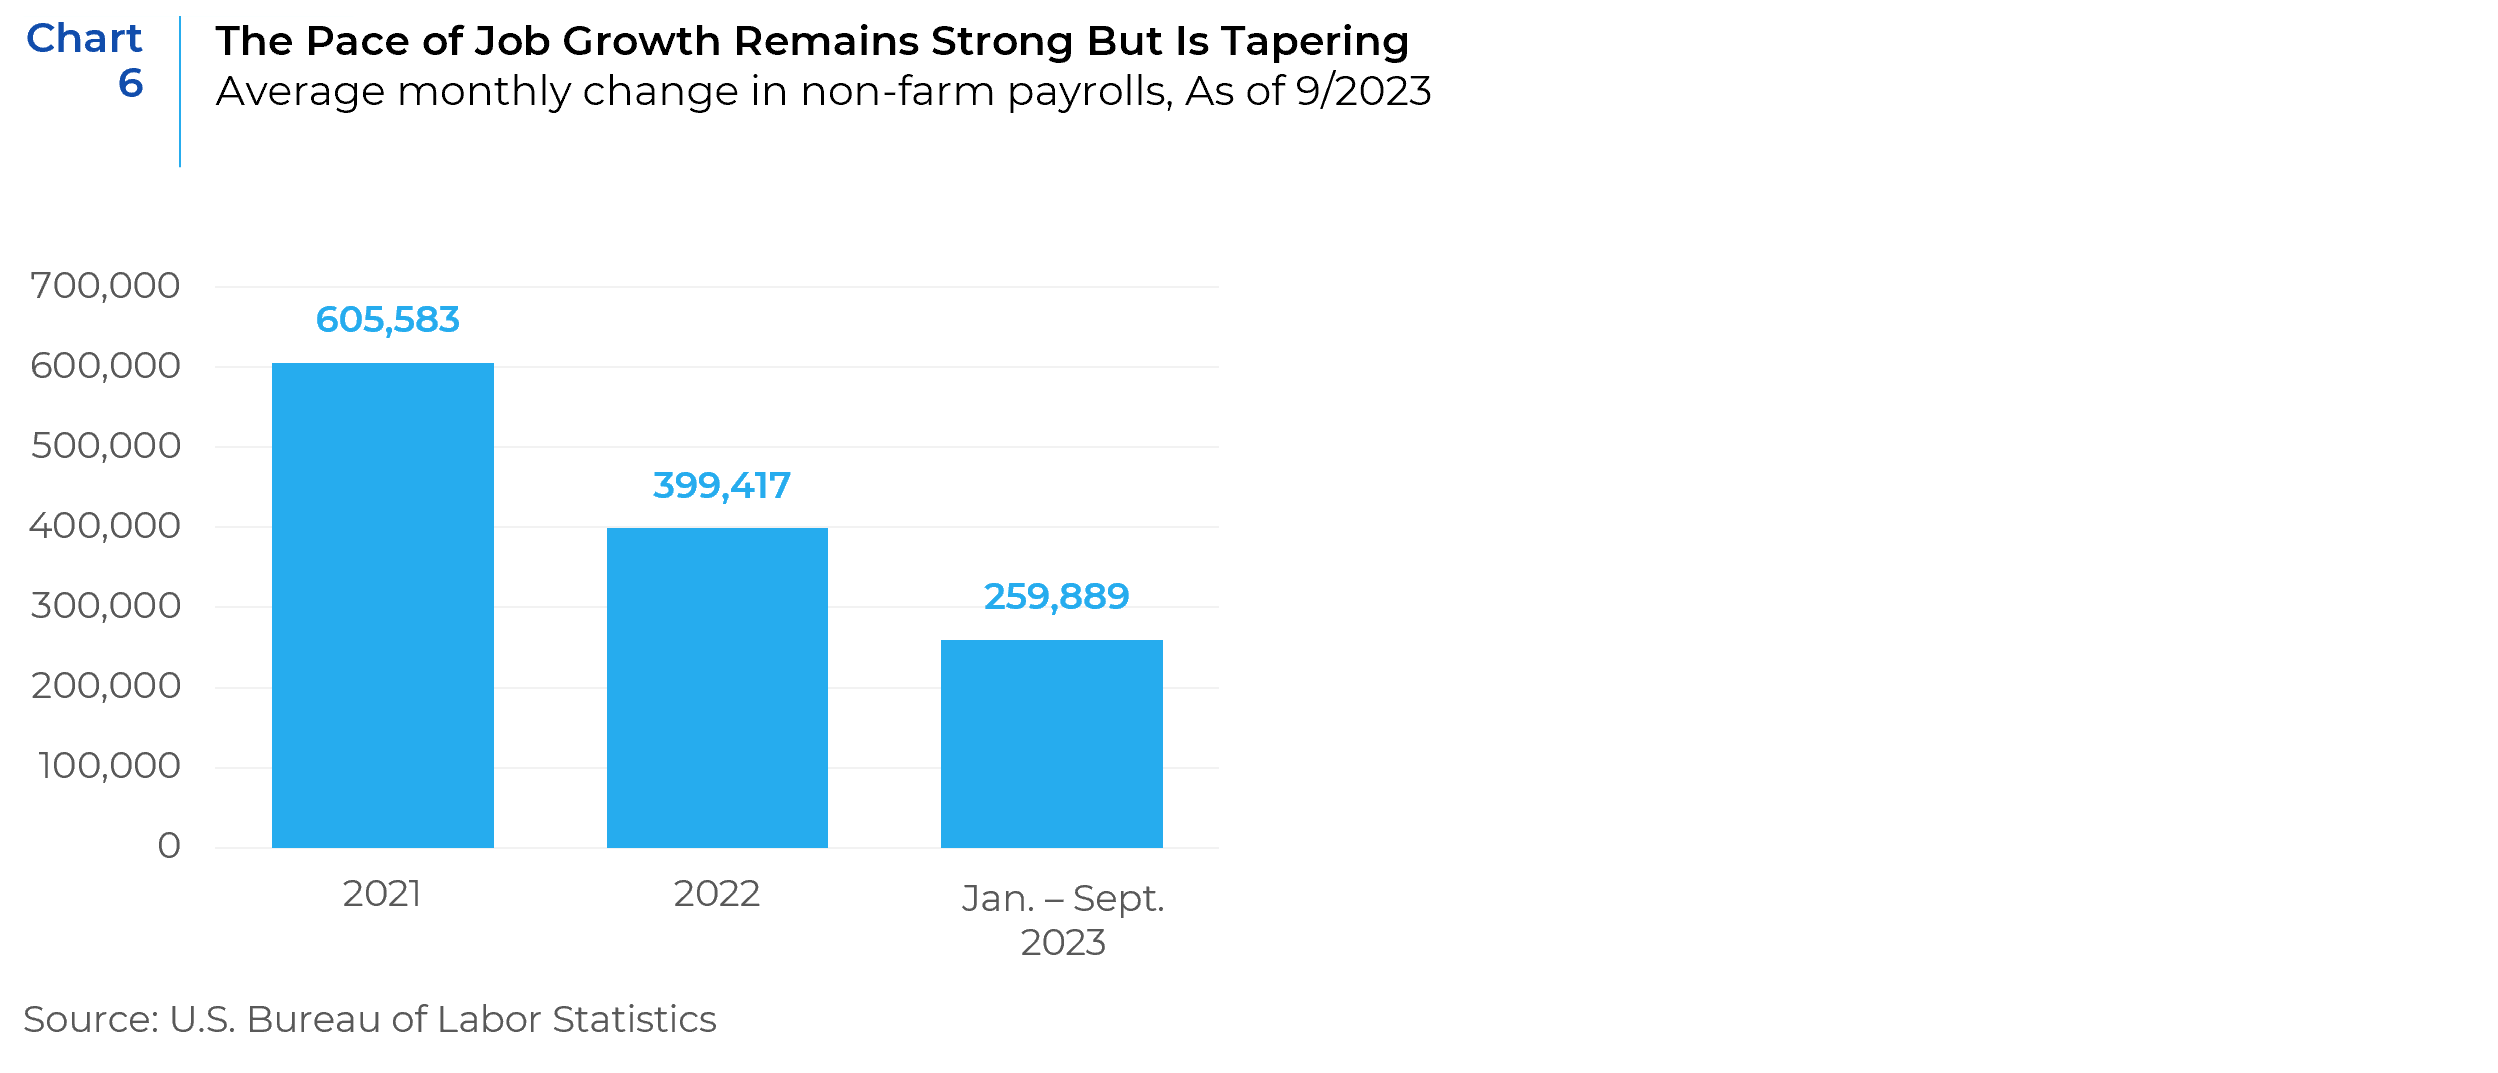
Rapid job growth was a feature of the economy throughout 2021 and 2022. The U.S. Bureau of Labor Statistics reported that for all of 2022, non-farm payrolls grew by an average of 399,000 jobs per month. This represented a slower pace than 2021’s rapid job growth, which topped 605,000 per month. In 2023, the pace of new job growth continues to demonstrate stability but has slowed down considerably (Chart 6). While the numbers are still at robust levels, the downward trend in job growth may become a cause for concern in the coming quarters.
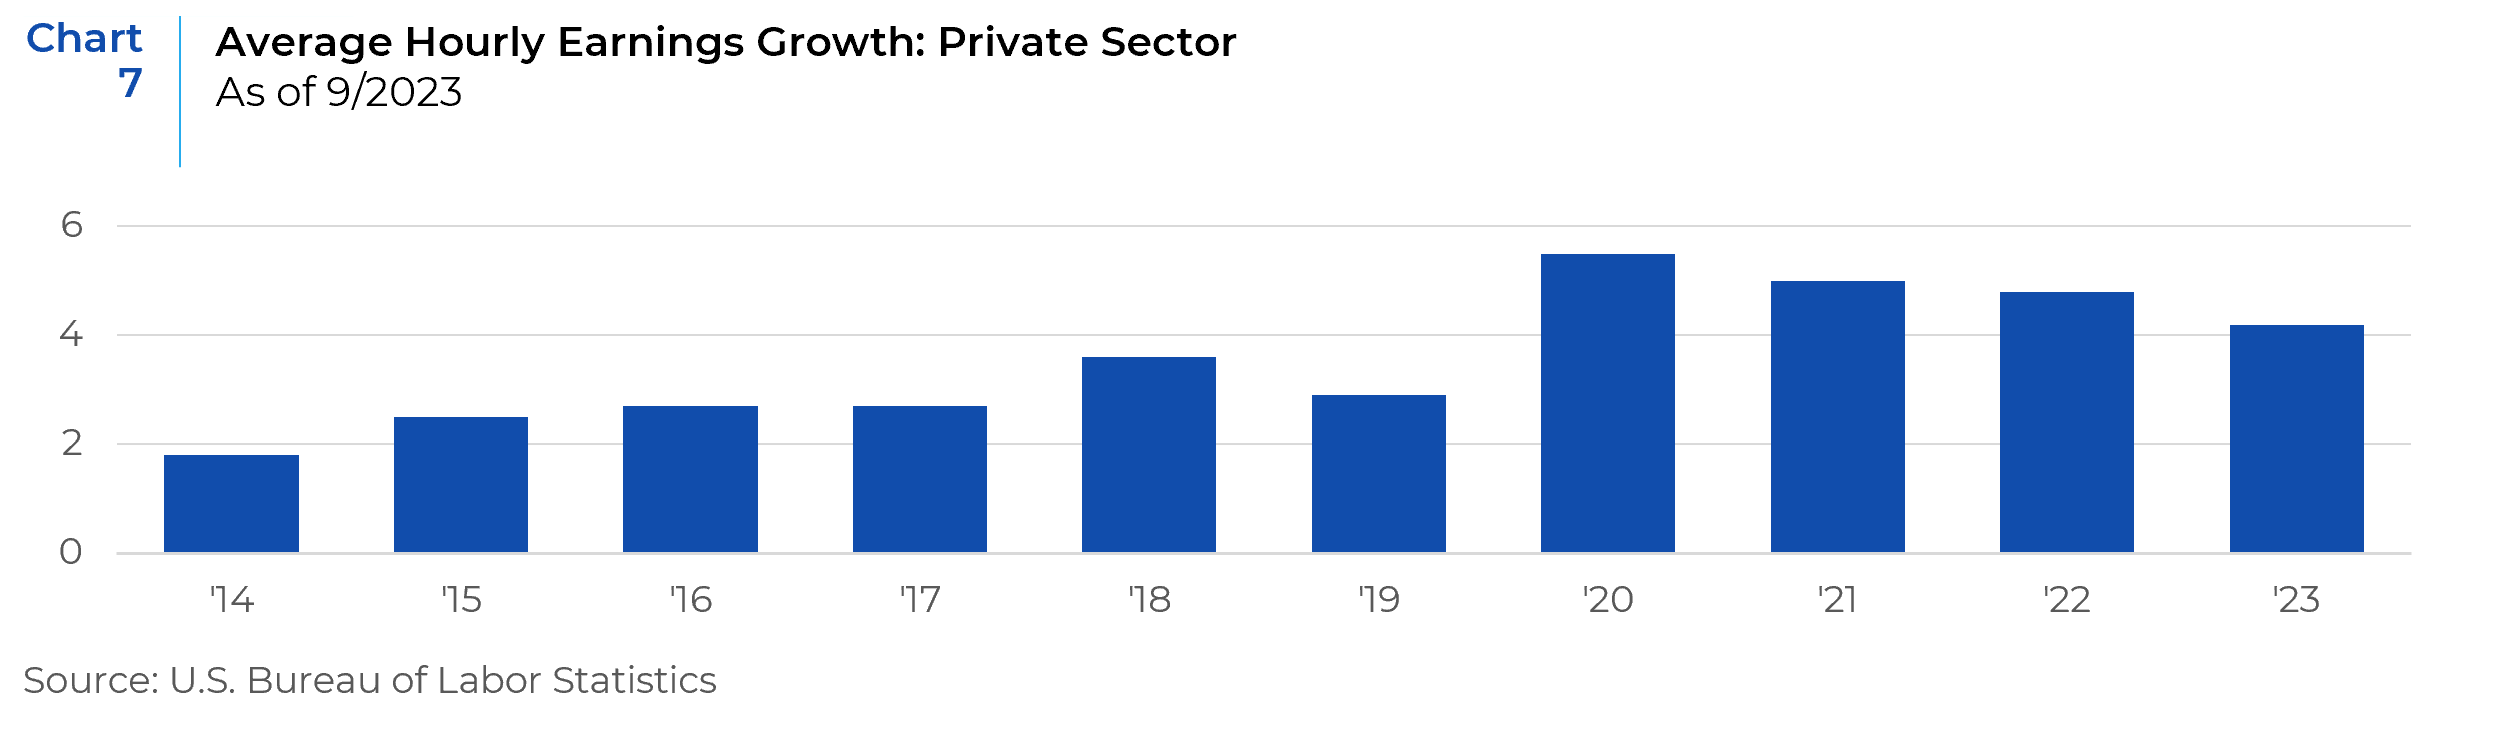
While it is necessary to monitor the job market’s strength, changes in wage growth is another key metric to watch to determine where consumer sentiment and consumer spending are headed. Average hourly earnings growth surged in 2020 but have been trending down since then and the rate of that downward trend is starting to pick up pace (Chart 7).
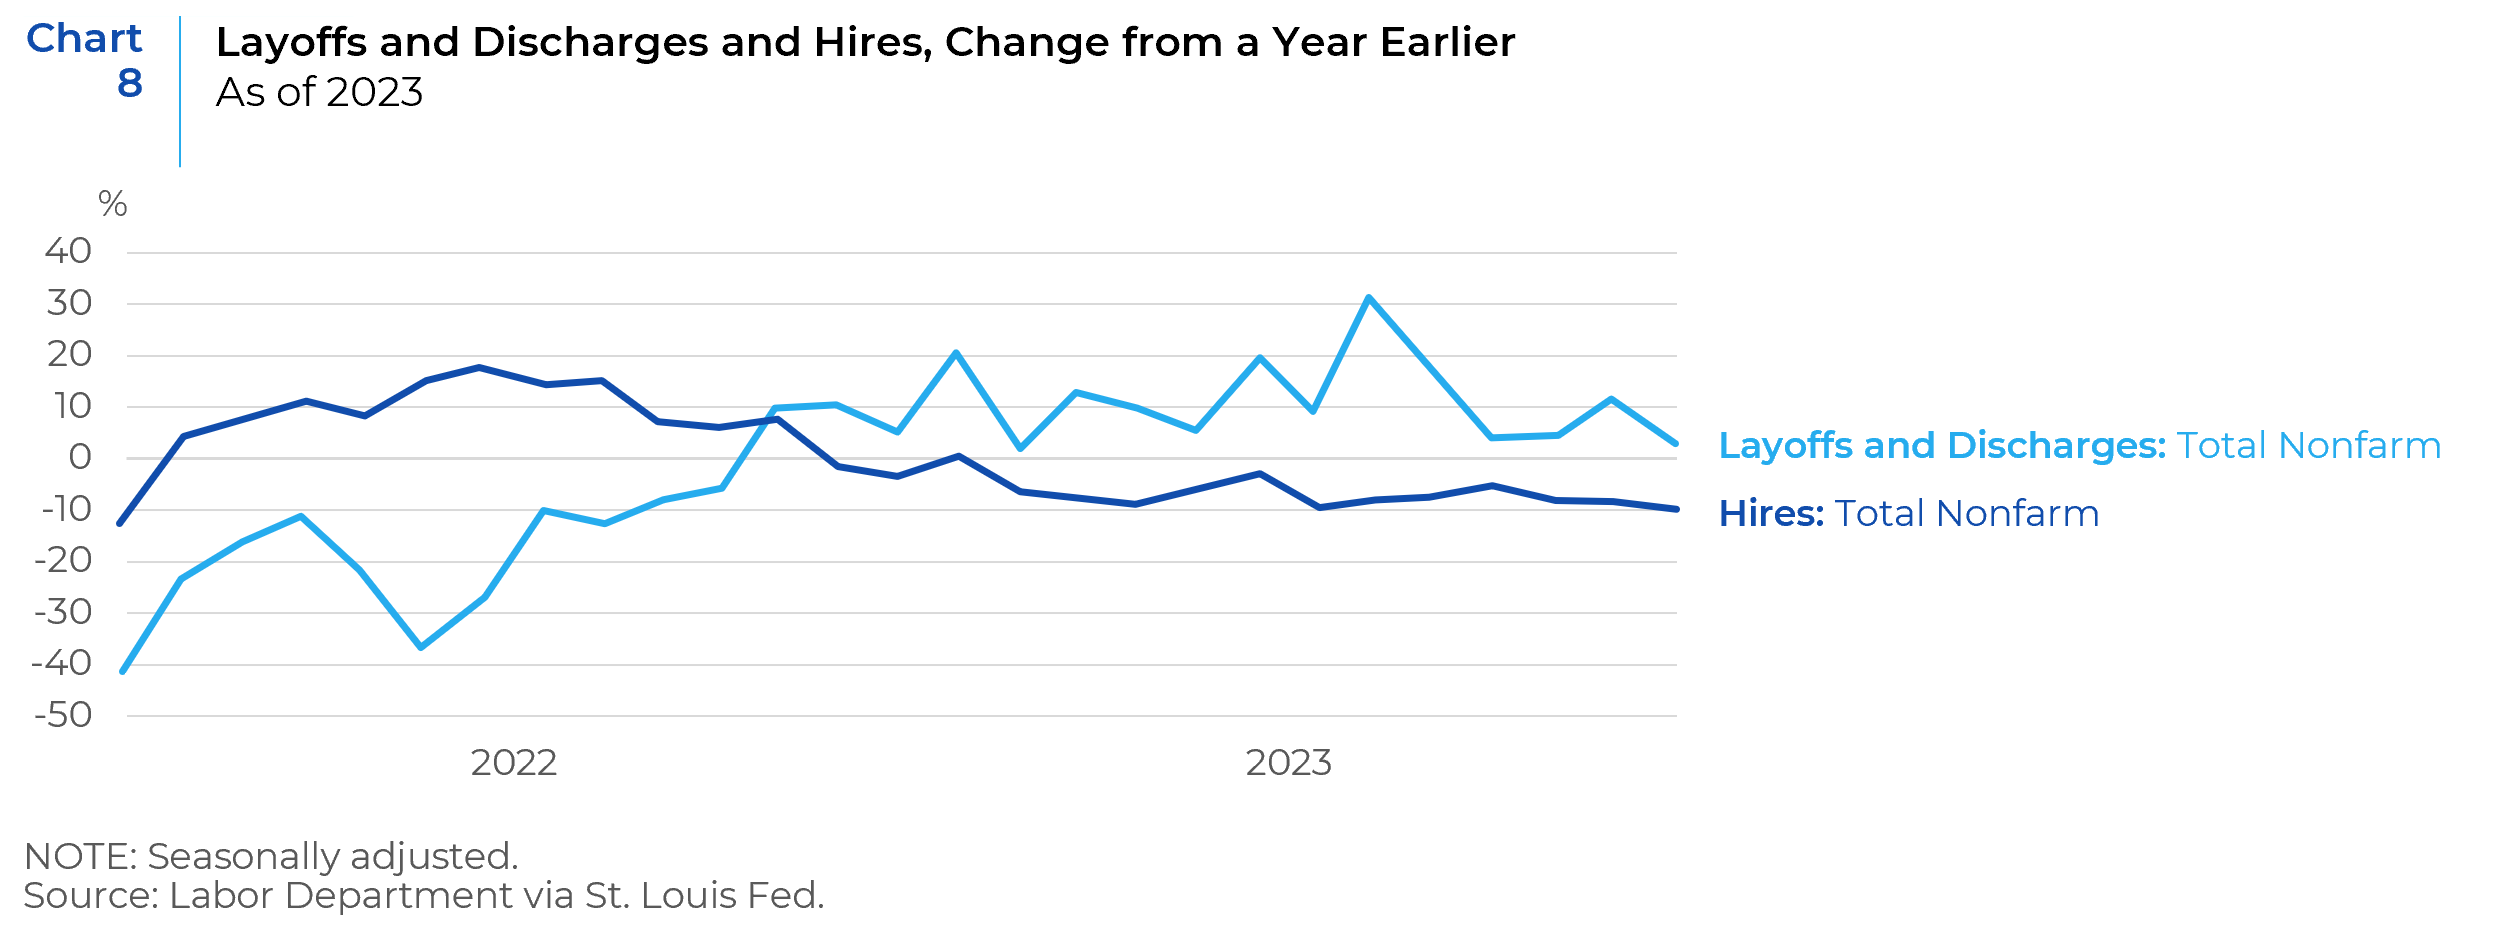
The other concerning trend is the increase in layoffs and discharges when compared to hires (Chart 8). Manufacturing, financial services and tech firms have all had bouts of layoffs in the past year.
A Tale of Two Pictures: Robust Savings but Weakening Debt
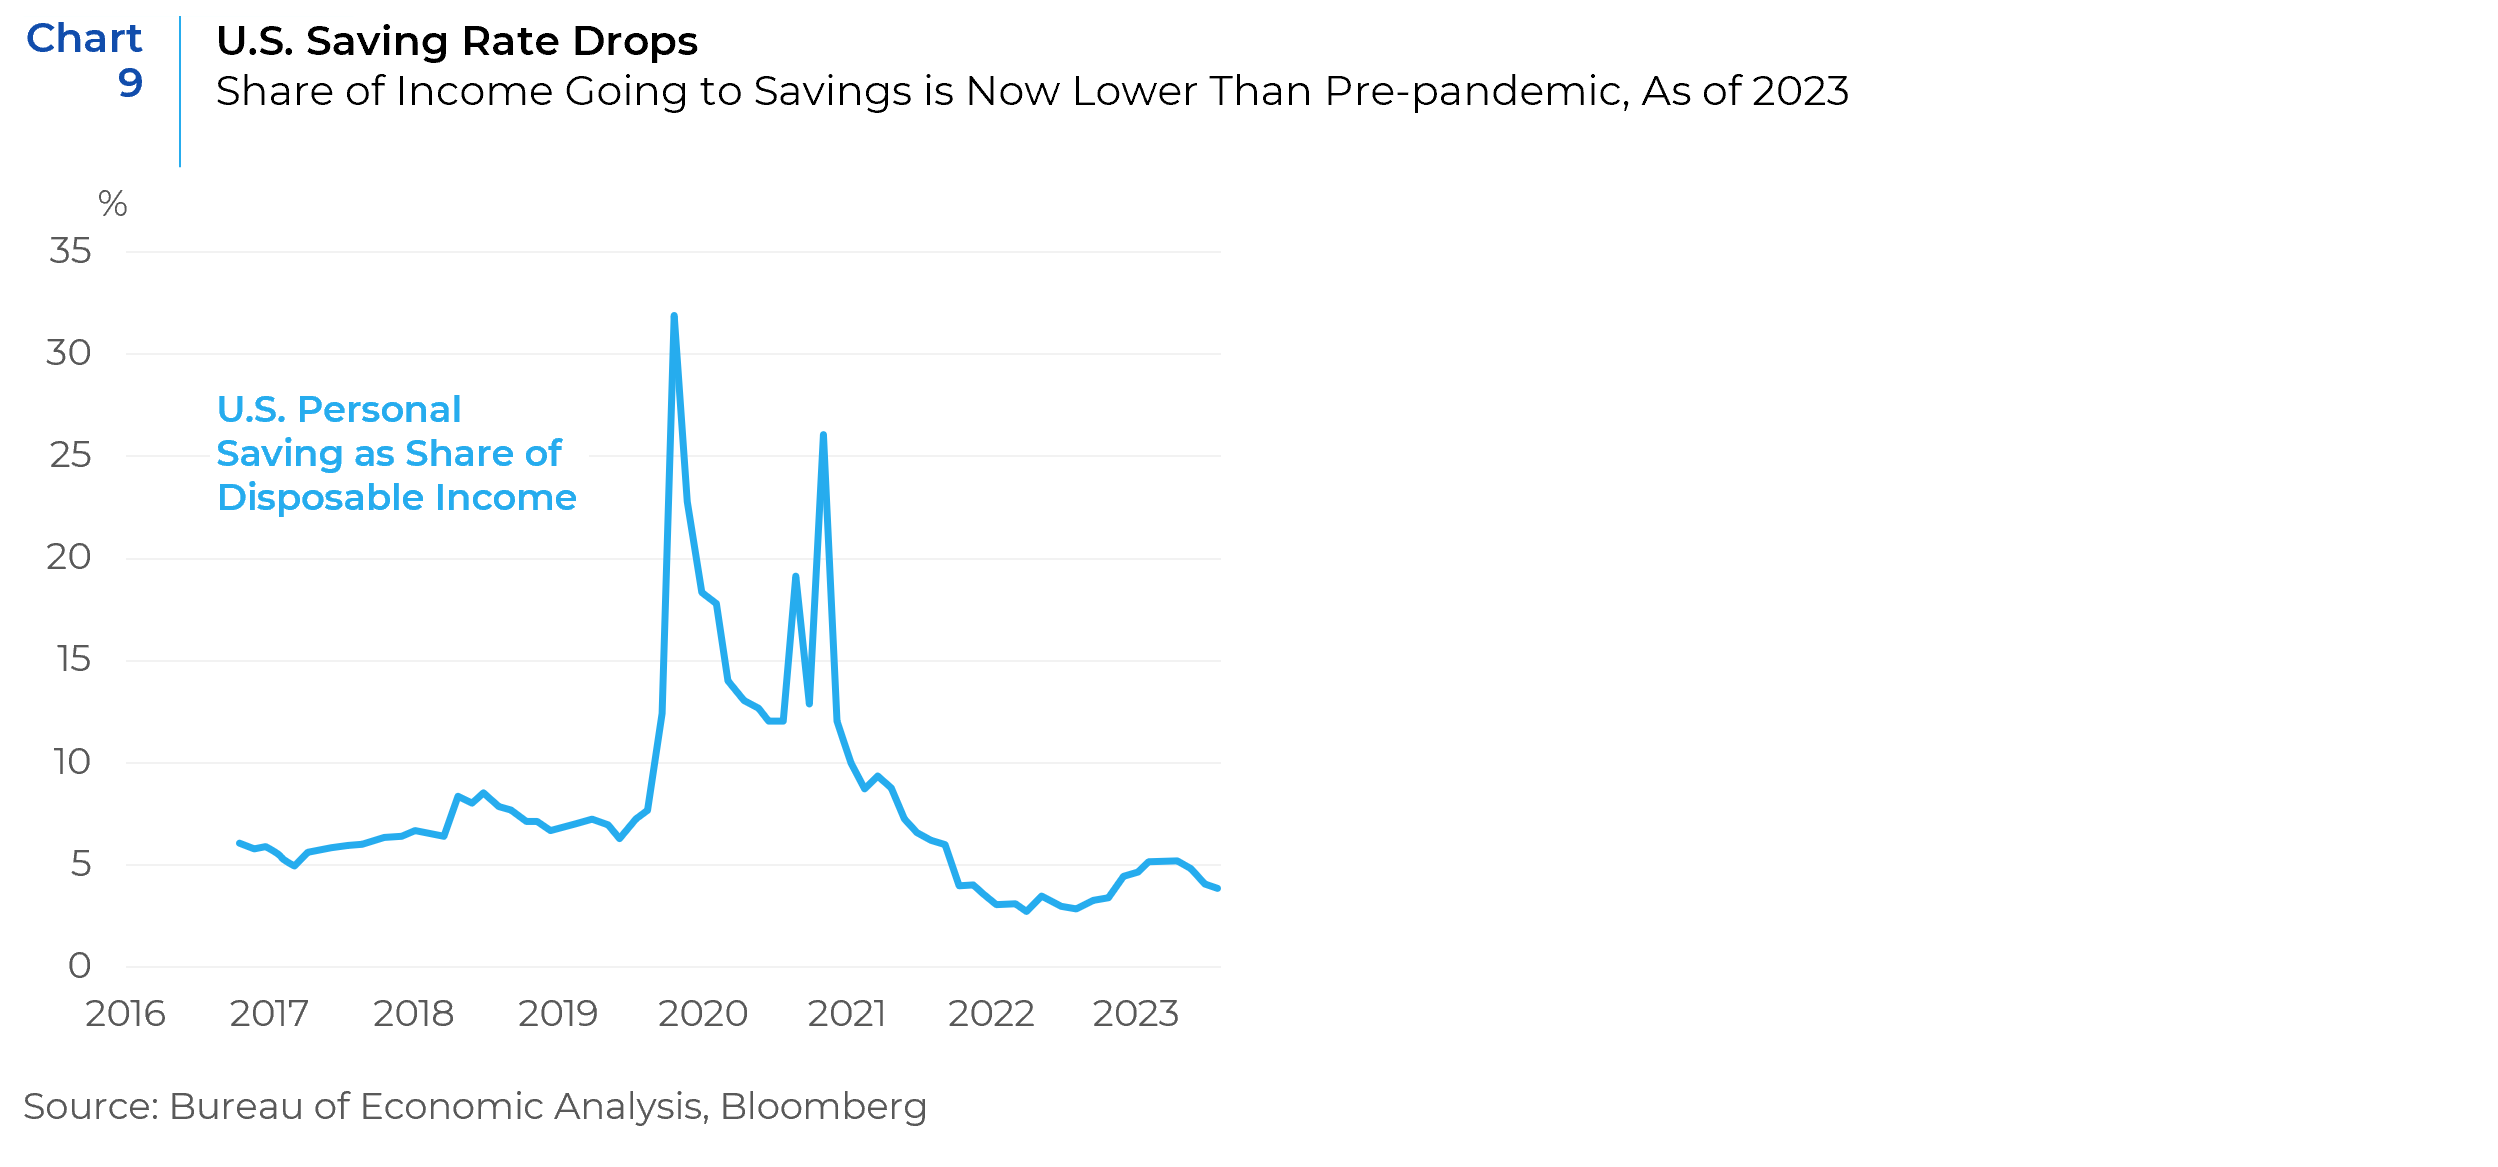
COVID-19 reshaped the financial landscape. The early phase of the pandemic saw a surge in household savings rates. Fiscal interventions, such as student loan deferrals and direct financial aids, cushioned consumers. With limited avenues for expenditure due to business closures, the savings rate shot up, peaking at 33% in April 2020. However, as opportunities to spend expanded with the economy’s reopening, there was a notable decline in savings. By August 2023, it had receded to 3.9%, which is below pre-pandemic levels. (Chart 9).
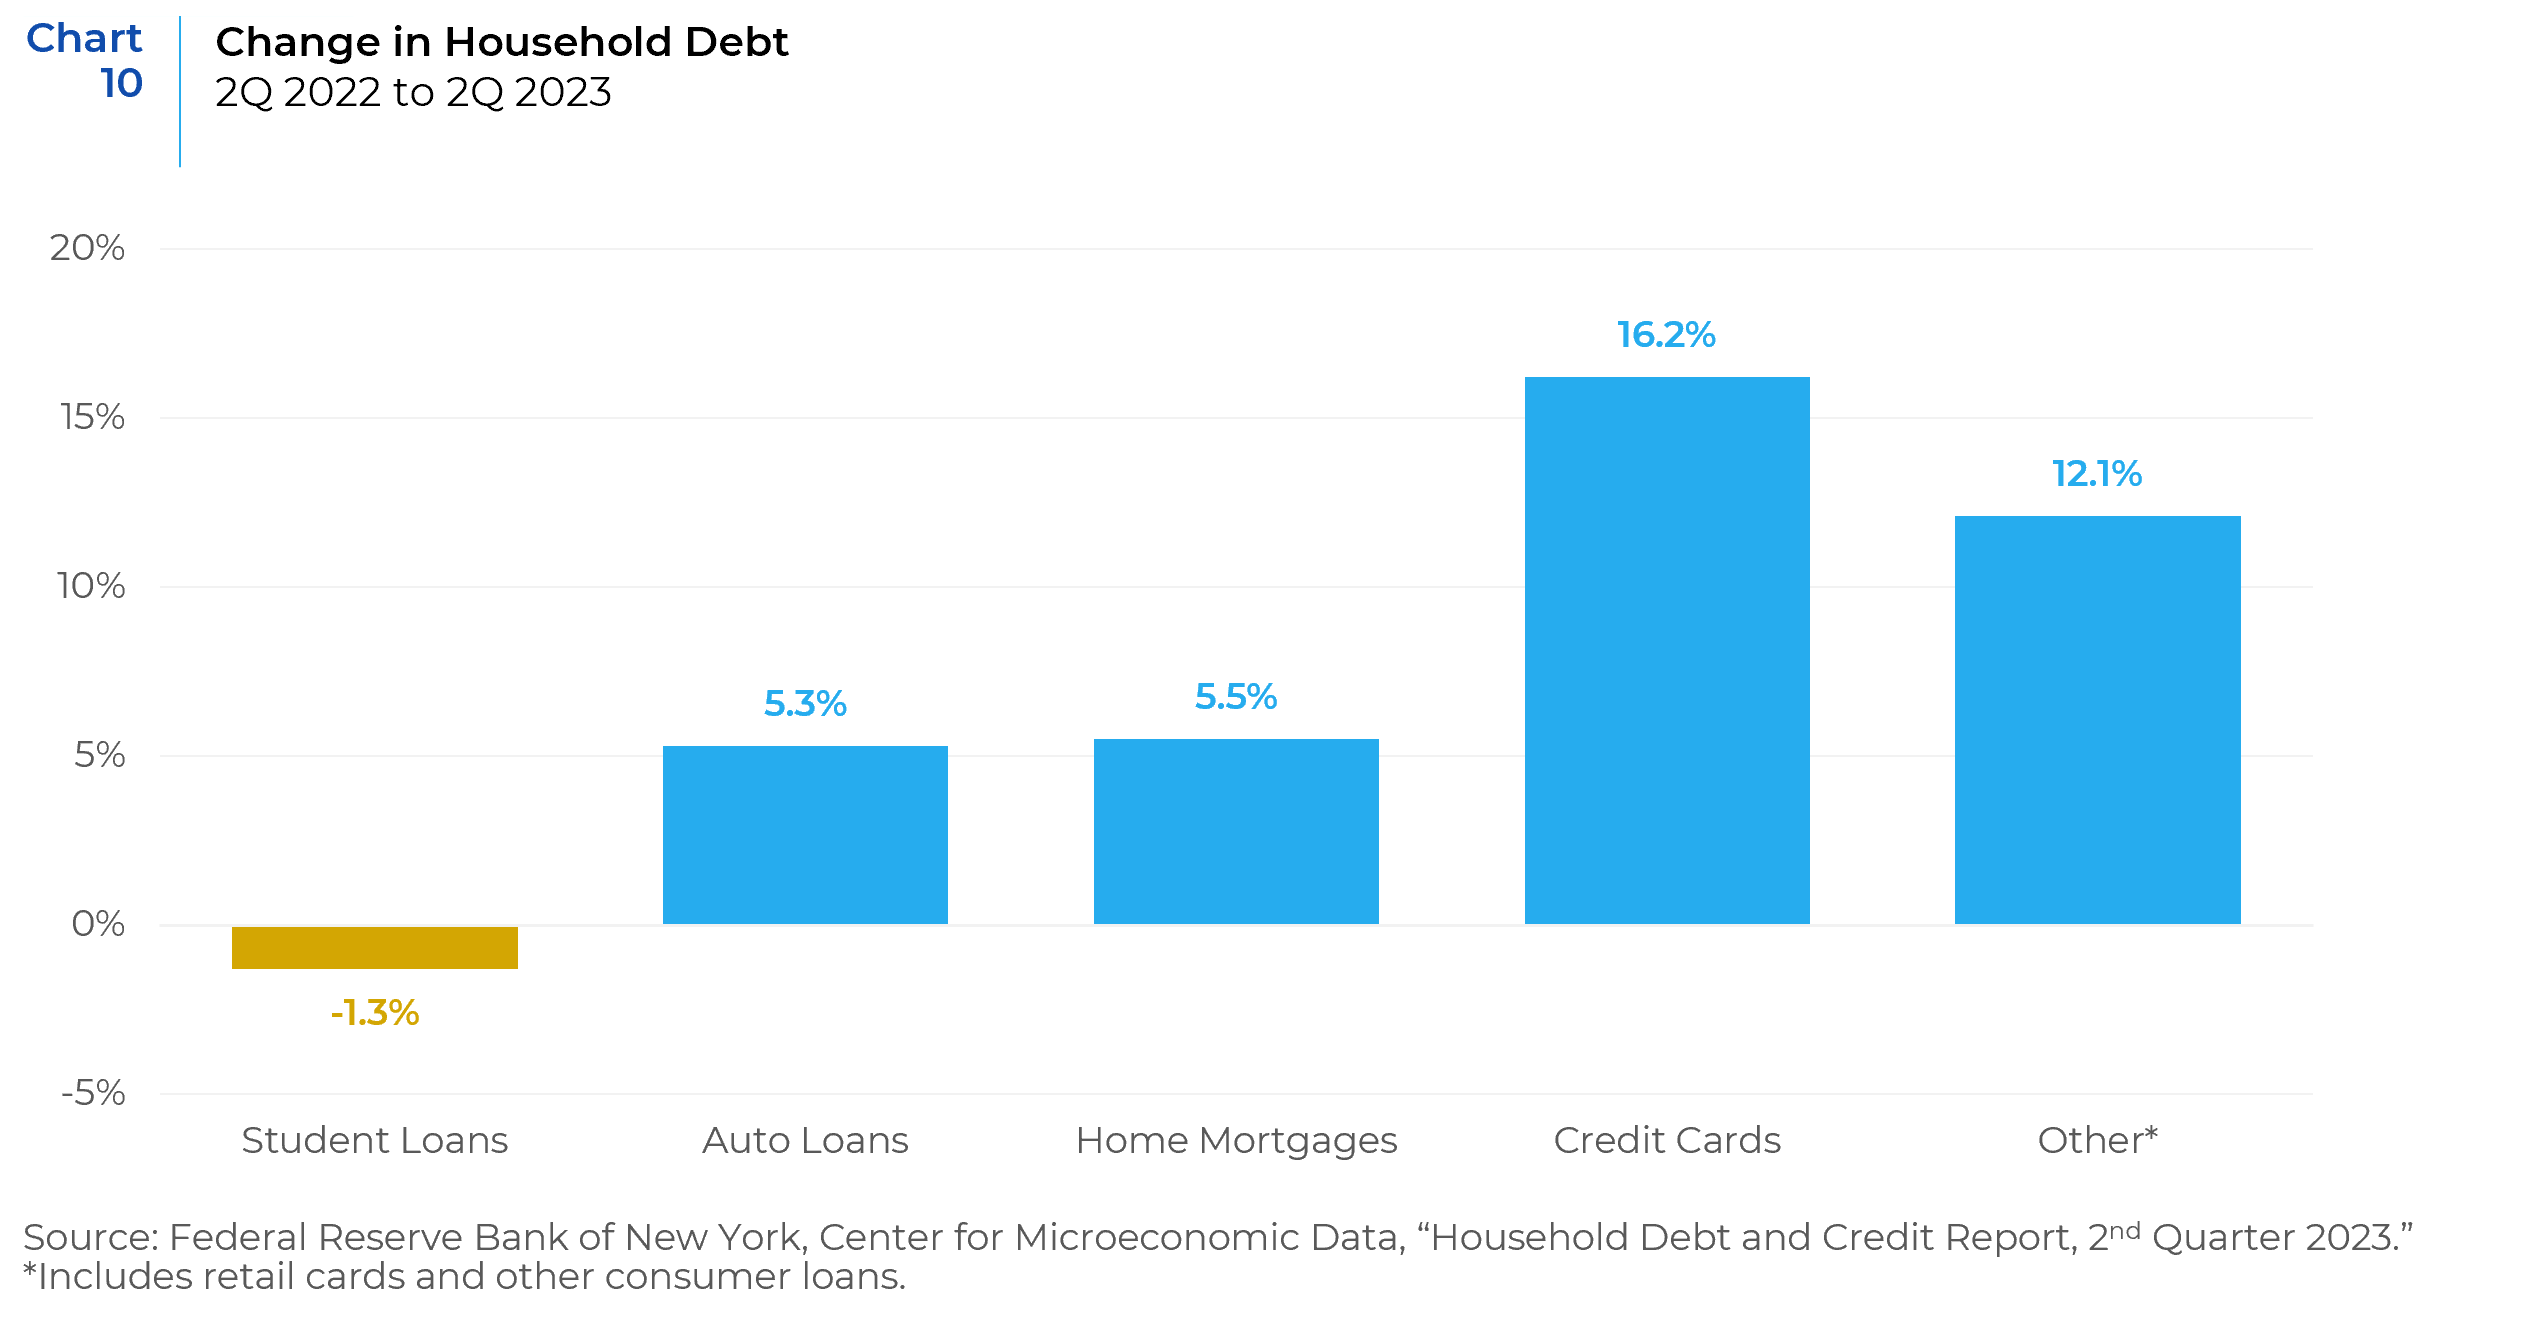
Although households have robust balances of over $1 trillion in hand, the savings rate has started showing signs of decline. Estimates suggest that more than half of the excess savings is held by households in the top l0% of the income bracket which implies that the average consumer’s savings are getting drawn down rapidly. A portion of this decline in savings can be attributed to the rise in inflation, which has made consumers part with a larger share of their income. They also dipped into their savings and relied heavily on credit. A combination of spiraling inflation and cessation of government payments set the stage for a significant uptick in consumer borrowing. In the second quarter of 2023, total household debt in the U.S. reached a record high of $17.06 trillion. This represents a 5.6% increase over the amount of debt held one year prior. Credit card debt also crossed the $1 trillion mark, representing a 16.2% increase year-over-year. As depicted in Chart 10, this escalation underscores the pressing issue: Are consumers inadvertently overleveraging themselves, setting the stage for potential economic turbulence?
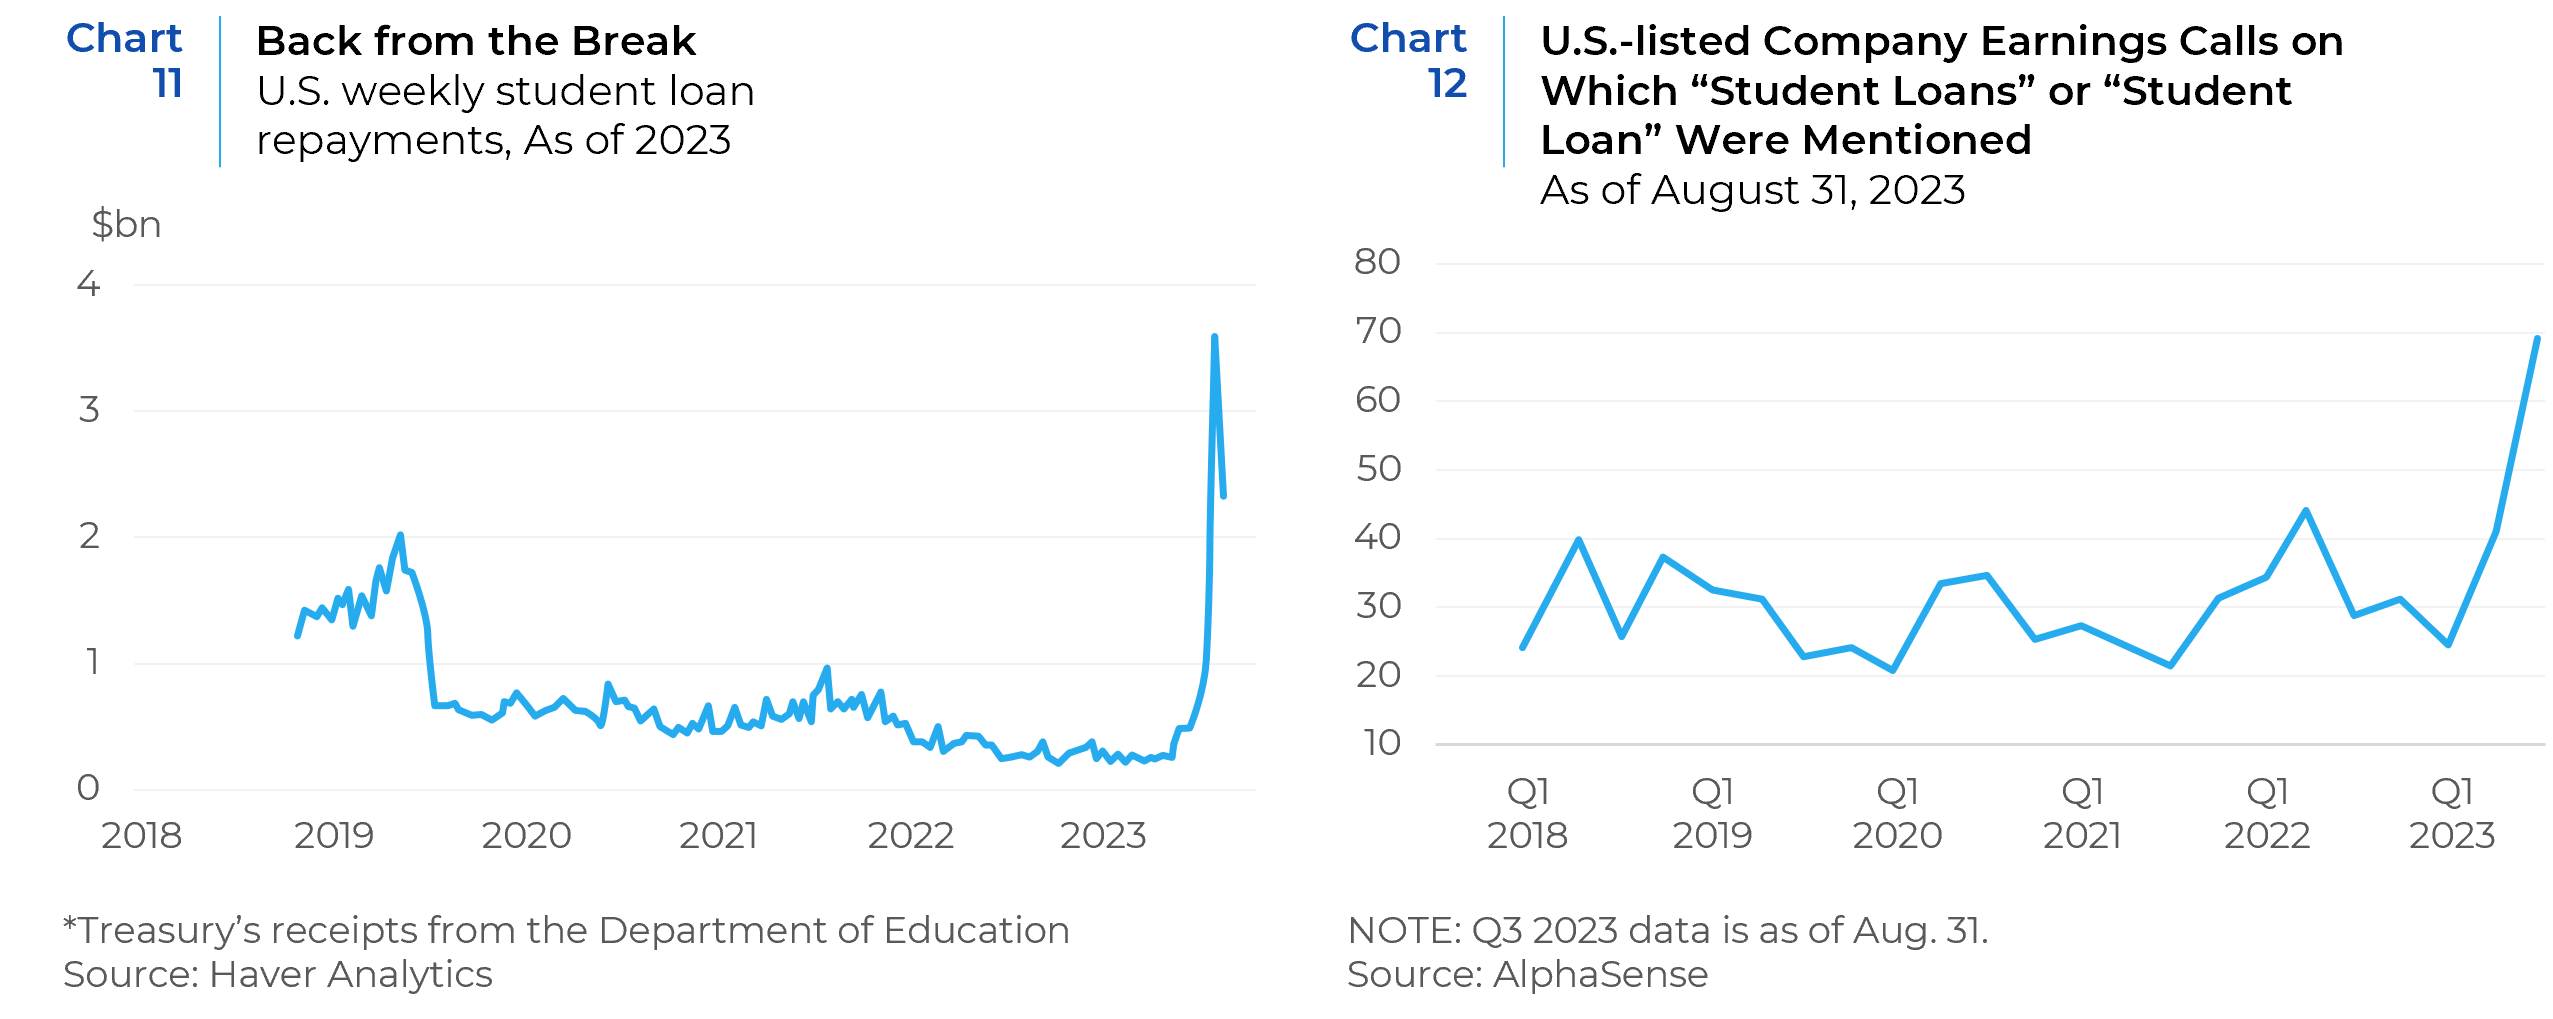
Borrowers of student loans have been sitting on $1.6 trillion of debt owed to the government as they have enjoyed a break from both repayments and interest since March 2020. The holiday is now over and repayments of interest on student loans resumed in October. Given that there are about 43 million borrowers, this may be a drag on the American economy (Chart 11). Across industries, executives are paying attention to how the resumption of student loan payments will impact consumer spending. Executives at U.S.-listed companies mentioned “student loans” on 70 earnings calls from July 1 through the end of August, up 268% from the same period last year, according to AlphaSense, a financial-research platform (Chart 12).
Financial services firm Jefferies is warning that “there could be a significant risk to consumer spending ahead,” because of the resumption of student loan payments. It recently surveyed about 630 consumers with student debt, finding that half of borrowers are “very concerned” about meeting all of their expenses. Around 70% of borrowers plan to postpone big-ticket purchases come October, its poll found. Meanwhile, many people with student debt plan to cut back their spending on clothing, travel, and food (Chart 13).
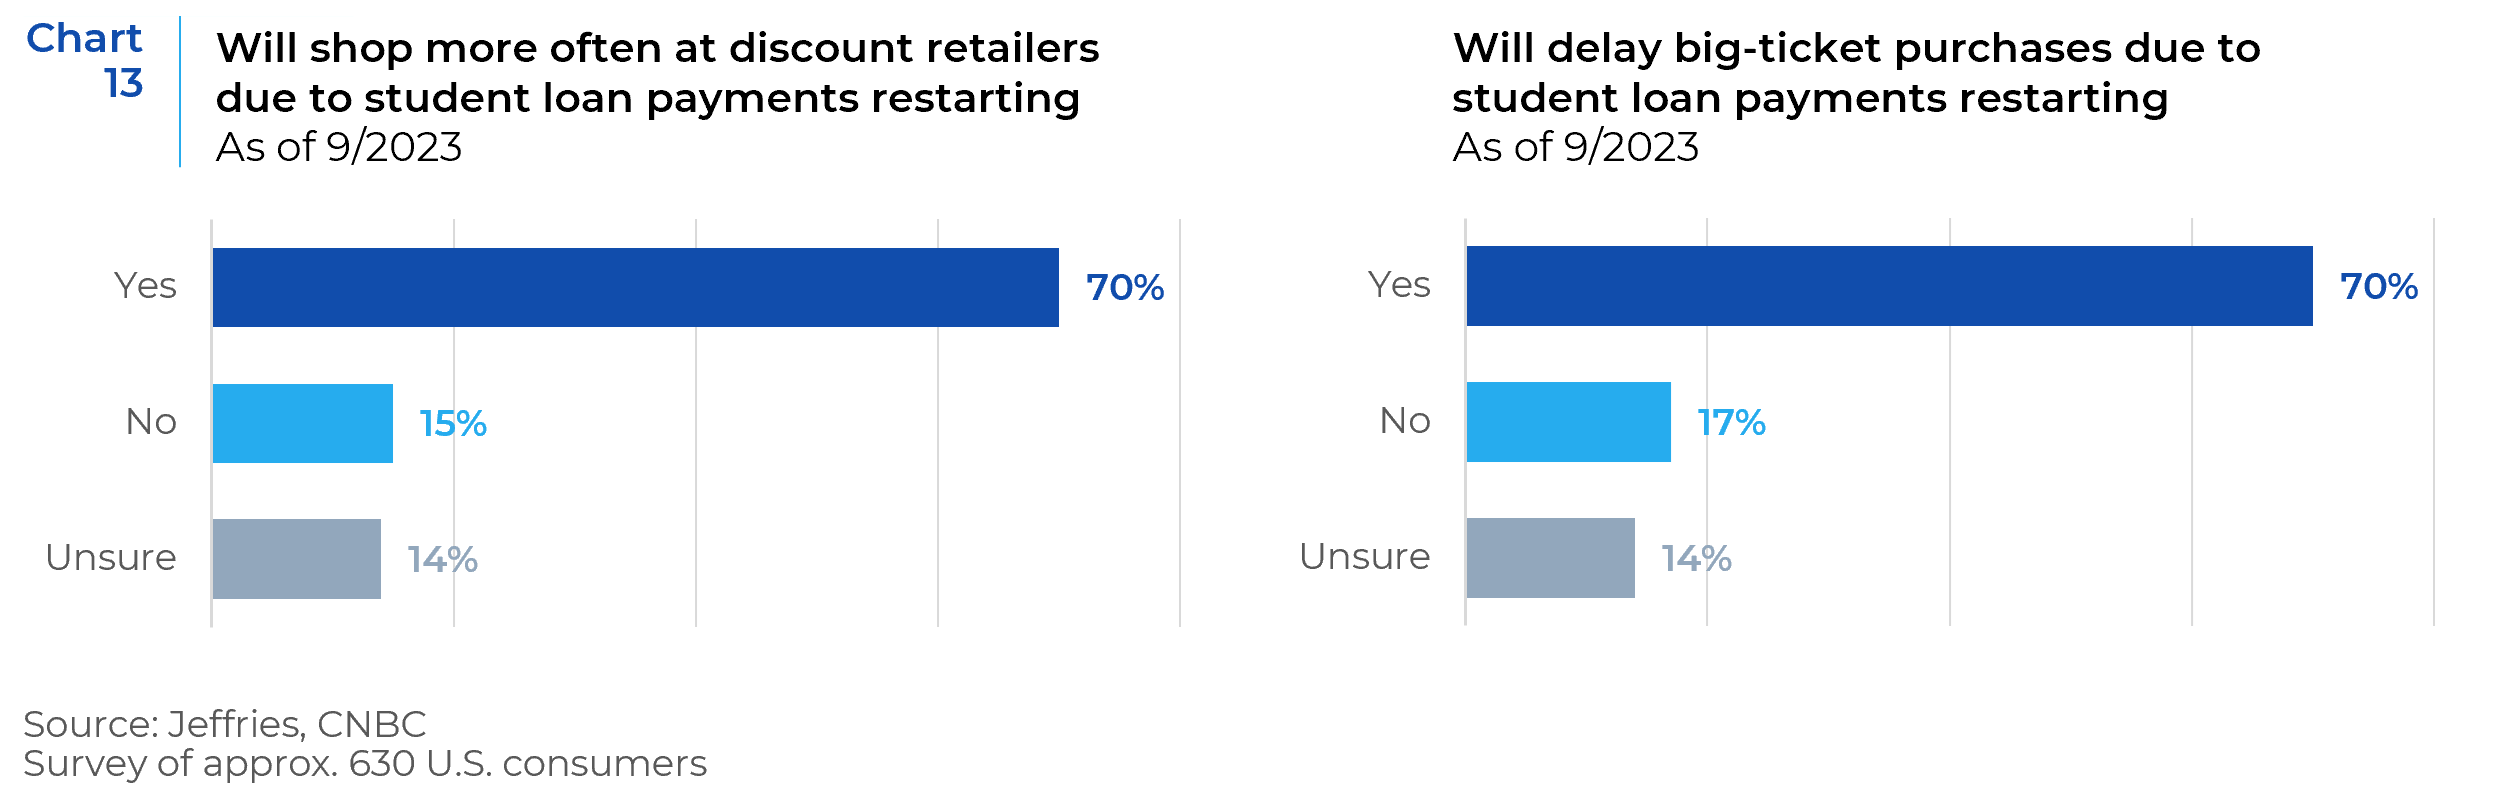
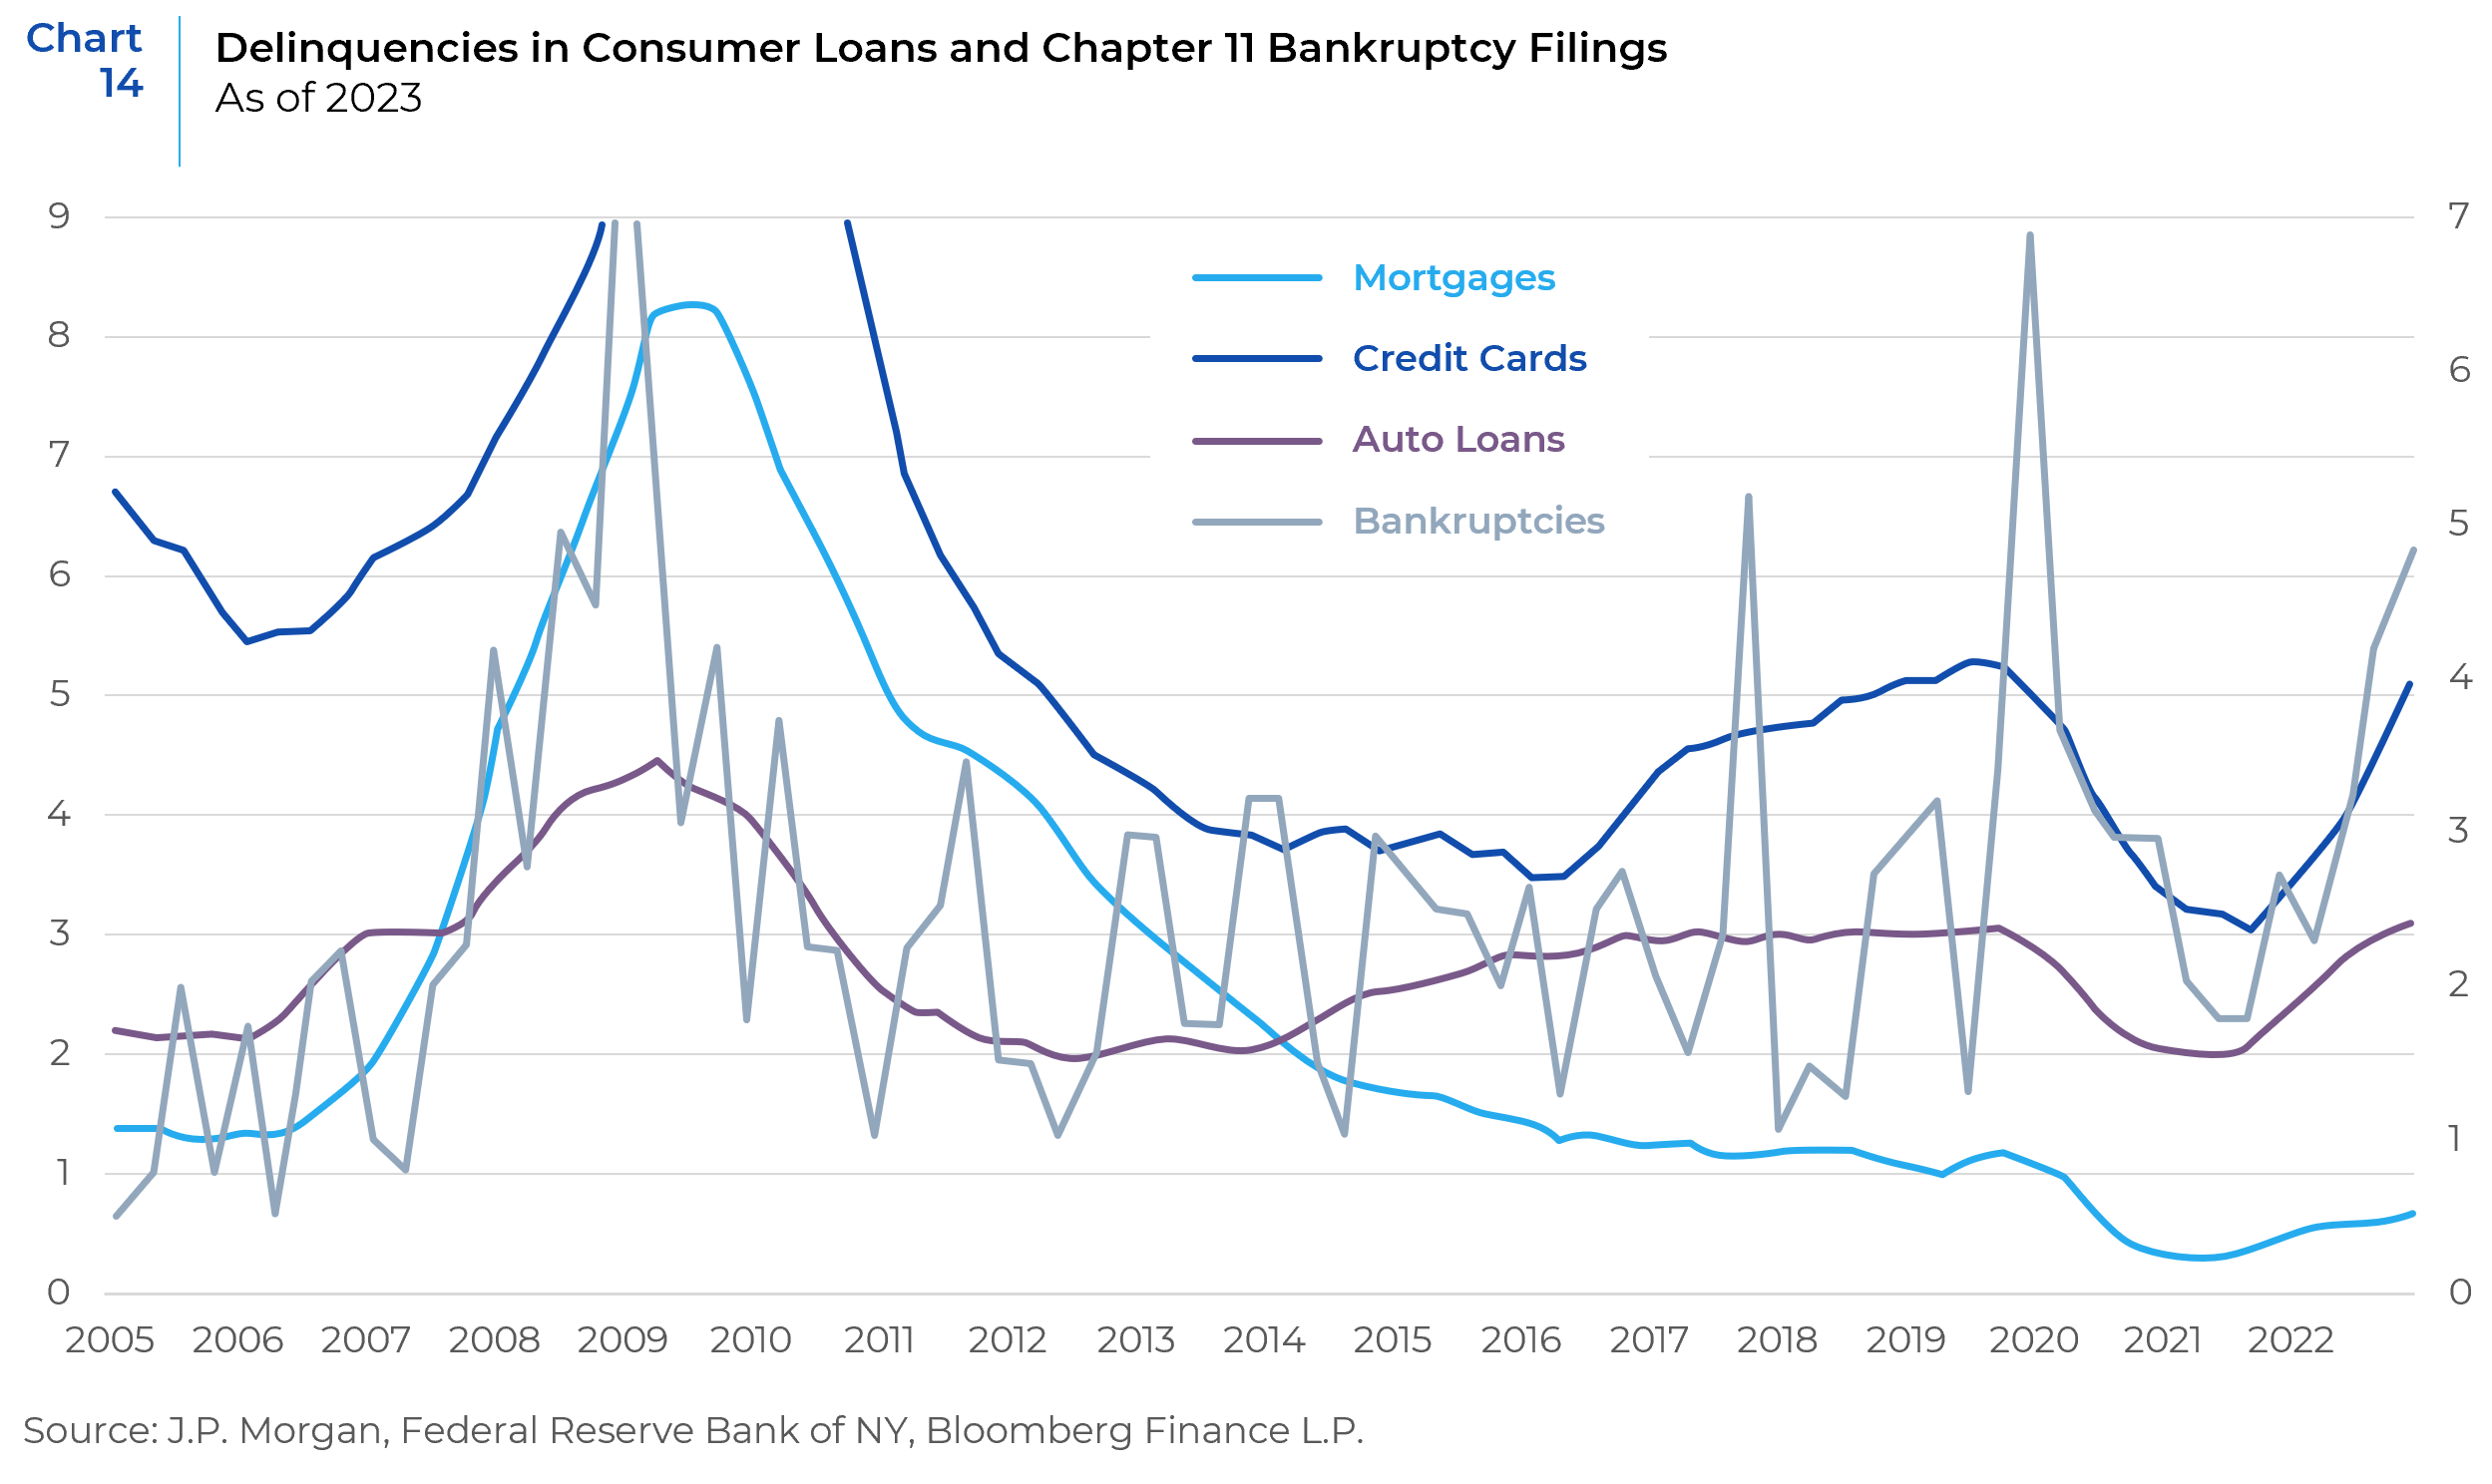
Chart 14 below shows delinquencies in credit cards, auto loans, and mortgages, as well as weekly Chapter 11 bankruptcy filings over the past 20 years. One can notice a clear trend in increase in credit card delinquencies, auto loans, and Chapter 11 filings. Mortgage delinquencies are still significantly lower compared to the pre-COVID period, as most homeowners are locked into low interest rates. The impact of high interest rates on consumers is clearly negative, and there is nothing to reverse this trend unless interest rates are cut. In addition, interest rate increases are disproportionately impacting small business (e.g., startups, private companies, small caps) and commercial real estate.
The Federal Reserve’s actions to hike interest rates have been instrumental in curbing inflation. However, the sustained period of high inflation has undeniably burdened consumers. Rising prices and steeper lending rates to declining savings and unaffordable loan schemes has dampened consumer confidence. The cushion of excess savings, which many had accumulated during the pandemic, is now depleting rapidly. Another wave of financial pressure comes with the reinstatement of student loan payments following their temporary suspension. This not only redirects potential consumer spending but also contributes to rising debt burdens. The recent collapse of some regional banks has led to a domino effect where lenders have become increasingly cautious, tightening their loan criteria. This stringent lending environment has caused a spike in overall credit rejection rates, with particular segments like auto loans, mortgages, and credit card limit increases hitting unprecedented highs. These credit restrictions are expected to persist especially as the Fed keeps rates higher longer. If this unfavorable environment continues to prolong for a while, consumers may exercise restraint in spending, and create headwinds for the economy.
References: Bloomberg, FactSet, FTSE Russell, BCA Research, Alpine Macro, Charles Schwab, Barclays Research
This report is neither an offer to sell nor a solicitation to invest in any product offered by Xponance® and should not be considered as investment advice. This report was prepared for clients and prospective clients of Xponance® and is intended to be used solely by such clients and prospects for educational and illustrative purposes. The information contained herein is proprietary to Xponance® and may not be duplicated or used for any purpose other than the educational purpose for which it has been provided. Any unauthorized use, duplication or disclosure of this report is strictly prohibited.
This report is based on information believed to be correct but is subject to revision. Although the information provided herein has been obtained from sources which Xponance® believes to be reliable, Xponance® does not guarantee its accuracy, and such information may be incomplete or condensed. Additional information is available from Xponance® upon request. All performance and other projections are historical and do not guarantee future performance. No assurance can be given that any particular investment objective or strategy will be achieved at a given time and actual investment results may vary over any given time.