
The third quarter of 2020 saw equity markets post strong gains, capping the best two-quarter performance since 2009. Despite a spike in coronavirus cases in June and July, there has been a slow but steady recovery in economic activity. This has spurred broad-based gains in the equity markets. For the quarter as a whole, large cap stocks continued their dominance over their mid and small cap brethren. Growth beat value across the cap spectrum. Ten out of the 11 GICS sectors in the S&P 500 posted positive returns, while Energy was down almost 20% for the three-month period. While Consumer Discretionary was the best performing sector in the index, some cyclical stocks in the Materials and Industrials sectors started to garner interest from investors.
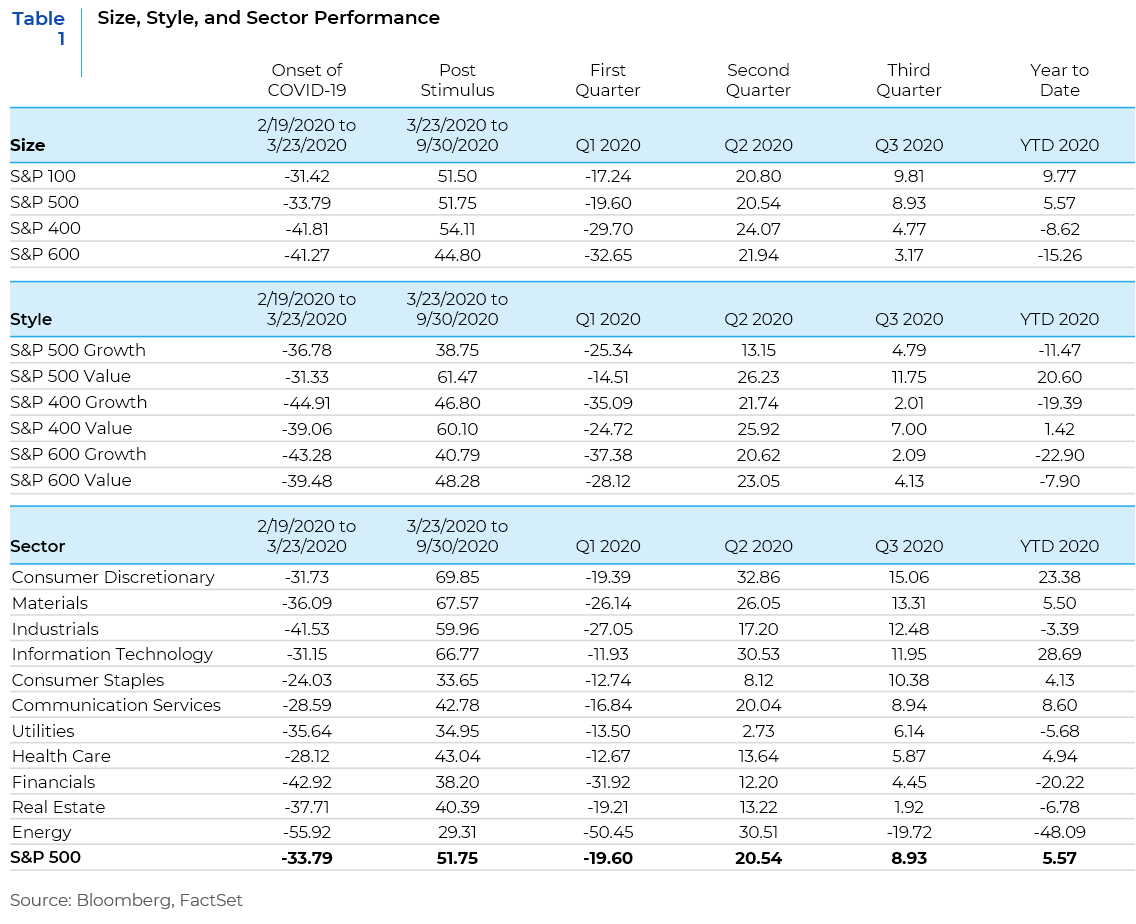
However, markets did not behave the same way in all three months of the quarter.
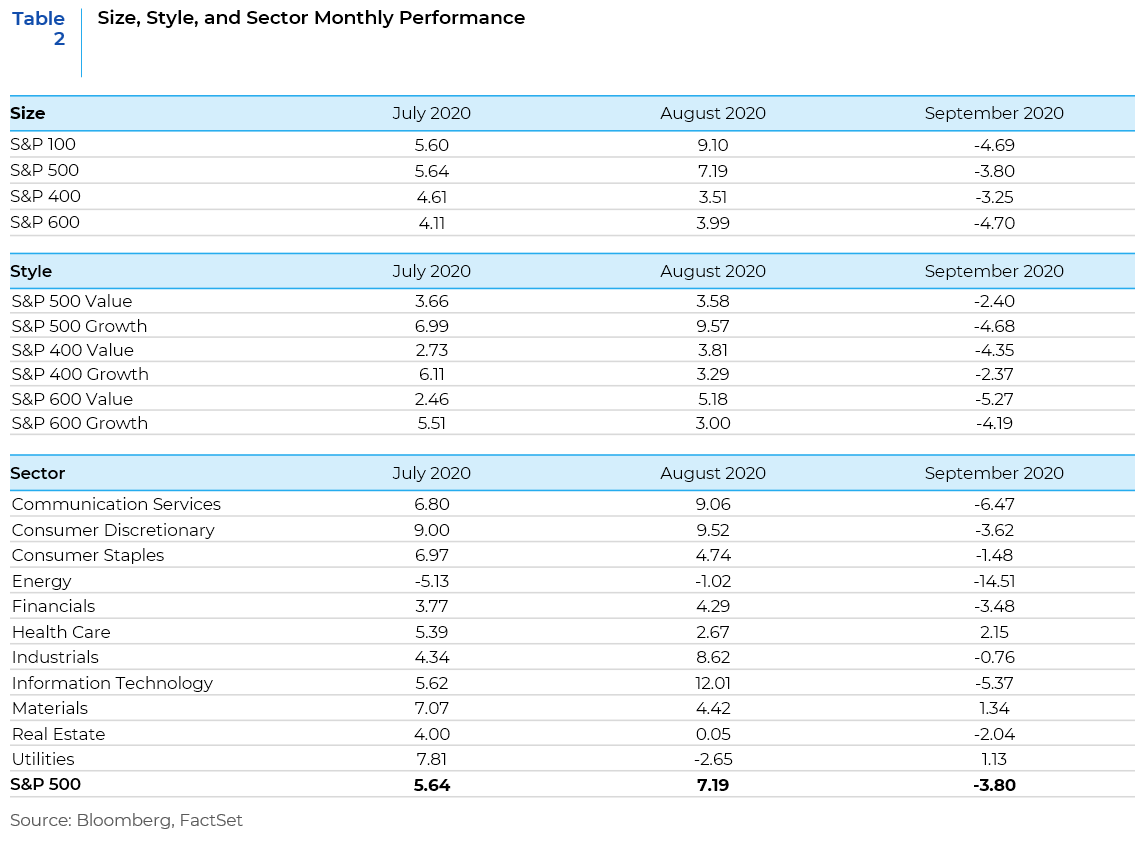
- The month of July saw large cap names, primarily in the growth space, continue to outperform. However, there was a subtle change in trends with Consumer Discretionary as the best performing sector followed by Utilities and Materials. The Information Technology sector, which was the leading sector for the past two months, matched the returns of the index.
- August saw the trends that dominated during the pandemic come roaring back with the dominance of large cap names in the Information Technology, Communication Services, and Consumer Discretionary sectors. It appeared that consumers were spooked by the rising numbers of coronavirus cases and had reverted back to the pandemic-proof names. This year saw the best August performance in 34 years.
- Volatility returned in September and there was a reversal in the performance of the index with all but three sectors (Health Care, Materials, and Utilities) posting losses for the month. Large cap growth names experienced a sell-off and after a long time, the value style came back in favor. Energy, Communications, and Information Technology were the laggards. Energy continues to face secular headwinds while the latter two were pulled back from extreme overbought situations.
Where will the economy and markets go from here? As always, the answer is subject to many considerations.
The Improvements
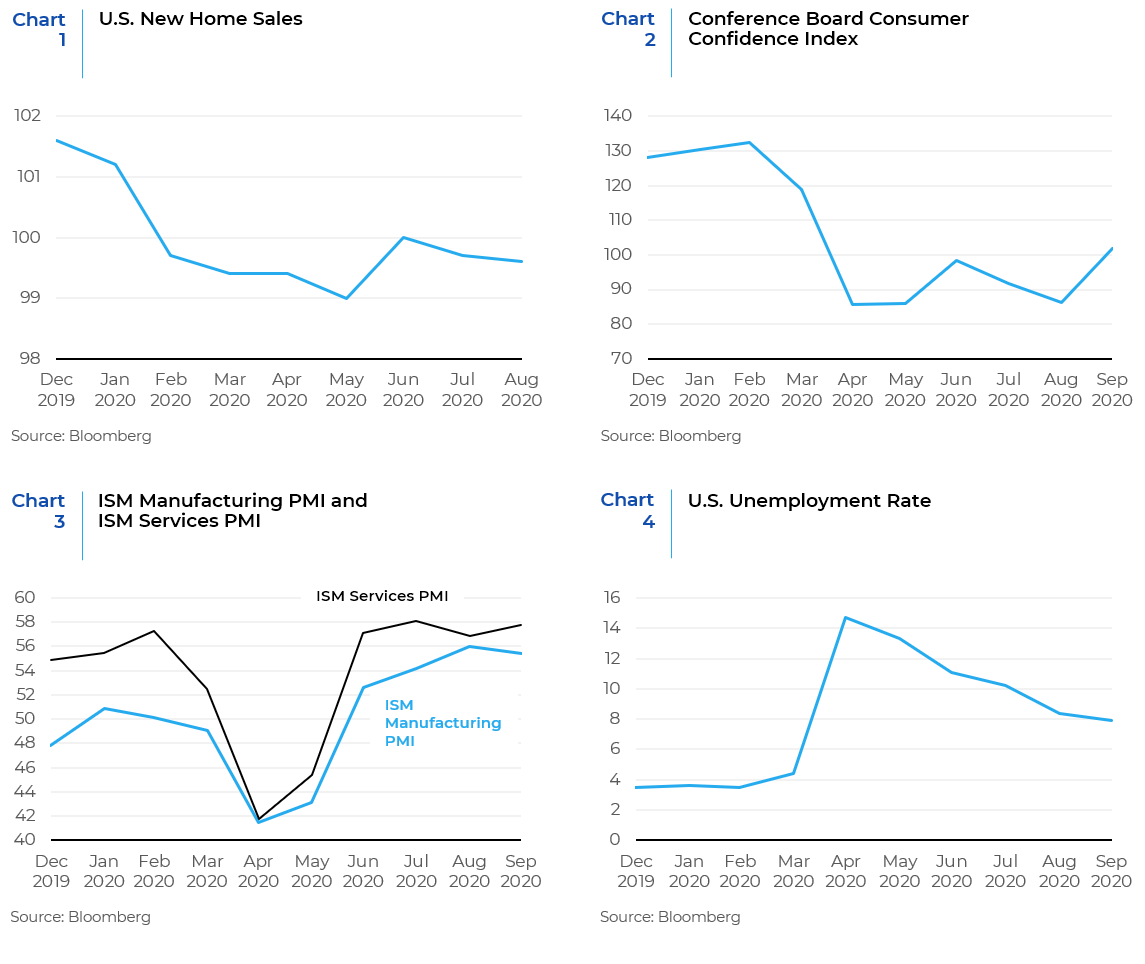
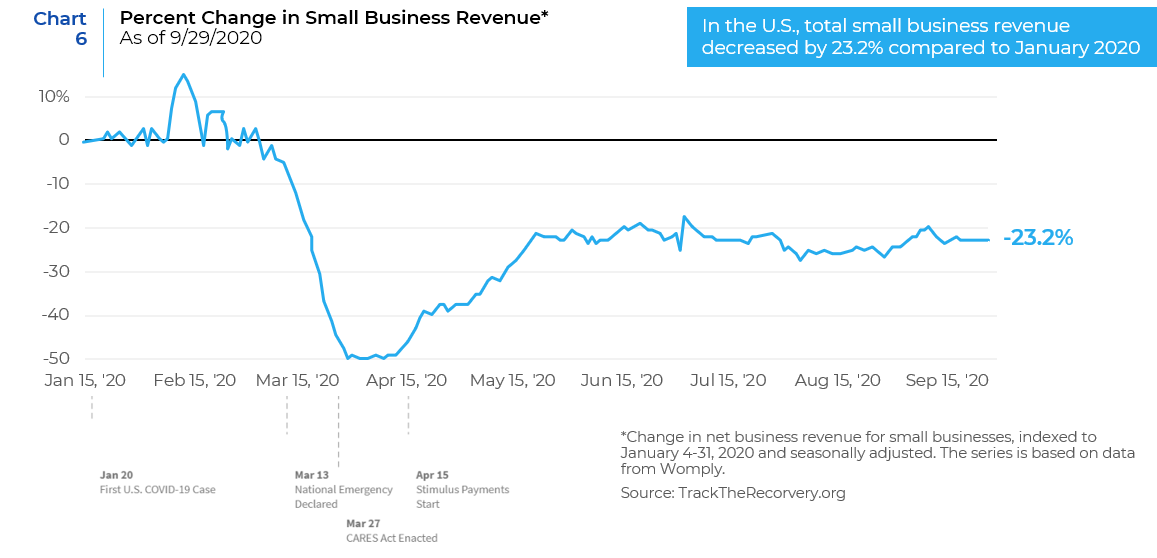
As the charts shown highlight, amidst the market volatility and uncertainties, there continues to be a slow but steady recovery in economic activity from the sharp declines in the second quarter. New home sales (Chart 1) climbed to the highest level in nearly 14 years. Following two straight months of declines, consumer confidence (Chart 2) rebounded to 101.8 in September. This was far above both the 86.3 reading in August, and the consensus estimate of 90. The rebound was the largest increase in 17 years. Both Manufacturing and Services PMI numbers (Chart 3) have shown marked improvement and the unemployment rate (Chart 4) has dropped by almost 6%.
The Risks
While economic activity has been improving, there are still a number of potential risks that can cause upheaval in the markets in the coming quarter. The outcome of the Presidential elections may be a big source of economic and social volatility. The latest polls show the lead of former Vice President Biden increasing over President Trump. However, due in part, to the increased use of mail-in ballots, it is possible that a winner may not be announced on November 3. Therefore, the probability of increased equity market volatility leading up to and in the week or so following election day is high.
Uncertainty remains about the timing and public acceptance of a Covid-19 vaccine which in turn raises doubts about the economy’s future growth prospects. The U.S. is entering flu season while the country is still grappling with the coronavirus pandemic. Public officials are concerned about rising coronavirus and flu infections at the same time overwhelming hospital beds and emergency services.
Congress has not been able to get its act together on approving another stimulus package and estimates for fourth-quarter GDP growth are falling given the lack of a near-term relief package. The withdrawal of stimulus programs will put the brakes on consumer spending through the end of 2020.
Q3 earnings season is fast approaching and corporate guidance is limited. According to Factset, just 53 of the S&P 500 companies issued quarterly guidance in Q2, which was the lowest number on record since 2006. Q3 is not much better with just 67 S&P 500 companies issuing guidance, which is 36% below the five-year average of 104. However, even with a lower percentage of companies providing guidance, investors are expecting a large number of outsized positive EPS surprises versus estimates, as was the case in Q2.
The Disconnect
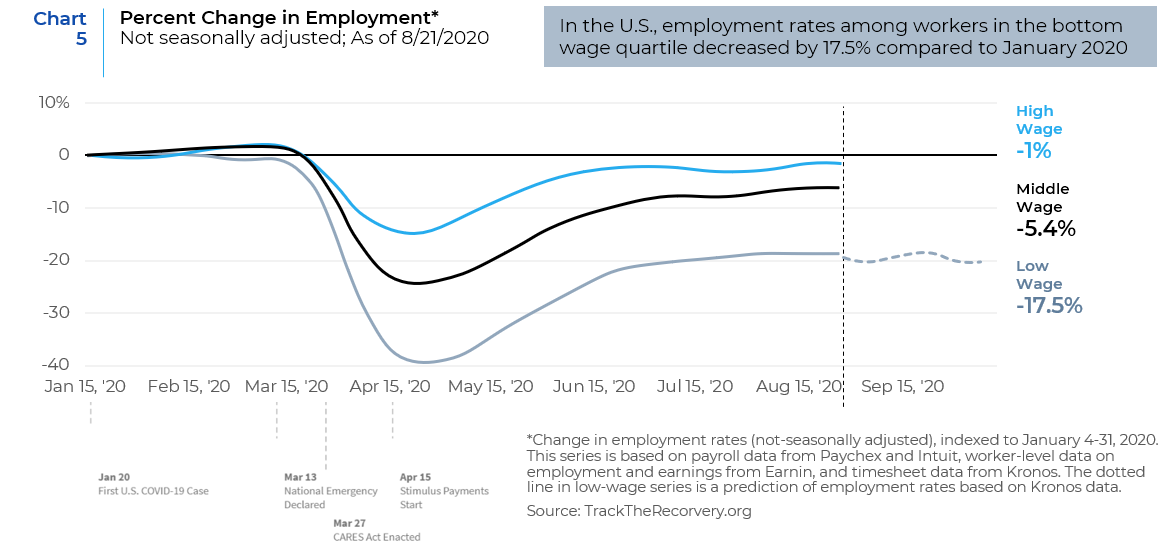
Despite these unsettling factors, stocks have shown remarkable resilience. Why are stock markets soaring when the real economy remains so fragile? There seems to be two primary reasons for this. First, investors appear to be confident in the willingness of the US Federal Reserve to inject liquidity at the first sign of serious market stress and act as a backstop. The backing of private bond markets has been an unprecedented intervention by the US Federal Reserve. This building of a wedge between market valuations and economic fundamentals may be jeopardizing the credibility of the Fed, amplifying existing wealth inequalities, and creating future financial instability. Second, it also appears that investors are regarding most of the current challenges in the marketplace as temporary and reversible. The assumption is that US election uncertainties will be resolved quickly; fiscal and structural reform efforts will be restarted, and progress toward new COVID-19 treatments and vaccines will continue to accelerate. Whether these assumptions play out in the future or not is yet to be seen. While stocks keep trending up, the economic pain inflicted by COVID-19 is primarily impacting small businesses and low-income service workers. They are essential for the real economy, but don’t mean much for equity markets. These smaller players do not have the capital needed to survive a shock of the length and magnitude that we are experiencing. Government programs that have helped keep these businesses and individuals afloat for a while are beginning to lapse, raising the risk of a snowball effect in the event of a second wave. Further exacerbating the unequal impact of the pandemic, government tax revenues have not fallen by much because job losses have been concentrated among low-income individuals who pay less in taxes.
This disconnect between the real economy and equity markets can be viewed through the two shapes that the macroeconomy and microeconomy are taking. The macroeconomy is the big-picture, top-down look, focused on measures like gross domestic product, aggregate incomes, demand, and supply. Viewed through that lens, the economy seems to be in a V-shaped recovery, with the sharp decline of March and April followed by the sharp rebound of the next two quarters. The microeconomy, on the other hand, looks at individual businesses, workers, and consumers. That bottom-up view of the economy is a mixed bag. Some businesses and occupations are doing well, while others are not. Unemployment in some occupations is high and businesses are failing. Renters are struggling, and landlords are hurting. But the stock market is on fire, and so is the housing market. A K-shape describes this bifurcated economy, with one stroke of the K reaching for the sky while the other on a downward trend. So, the macroeconomy doesn’t need further fiscal stimulus, but the microeconomy does.
As the final quarter of the year commences, an appraisal of 2020 leaves one wishing that this year had never happened. The future will be dependent on the ability of governments to successfully meet the objectives of this pandemic era – maintaining public health and protecting citizens while avoiding further damage to the social fabric, economic welfare, and financial viability of the businesses that constitute the economy.
Source: BCA Research, Bloomberg, Factset, www.project-syndicate.org
This report is neither an offer to sell nor a solicitation to invest in any product offered by Xponance® and should not be considered as investment advice. This report was prepared for clients and prospective clients of Xponance® and is intended to be used solely by such clients and prospects for educational and illustrative purposes. The information contained herein is proprietary to Xponance® and may not be duplicated or used for any purpose other than the educational purpose for which it has been provided. Any unauthorized use, duplication or disclosure of this report is strictly prohibited.
This report is based on information believed to be correct, but is subject to revision. Although the information provided herein has been obtained from sources which Xponance® believes to be reliable, Xponance® does not guarantee its accuracy, and such information may be incomplete or condensed. Additional information is available from Xponance® upon request. All performance and other projections are historical and do not guarantee future performance. No assurance can be given that any particular investment objective or strategy will be achieved at a given time and actual investment results may vary over any given time.