
- This post builds on the analysis of the 2022 rebalance, examining the S&P 500 Value Index’s December 15, 2023 rebalance to assess trends and methodologies.
- The 2023 turnover rate for the S&P 500 Value index was 31.4%, slightly below 2022’s 33.0% but well above the 10-year 23.7% average, indicating continued increased trading activity.
- The apparent dominance of the 12-month momentum factor in index changes raises questions about its impact on changes within the style indexes over traditional value and growth factors.
- High turnover and major sector and risk factor exposure shifts can impact both passive and active strategies, potentially increasing costs and requiring careful risk management.
The purpose of this report is to consider the latest changes in the S&P 500 Value index that occurred during the 2023 annual rebalance versus those that we highlighted from 2022 in our Insights report “Decoding the Shifting Landscape of the S&P 500 Value Index: Unveiling Insights from changes in Active Risk Exposures, Sectors, and Companies During the Annual Style Rebalance,” published on June 8, 2023.
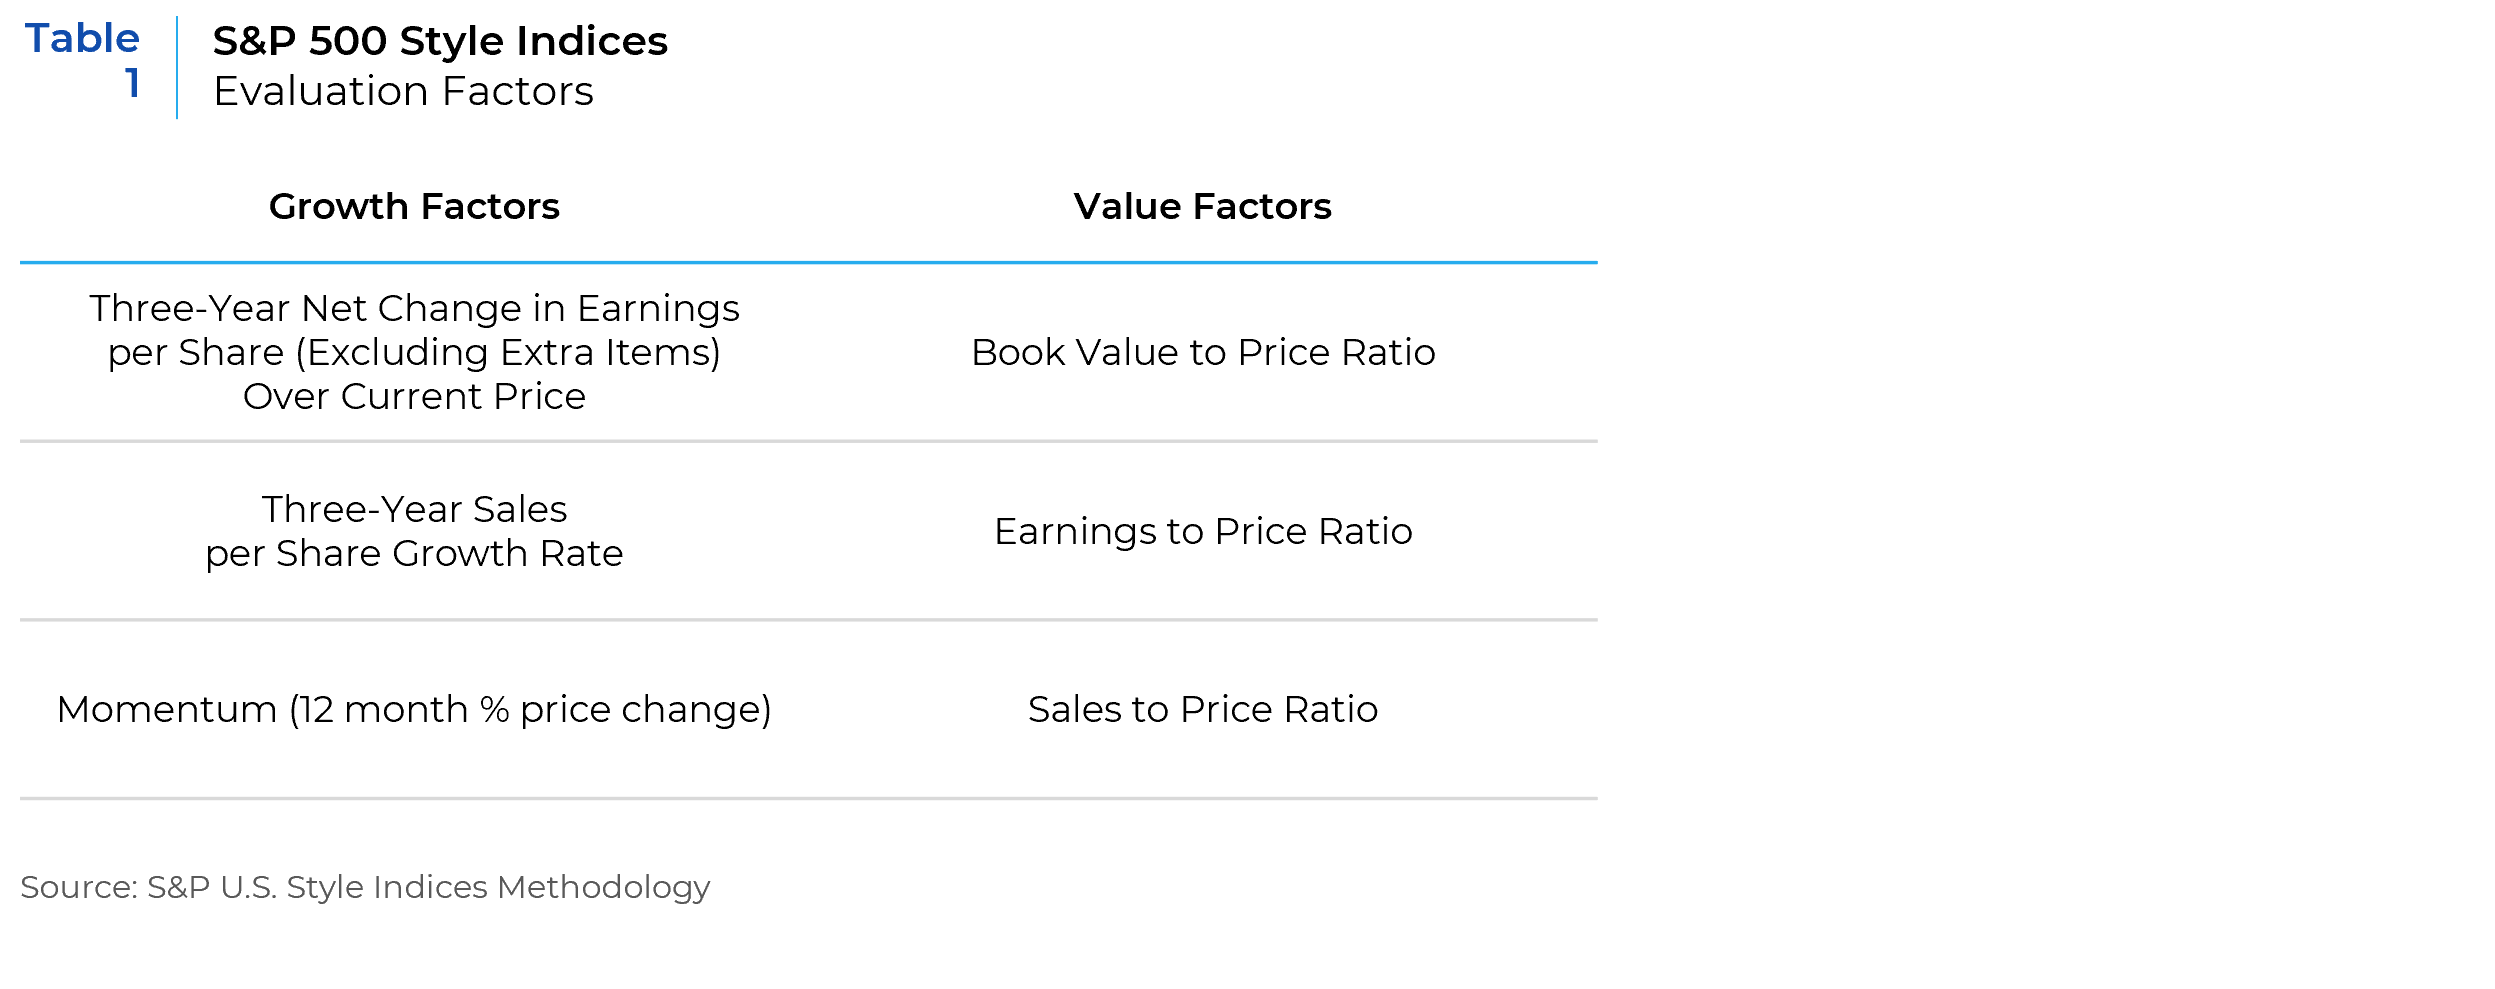
The S&P Style indices employ three distinct factors to evaluate a company’s exposure to growth and value. These factors are presented in the table provided below.
The following chart shows the ten-year turnover levels of the S&P 500 Value index during the annual style rebalance that occurs in December (see Chart 1).
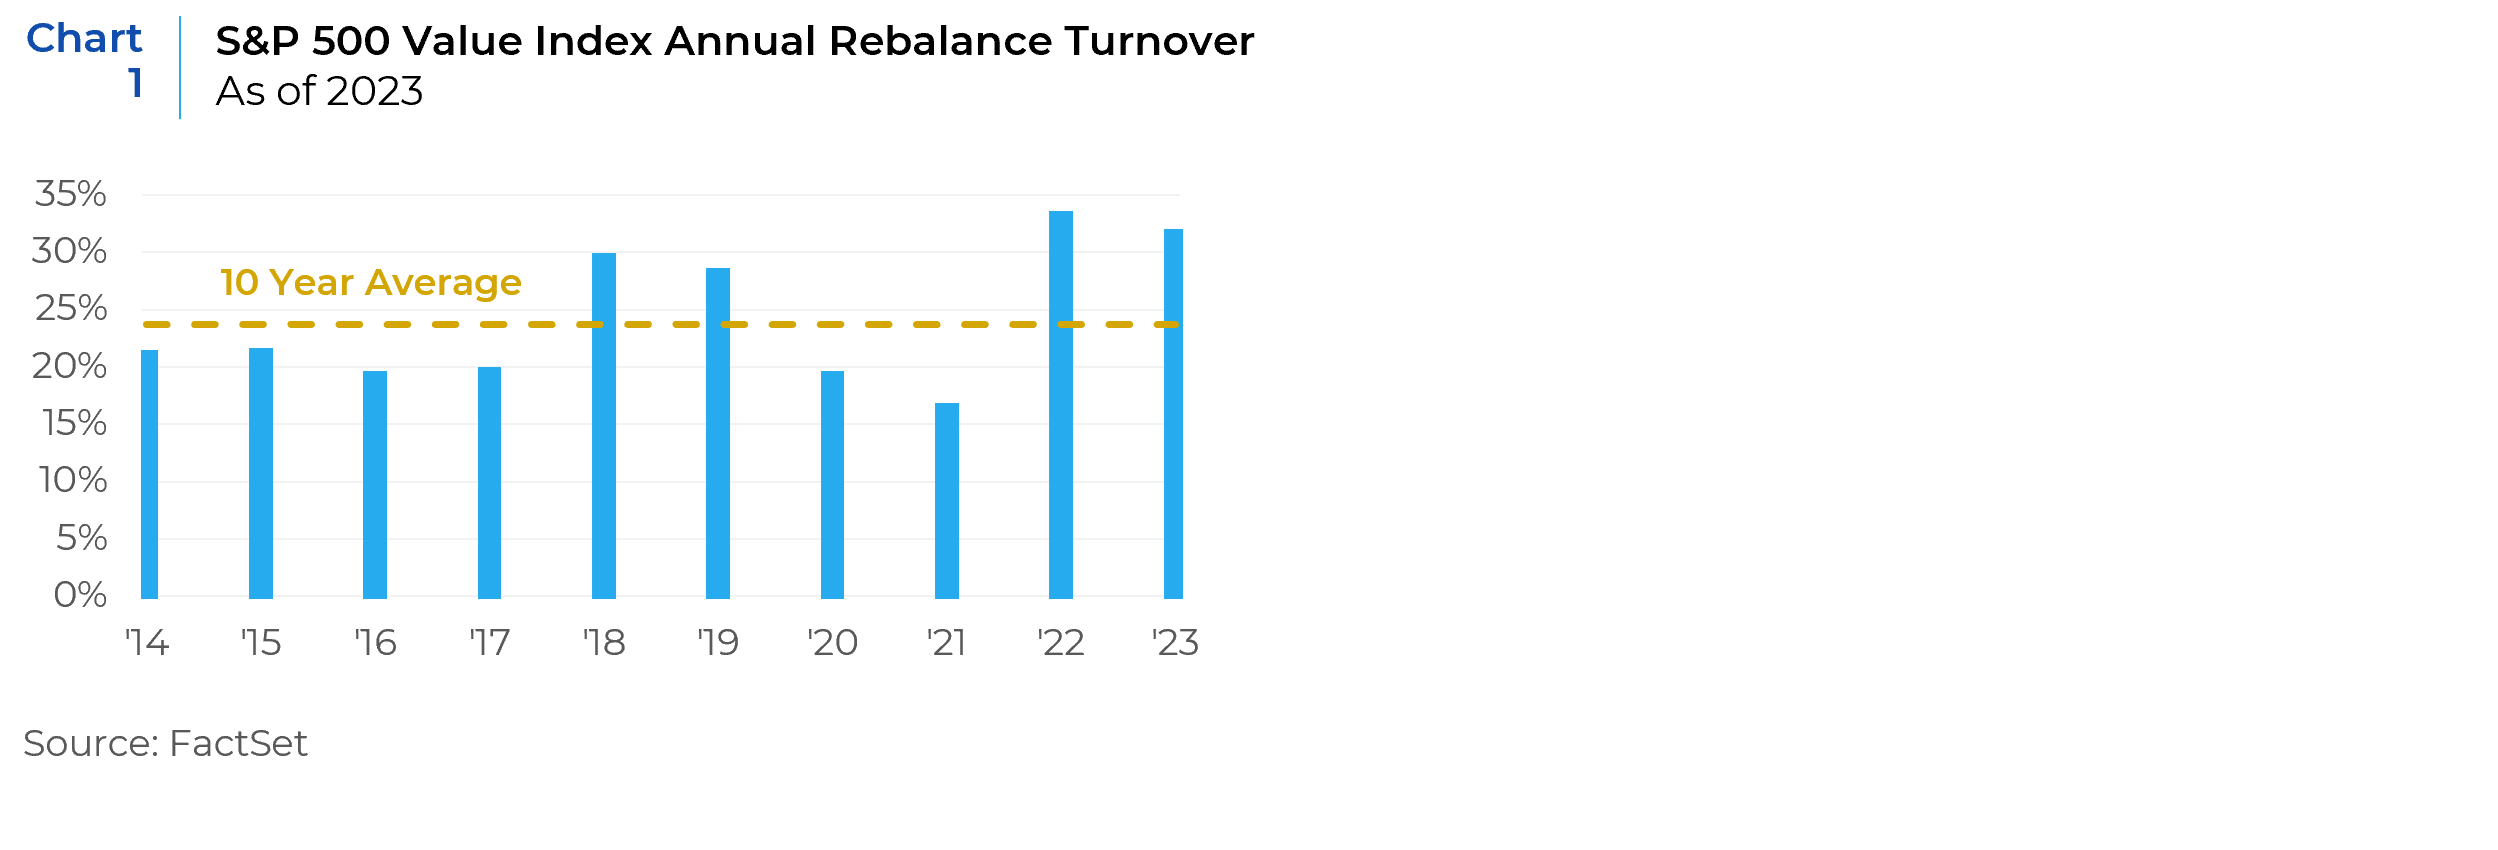
The 2023 turnover of the S&P 500 Value style benchmark at 31.4%, was significantly higher than the 10-year average turnover of 23.7%. When compared to the turnover in 2022, which was 33.0%, the 2023 turnover shows a slight decrease. However, it is important to note that both years experienced turnover levels that were above the 10-year average, suggesting a period of heightened activity within the S&P 500 Value style benchmark during these years.
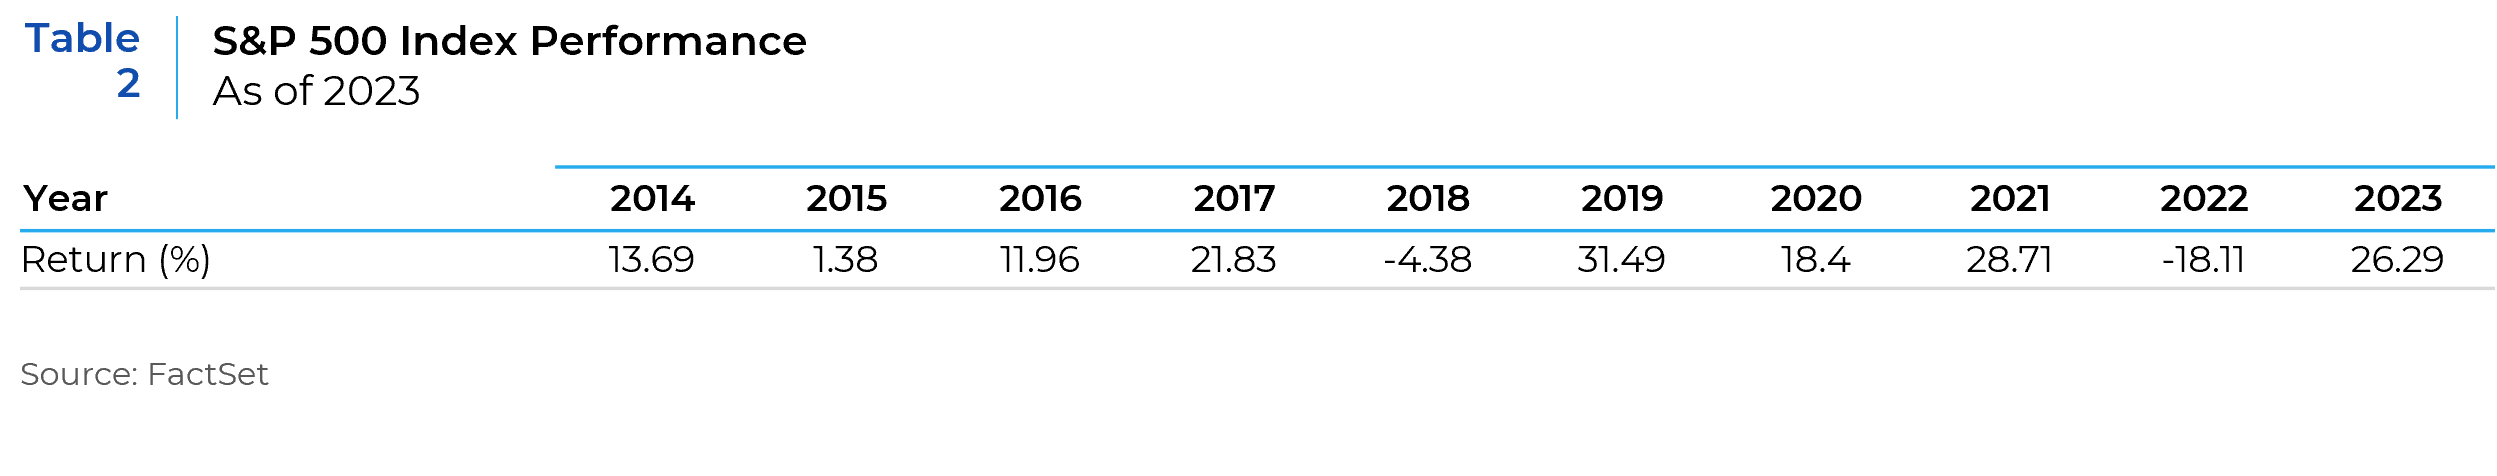
The increase in turnover during 2022 and 2023 along with the sharp reversal in risk factor, sector, and stock exposures that we will highlight throughout is most like what occurred between the 2018 and 2019 rebalances. During both periods, a negative S&P 500 index performance was followed by a strong rebound (see Table 2).
Change in Active Risk Exposures
Active change in risk factor exposure of the S&P 500 Value index versus the S&P 500 index is shown in Table 3 below.
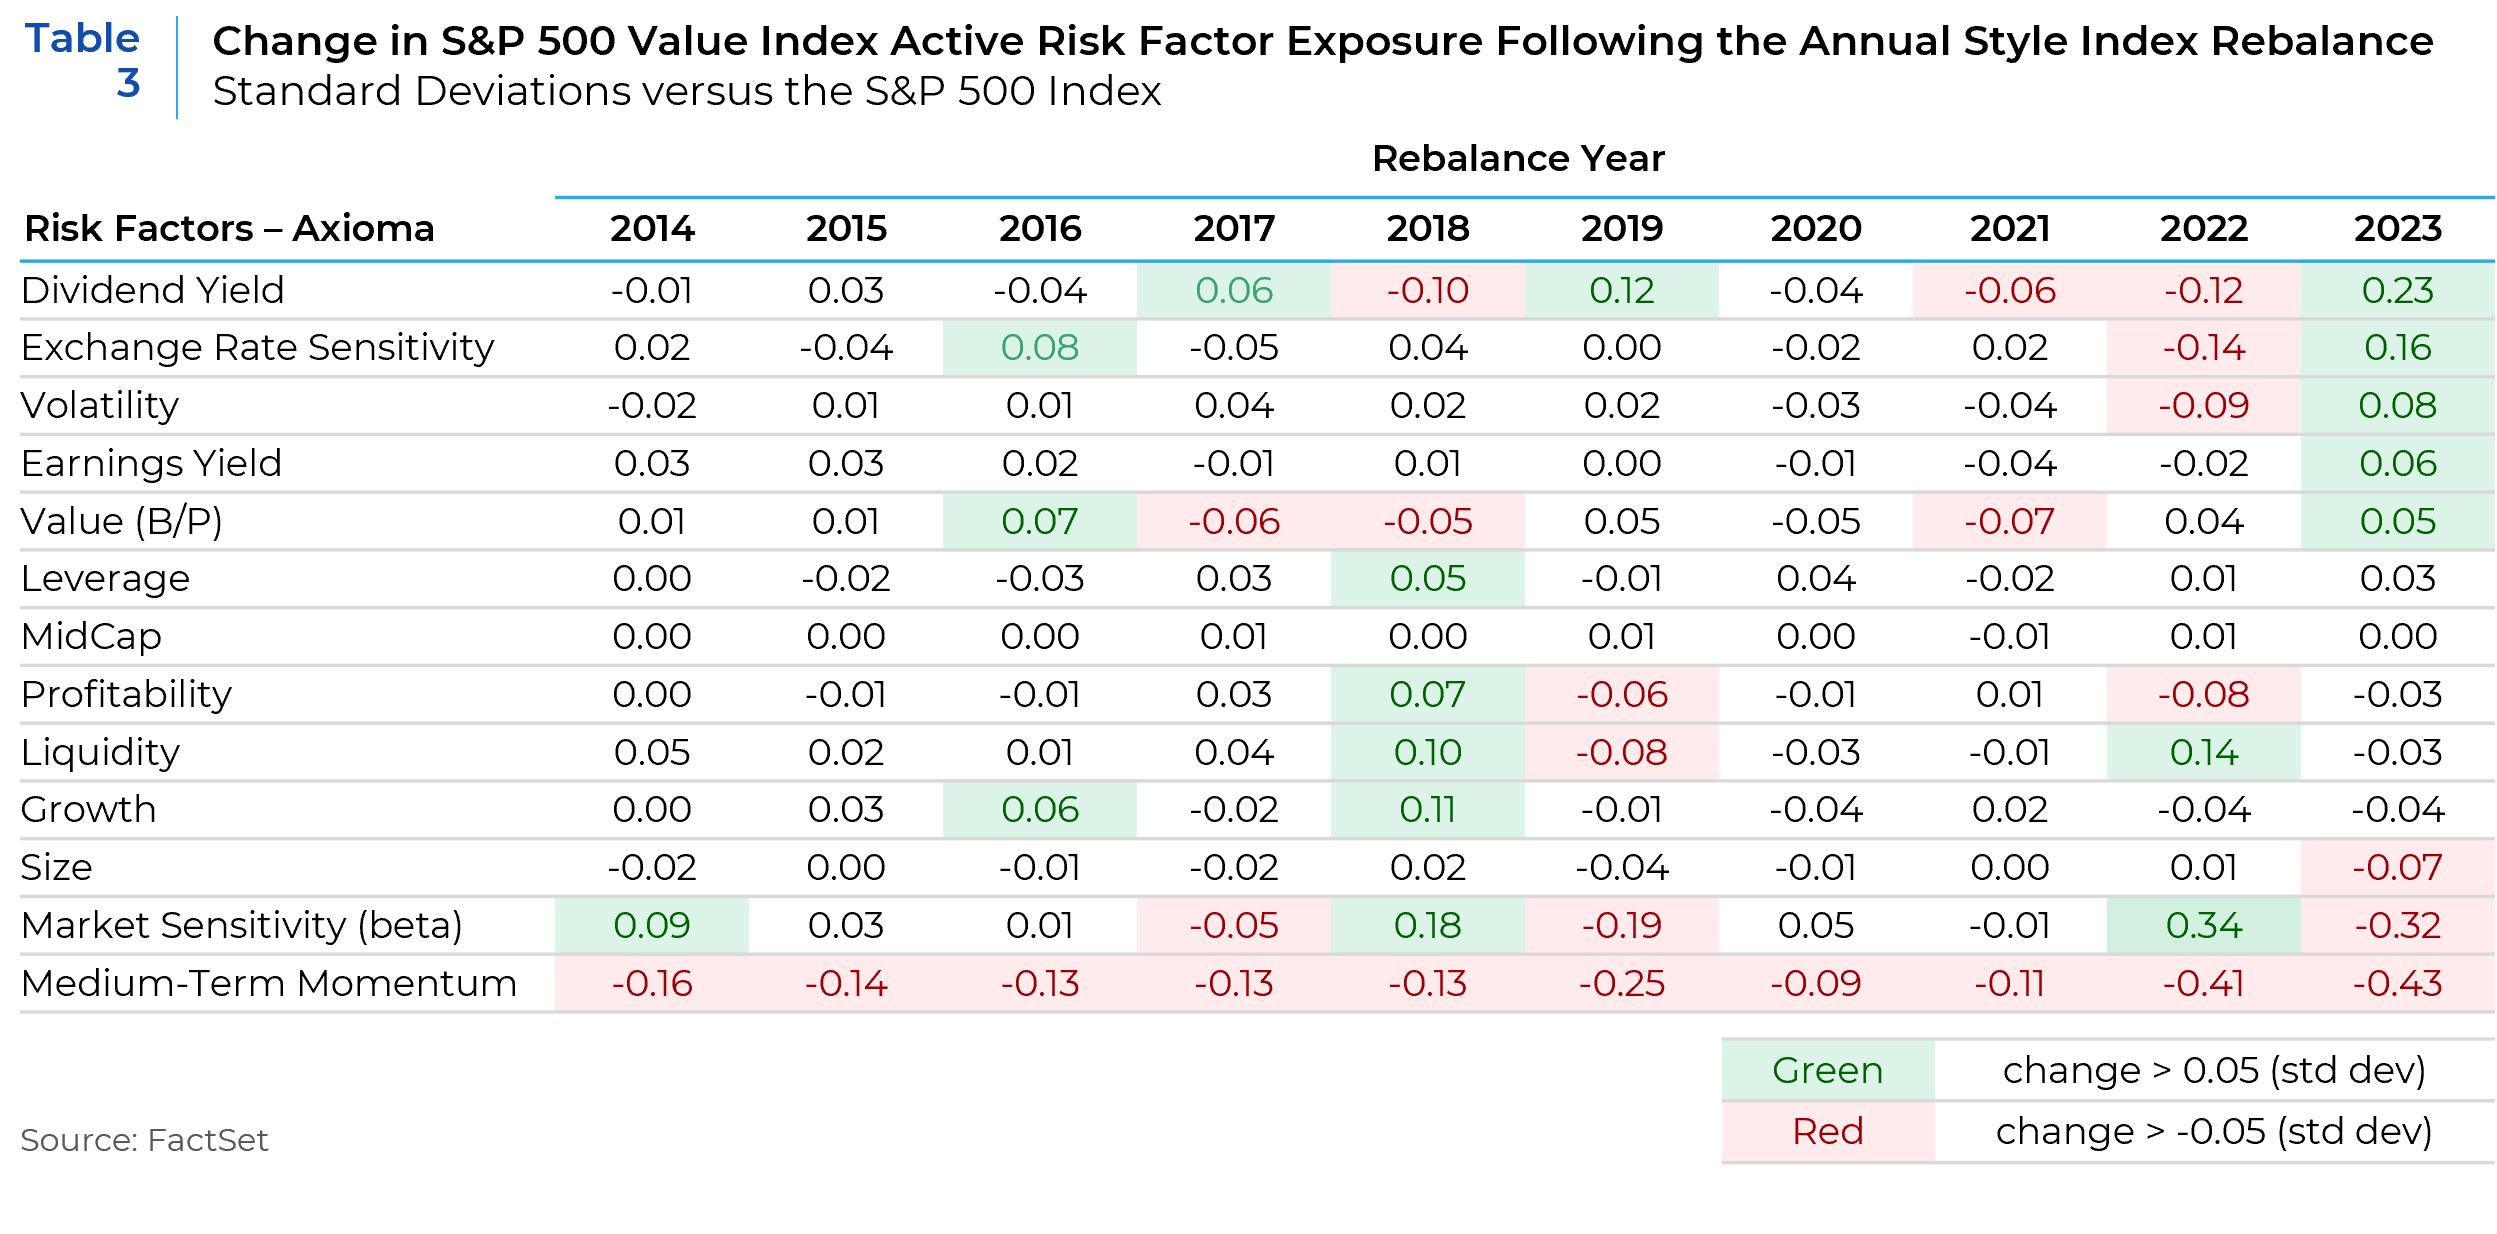
In 2023, the S&P 500 Value Index experienced considerable positive shifts in its active risk factor exposures, to value-oriented metrics such as the Value (Book to Price ratio), Earnings Yield, and Dividend Yield. These changes suggest an increase in importance of traditional value metrics in determining a company’s inclusion in the S&P 500 Value Style Index versus 2022 when the change was mostly negative, i.e., less value in the index following the rebalance. However, the substantial decrease in the Medium-Term Momentum factor, highlights the importance of momentum as a pivotal driver in determining a company’s inclusion in the Value Index. The magnitude of this shift suggests that, from a quantitative standpoint, the decline in medium-term price momentum has become a more critical factor in classifying stocks as ‘value’ within the index. This notable adjustment in factor weighting implies that the index methodology is placing greater emphasis on the recent price performance of stocks, with those exhibiting less positive momentum being more aligned with the characteristics of value stocks. This shift indicates a nuanced approach in the quantitative process, where momentum, particularly its absence or negative trend, is being weighted more heavily, thereby significantly impacting the dynamics of company selection for the Value Index.
Change in Active Sector Exposures:
Gaining further insights into the dynamic composition of the S&P 500 Value Index necessitates an examination of changes in active sector exposures. The table below illustrates the annual changes in active sector exposure relative to the S&P 500 index, sorted by the changes observed in 2023.
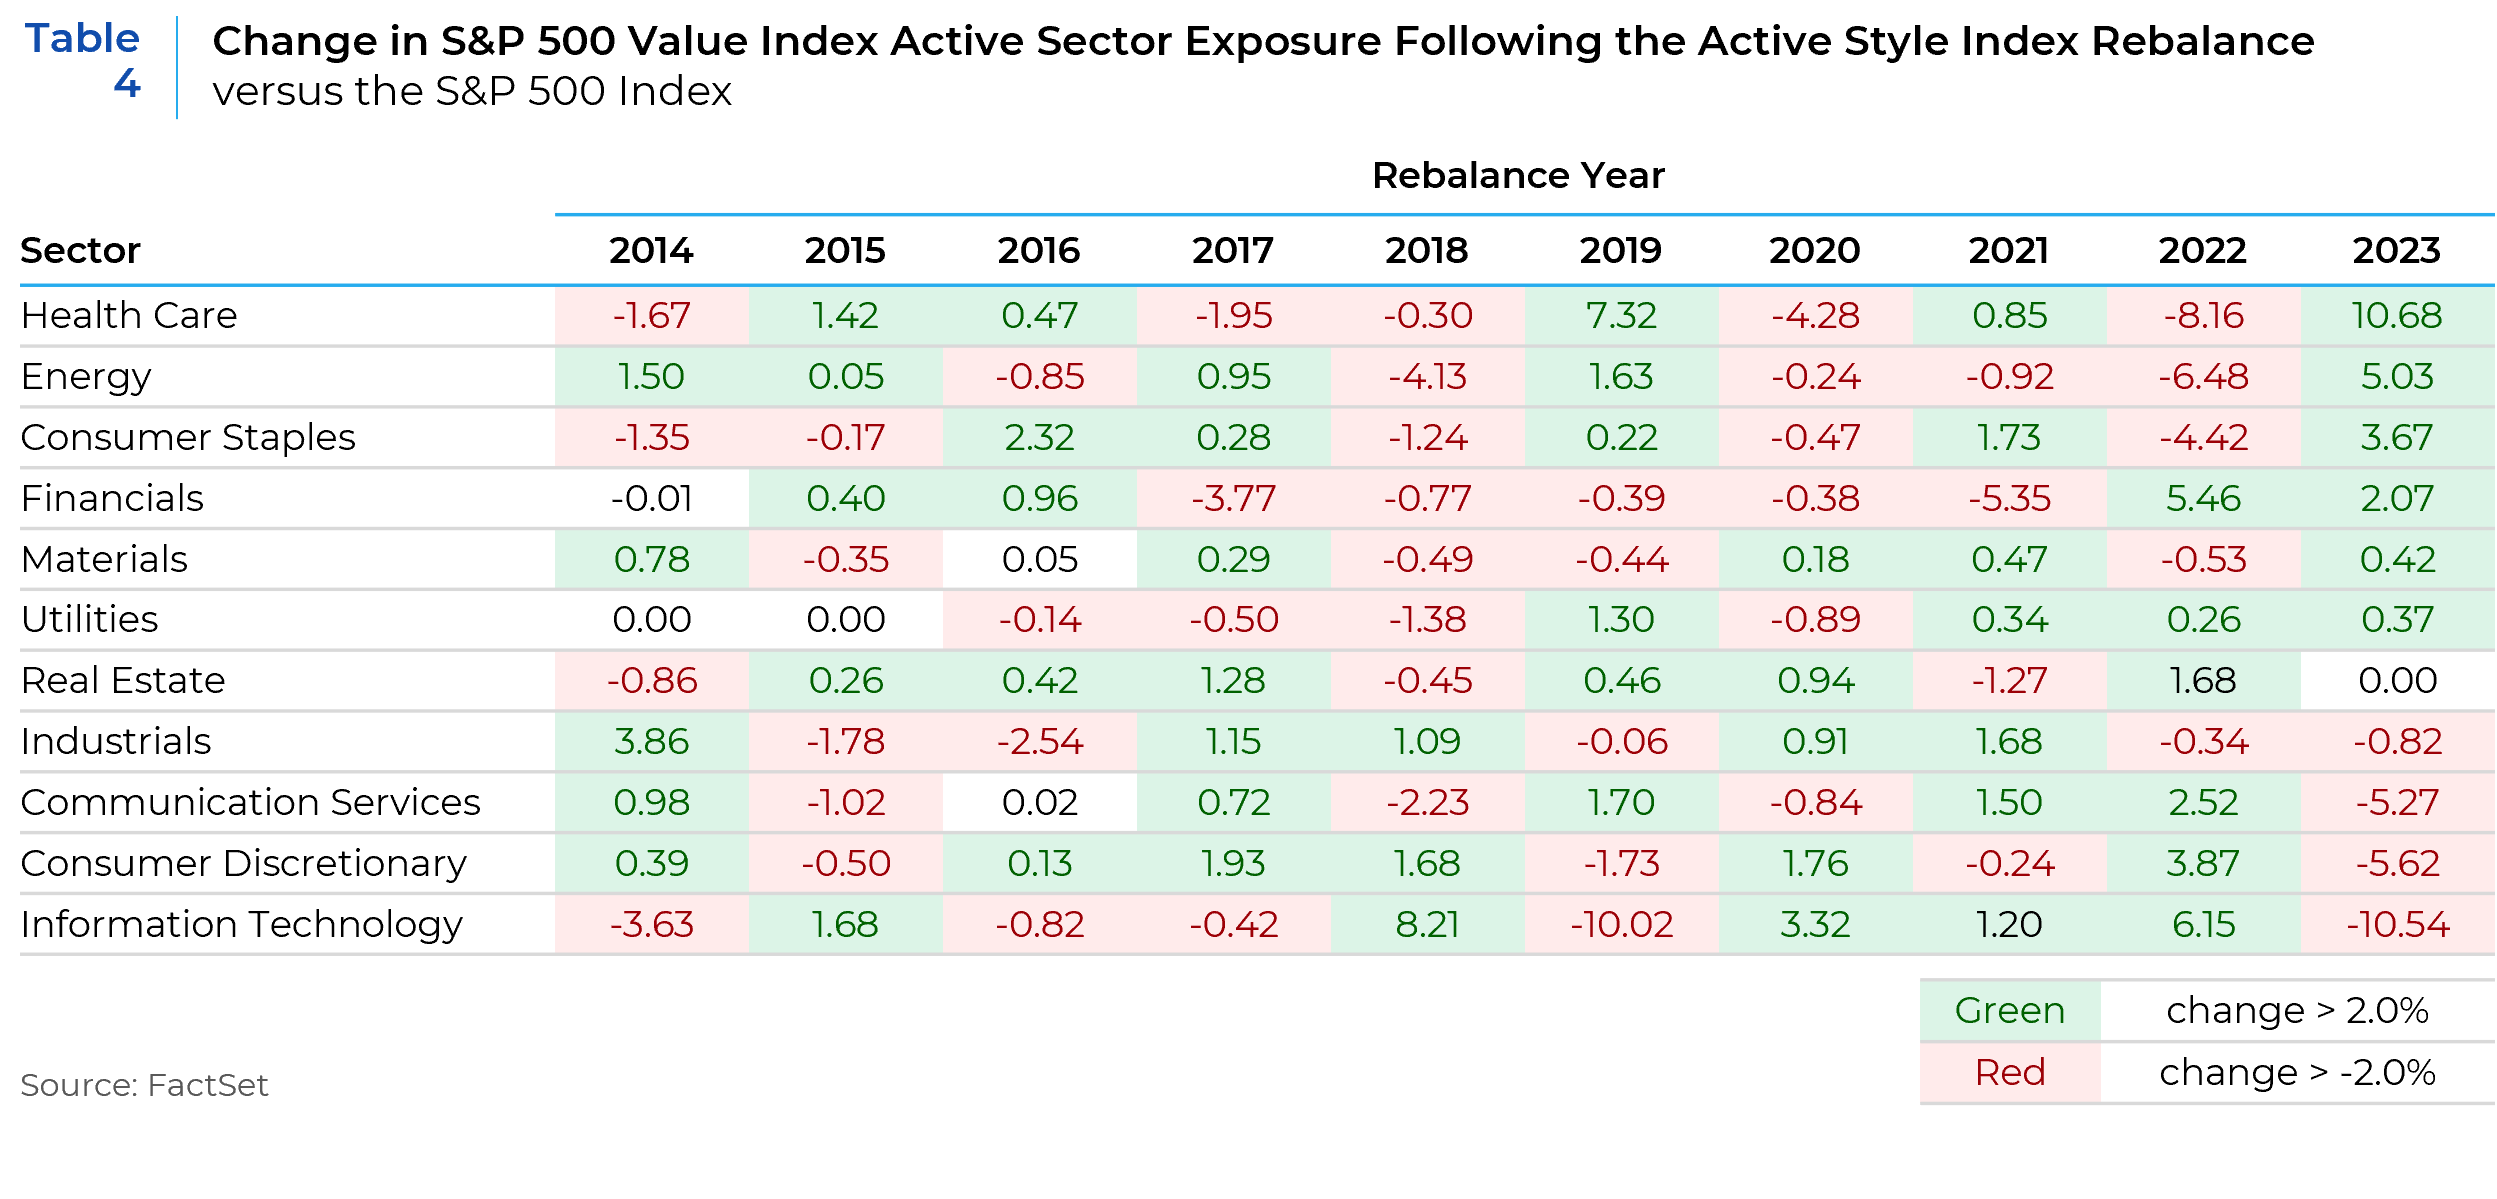
In 2023, significant shifts are observed in sector exposures compared to 2022, with notable changes in sectors like Health Care, Energy, Consumer Staples, and Information Technology influenced by the relative performance of sectors. The Health Care, Energy, and Consumer Staples sectors which all performed well in 2022, saw a decrease in performance in 2023. This resulted in an increase in their Value index weight in 2023. Conversely, the Communication Services, Consumer Discretionary and Information Technology experienced significant recoveries in 2023 after poor performances in 2022. The result was a sharp cut in their index weights. The sector exposure adjustments that occurred during the 2023 rebalance resulted in the index being more highly exposed towards traditional value sectors.
Largest Company Index Weight Changes
The following table (Table 5) displays the five most significant increases and decreases in stock-level weights during the 2023 annual S&P 500 Value Style index rebalance versus their 2022 index weight change.
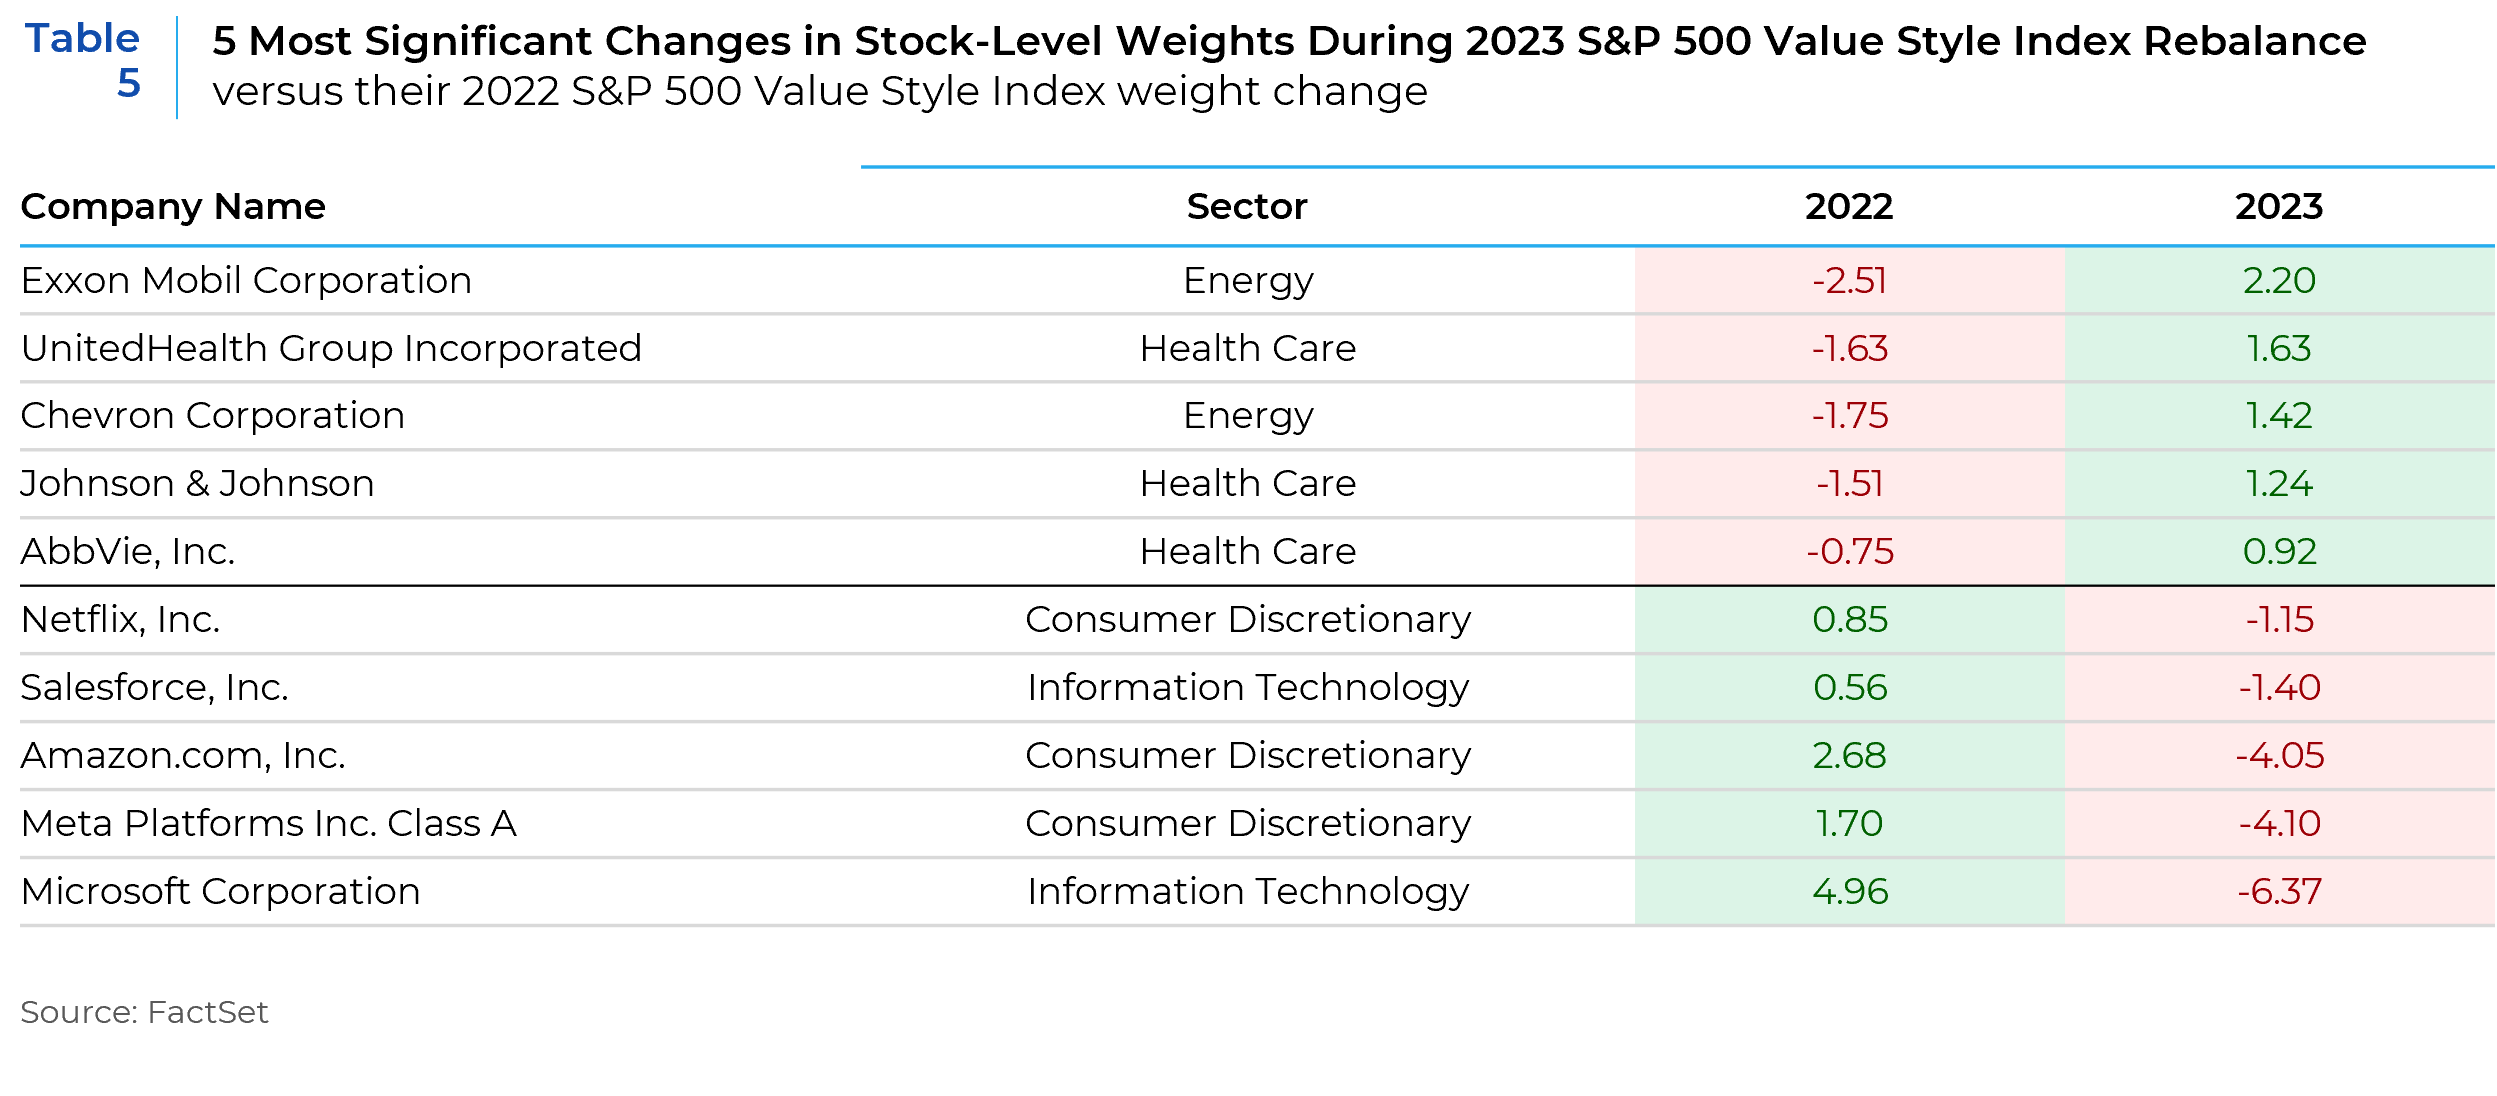
The year-over-year reversals in stock weights from 2022 to 2023, particularly among those in the information technology, energy, and healthcare sectors, suggest that short-term momentum rather than fundamental changes was the primary driver behind these shifts. For example, stocks like Microsoft and Amazon saw decreased weights in the Value index in 2023 after increases in 2022, due to price momentum shifts, not necessarily because they have moved away from being growth stocks. Conversely, energy and healthcare stocks like Exxon and UnitedHealth experienced weight increases in 2023 following decreases in 2022, hinting at their recent negative price momentum but not fundamentally altering their value stock nature.
These significant reversals raise questions about the extent of fundamental changes versus the impact of short-term market dynamics. True fundamental shifts in company valuations would typically result in more gradual and consistent weight changes in an index, rather than the abrupt year-over-year reversals observed, suggesting that price momentum might play a key role in these fluctuations within a value index context.
The Impact of High Turnover and Considerable Changes on Investment Strategies:
High turnover and significant changes in sector, risk, and stock exposures can have distinct impacts on passive and active investment strategies. For passive strategies, which aim to replicate the index, high turnover could mean increased transaction costs and potential tracking errors, as funds are forced to realign with significant index changes. Active strategies might be able to leverage these shifts for potential gains but must also manage the associated higher transaction costs and risk profile adjustments.
Conclusion:
The analysis of the S&P 500 Value Index across the 2022 and 2023 annual rebalances reveals a pattern of high turnover and notable reversals in risk factor, sector, and stock weights, suggesting that short-term price momentum may have been the primary driver of index changes over fundamental factors. The year-over-year shifts, particularly in large-cap stocks like Microsoft, Amazon, and Exxon, hint that these movements may not reflect deep-seated valuation changes but rather the sway of momentum, challenging the index’s stability and the predictiveness of its value classifications.
This heightened turnover, well above the decade’s average, points to the index’s sensitivity to market trends, potentially increasing costs and tracking error for passive investors. The inclusion of momentum in determining style classification, especially in such a concentrated index, complicates alignment with the benchmark for passive strategies and heightens risk for active strategies, necessitating agile adjustments to rapid sector and stock exposure shifts.
This report is neither an offer to sell nor a solicitation to invest in any product offered by Xponance® and should not be considered as investment advice. This report was prepared for clients and prospective clients of Xponance® and is intended to be used solely by such clients and prospects for educational and illustrative purposes. The information contained herein is proprietary to Xponance® and may not be duplicated or used for any purpose other than the educational purpose for which it has been provided. Any unauthorized use, duplication or disclosure of this report is strictly prohibited.
This report is based on information believed to be correct, but is subject to revision. Although the information provided herein has been obtained from sources which Xponance® believes to be reliable, Xponance® does not guarantee its accuracy, and such information may be incomplete or condensed. Additional information is available from Xponance® upon request. All performance and other projections are historical and do not guarantee future performance. No assurance can be given that any particular investment objective or strategy will be achieved at a given time and actual investment results may vary over any given time.