
In our prior insights piece “Decoding the Shifting Landscape of the S&P 500 Value Index: Unveiling Insights from Changes in Active Risk Exposure, and Companies During the Annual Style Rebalance,” we highlighted that the high level of turnover and the importance of Momentum as a driver of the risk, sector and stock changes in the S&P 500 style rebalance could result in some unexpected tilts in this index from that provided by other index companies. In this update we review the results of the most recent Russell 1000 Large Cap Value annual Style Index rebalance that occurred on June 23rd. We also compare the exposures of the Russell 1000 Value index versus the S&P 500 Value index at 06/30/23 and consider the potential impact of factor and sector differences between the indexes on investors targeting large cap value exposure.
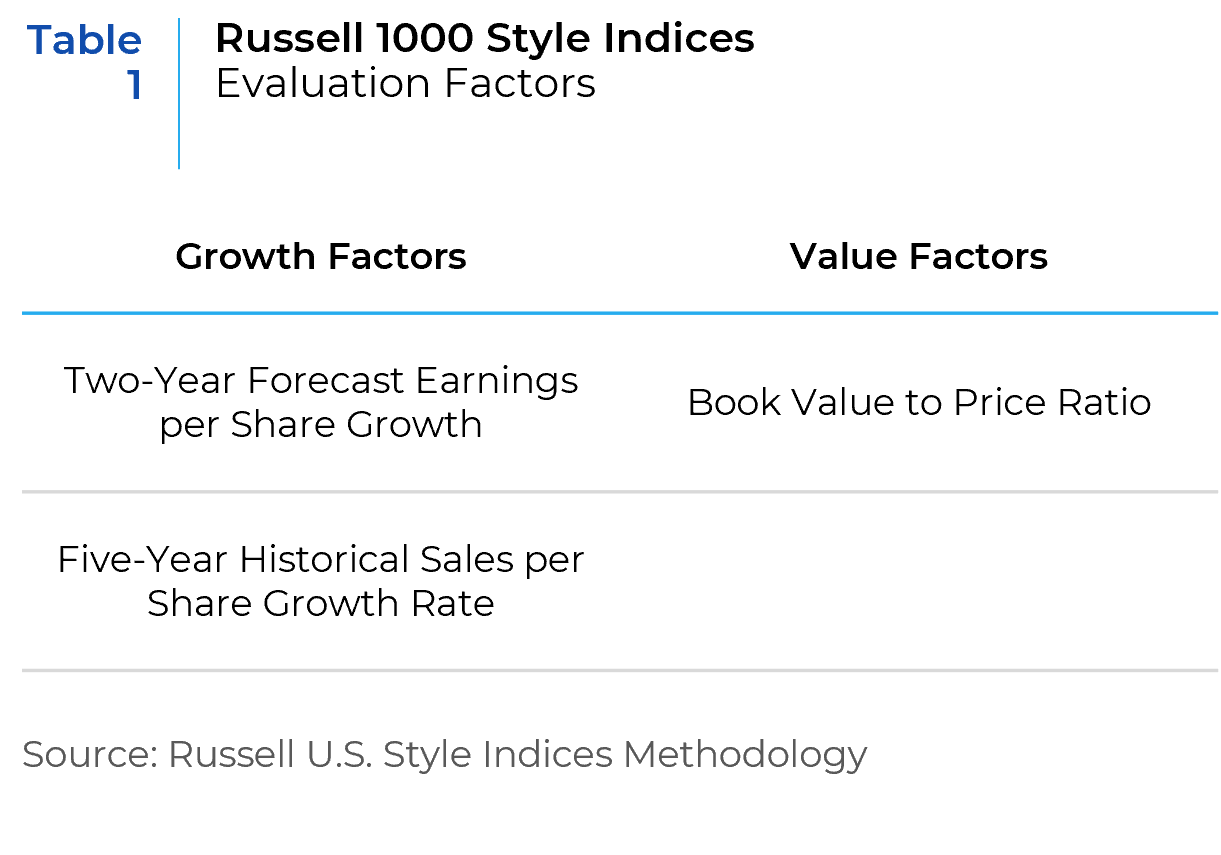
The Russell Style indices employ two factors to evaluate a company’s exposure to growth and one factor for value. The factors are presented in the table (Table 1) provided below. Unlike the S&P style index construction, momentum is not used as measure of growth in the Russell methodology.
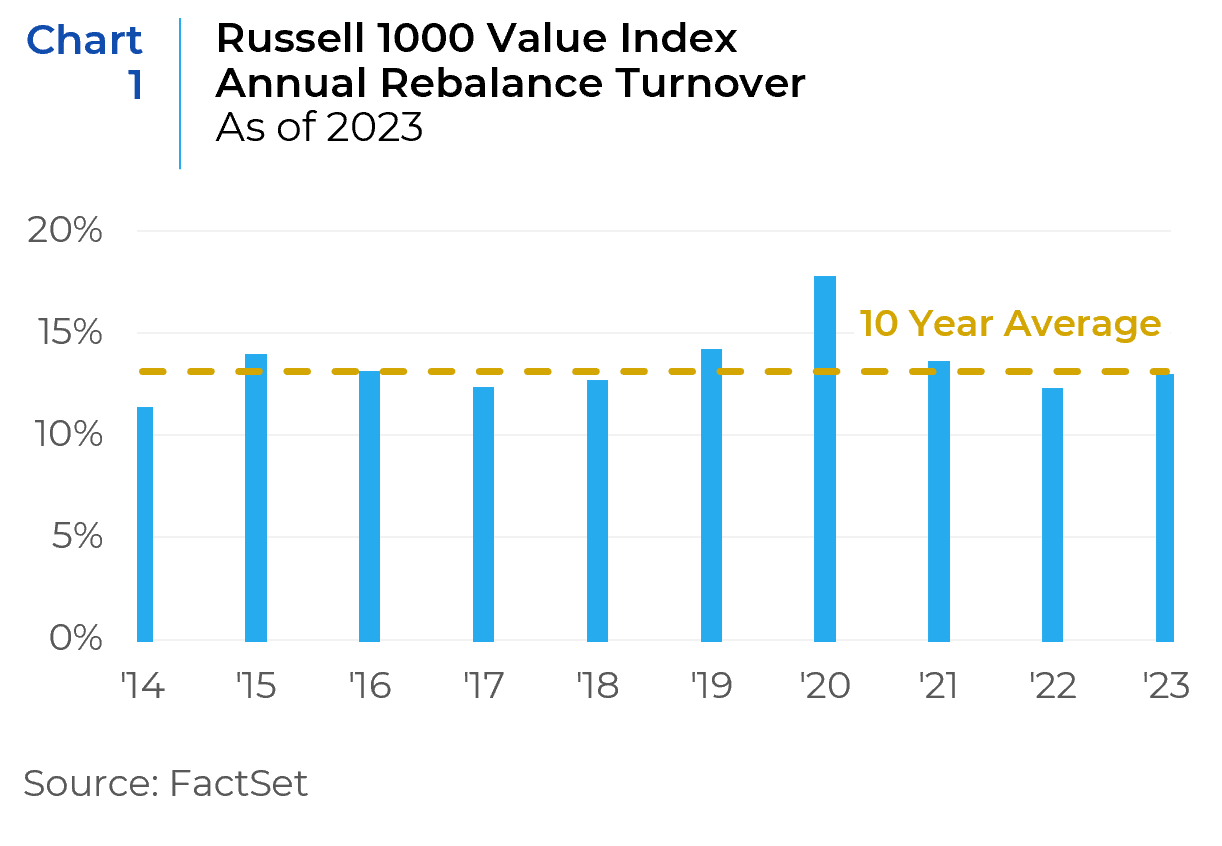
The following chart (Chart 1) shows the turnover of the Russell 1000 Value during the past ten annual rebalances.
The addition of the 10-year average highlights the consistency of the annual turnover for this index. In the past decade, the turnover rates for the index have remained close to the 10-year average of 13.1%. The turnover in 2023 was 12.7%, up slightly from the 2022 level but in line with the average. For those managing an index portfolio targeting this index, this low and consistent turnover can be particularly beneficial. It means lower transaction costs and enhanced predictability of portfolio management, allowing for better risk assessment and optimized asset allocation.
Changes in Active Risk, Sector, and Stock Exposures
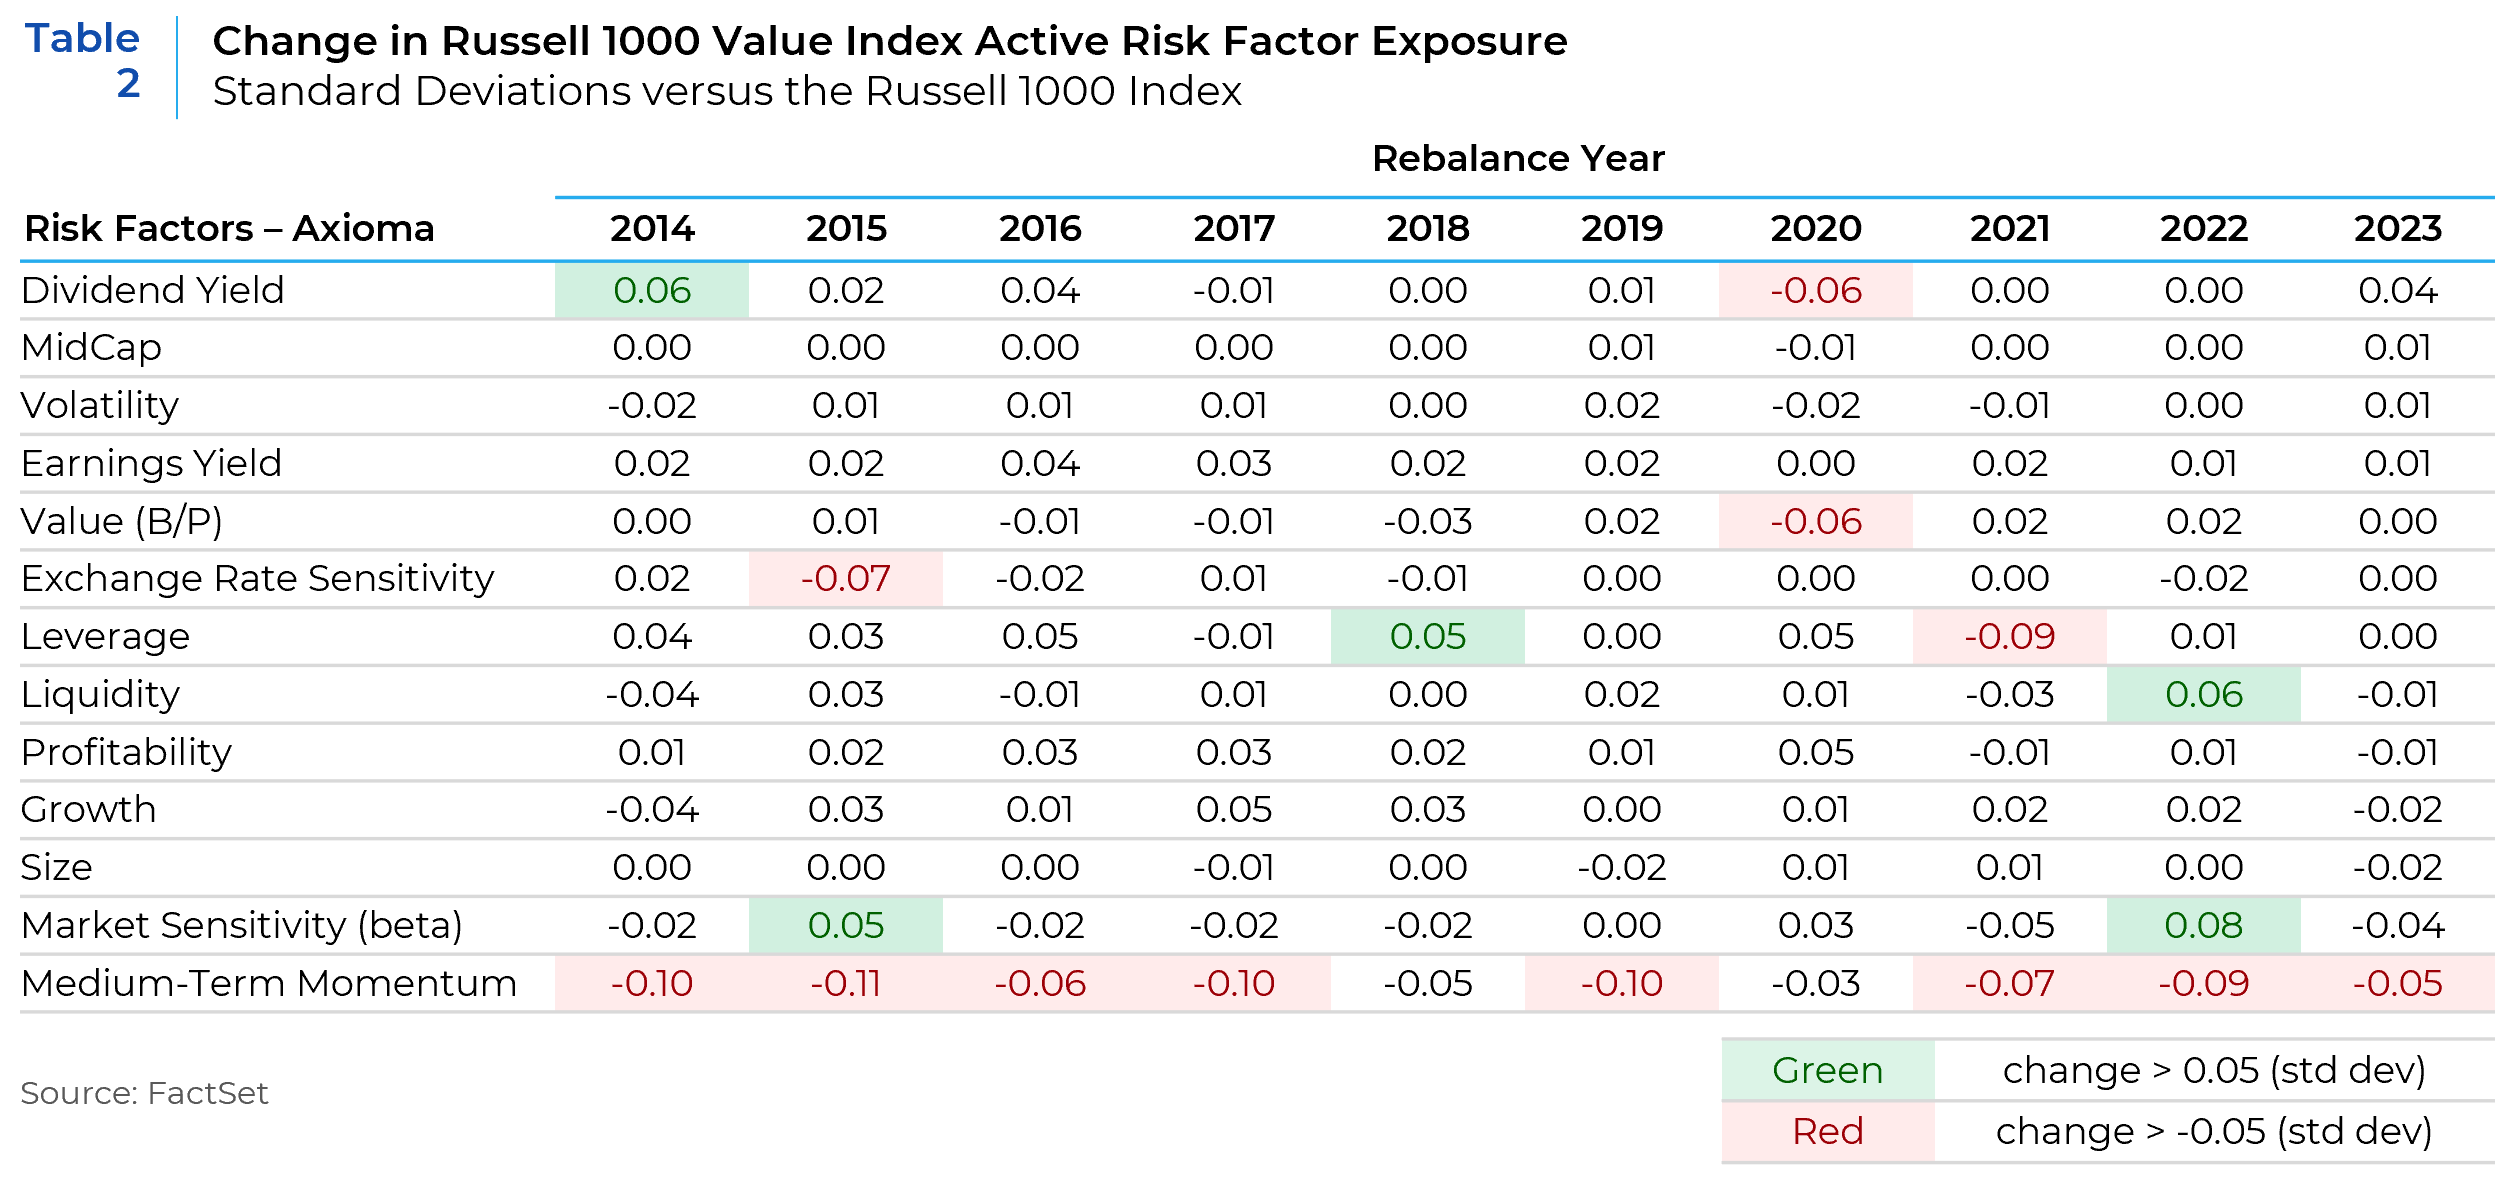
When examining the changes in risk exposures of the Russell 1000 Value index versus the broad Russell 1000 index, it is evident that annual changes mostly remain within a tight band, emphasizing the stability of the index exposures over the decade. Most changes are less than 0.05 standard deviations, suggesting subtle adjustments or maintenance in the index’s composition rather than significant directional shifts.
The table below illustrates the annual changes in active sector exposure relative to the Russell 1000 index, sorted by the size of the changes observed in 2023.
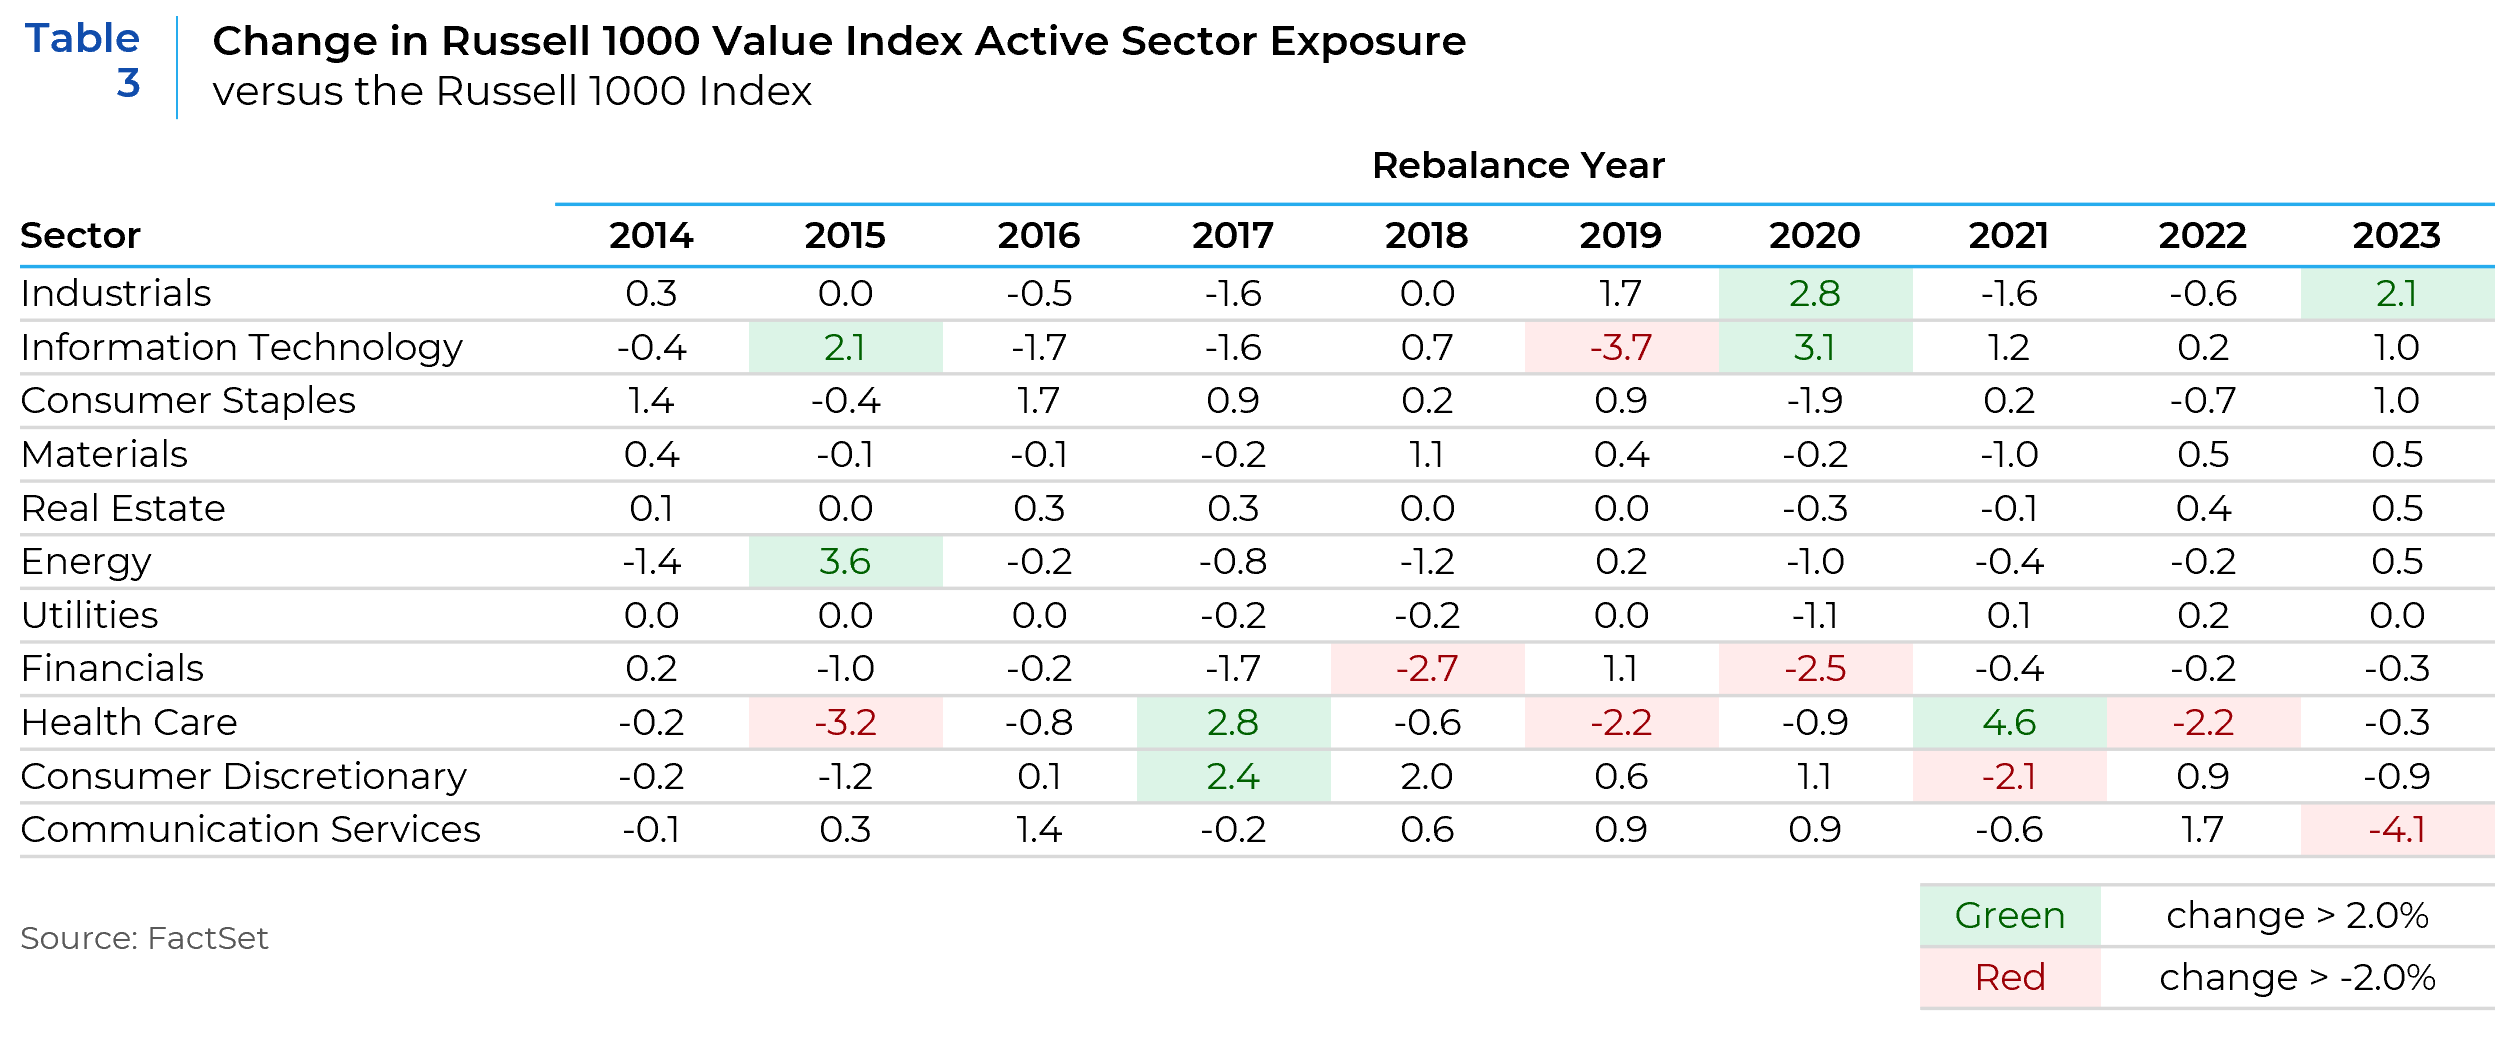
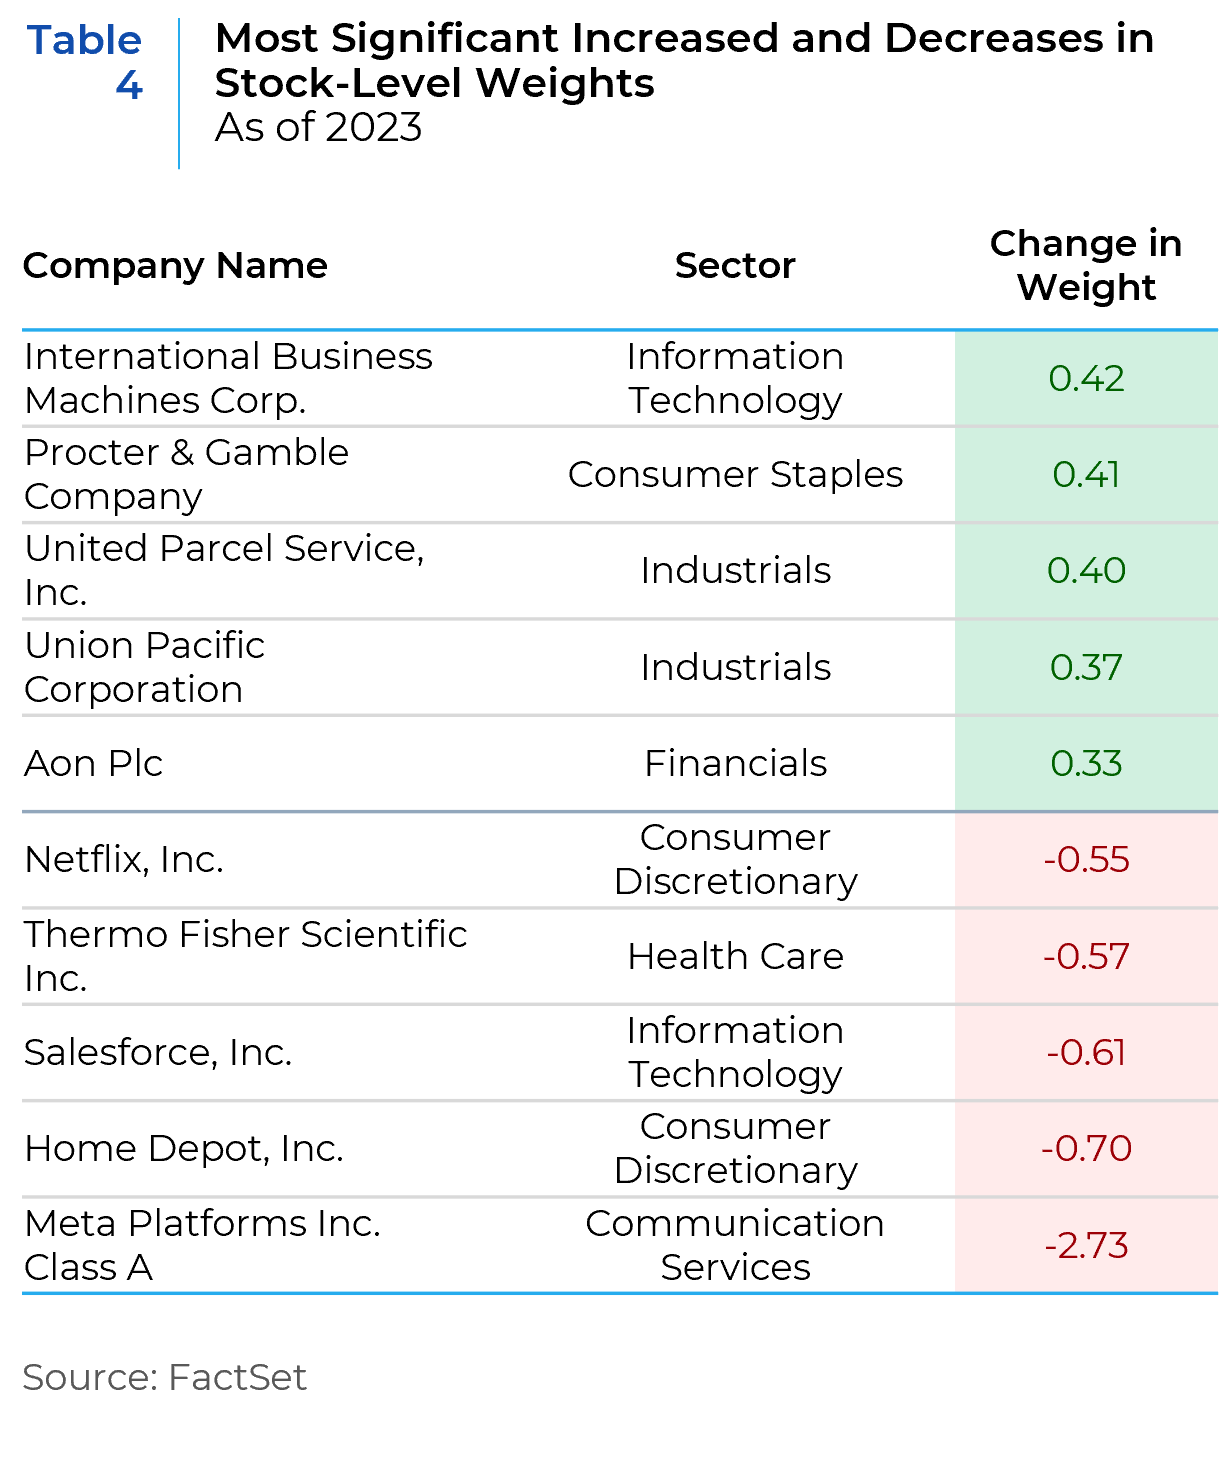
The direction of annual sector changes is less consistent versus the changes in risk factors, but most have been small at +/-2%. At the stock level (Table 4), the increased weight in the Industrials sector is driven by gains in companies like United Parcel Service and Union Pacific Corporation. Meta Platforms had the largest decrease in weight, which accounts for most of the decrease in Communication Services.
In summary, low consistent turnover and slight changes in risk factors, sector, and stock weights highlight the stability of the Russell 1000 Value index’s relative exposures versus the broad Russell 1000 index over time. This contrasts with the elevated level of turnover and considerable changes in risk factor, sector and stock weights that resulted during the S&P 500 Value index rebalance.
Comparison of Russell 1000 Value Sector and Risk Factor Exposures versus the S&P 500 Value index – 06/30/23
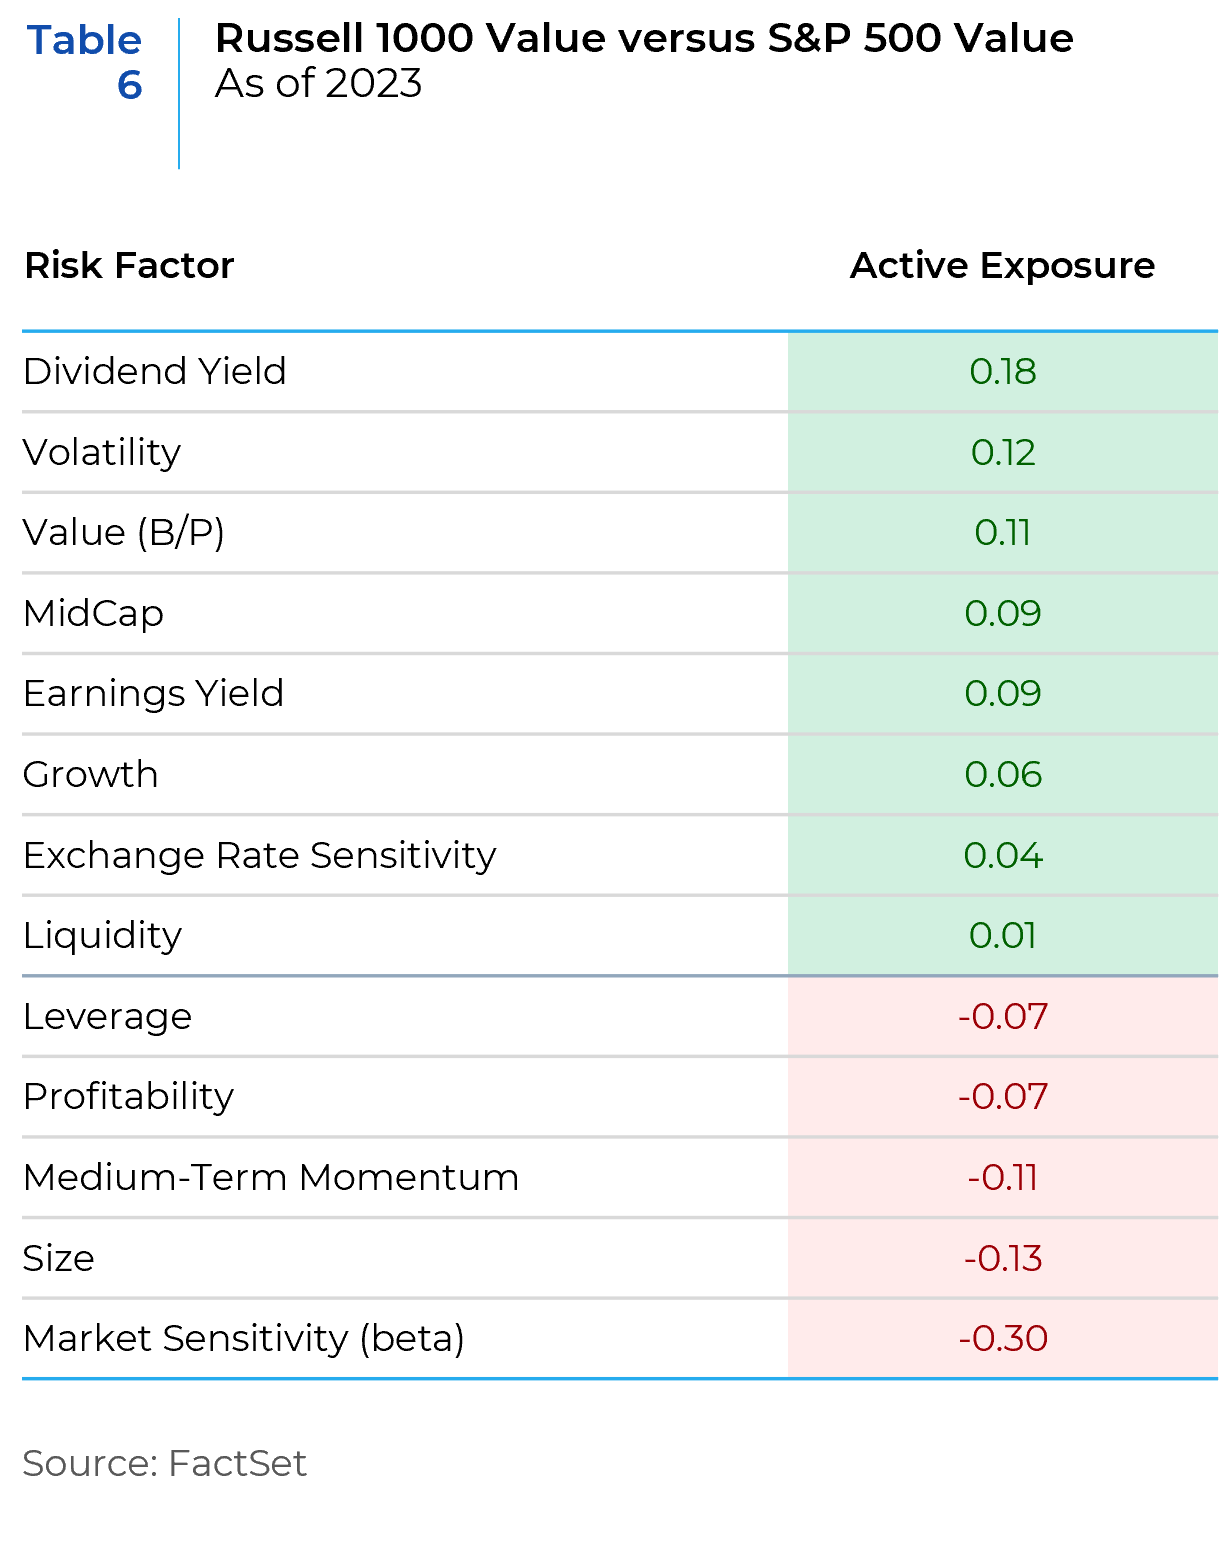
The sector (Table 5) and risk factor (Table 6) exposures between the Russell 1000 Value and the S&P 500 Value indexes provide insights into the depth of their value orientation.
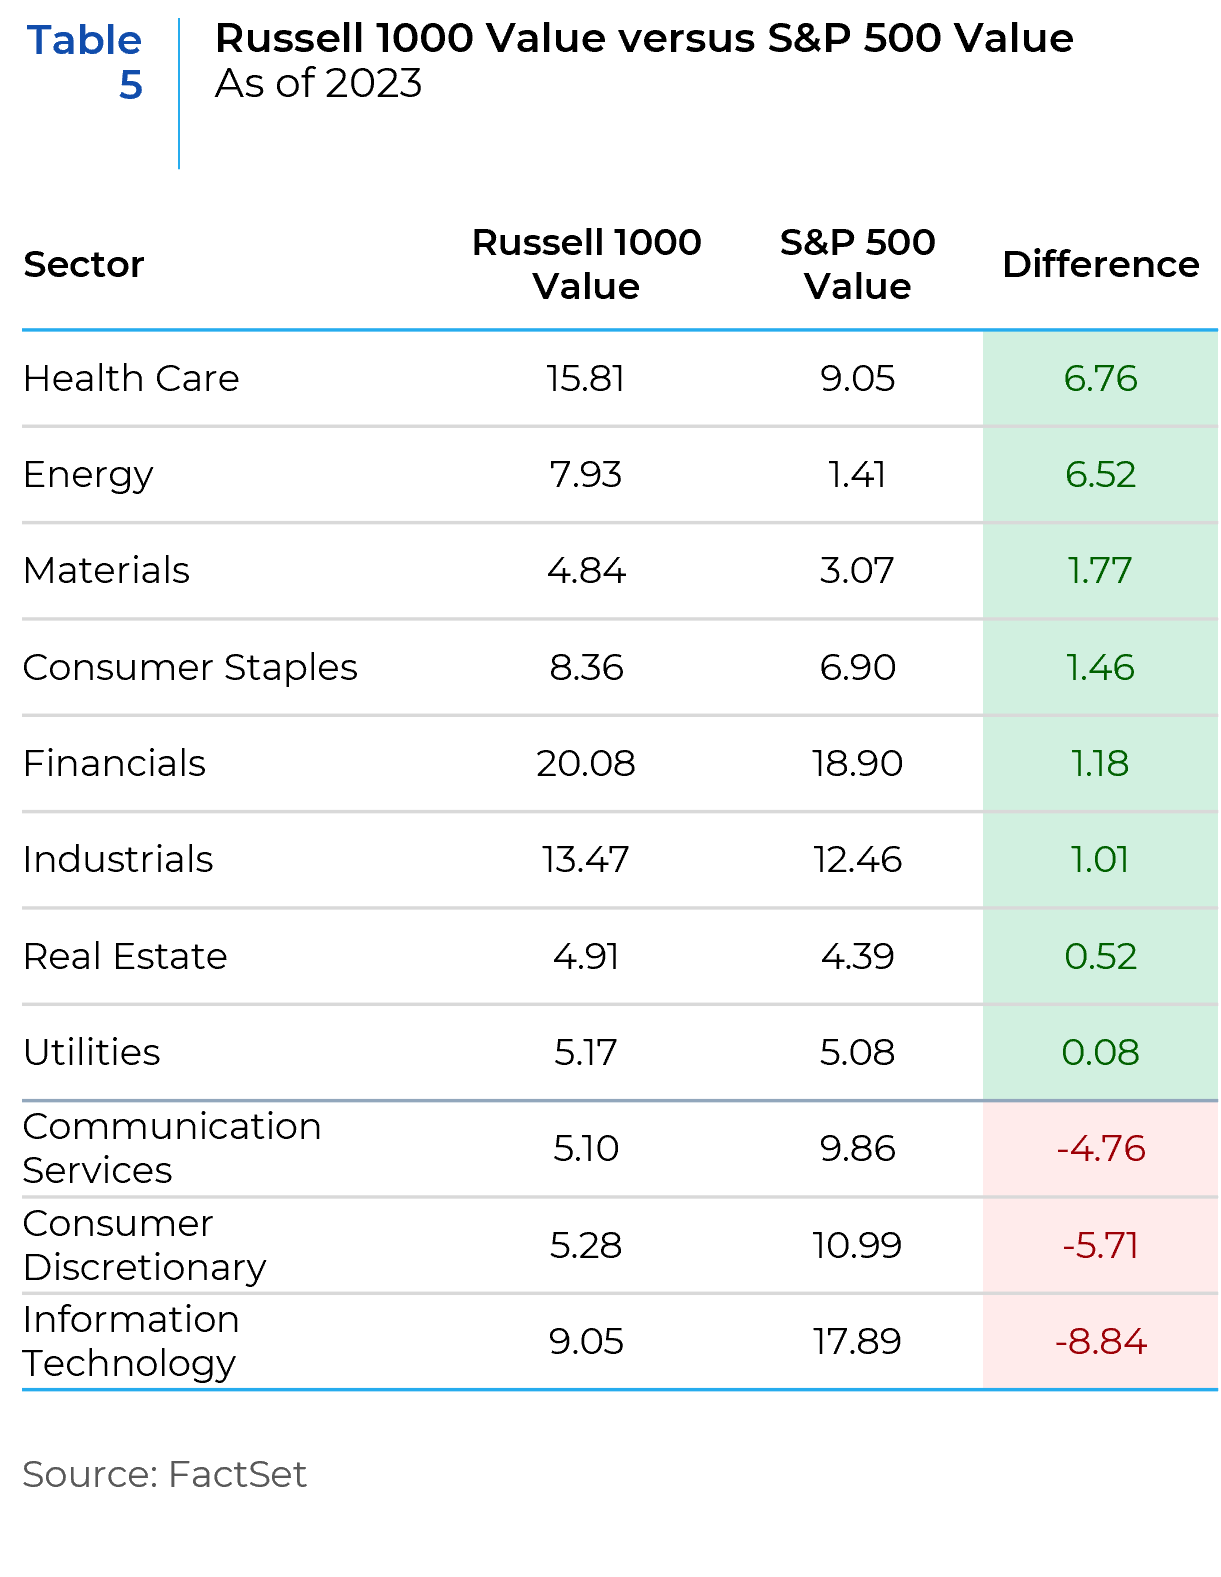
Sectors with Traditional Value Affinity: Health Care and Energy show significantly higher weights in the Russell 1000 Value compared to the S&P 500 Value. Traditionally, these sectors are associated with more stable earnings, dividends, or undervaluation, suggesting a deeper tilt towards value characteristics in the Russell 1000 Value in these areas.
Technology and Growth Sectors: The Russell 1000 Value has notably less exposure to sectors like Information Technology and Consumer Discretionary, which are often associated with growth stocks. A lower allocation to these sectors underscores a stricter adherence to value criteria.
Positive exposures to factors like Dividend Yield, Volatility, and Value in the Russell 1000 Value, especially Dividend Yield, signify a classic value inclination, focusing on companies paying consistent dividends, undervalued stocks, and potentially stocks with higher volatility.
The emphasis on traditional value sectors, combined with the risk factor exposures, suggests that the Russell 1000 Value might have a deeper value tilt than the S&P 500 Value.
Impact for investors
While both indexes cater to value-oriented investors, the Russell 1000 Value takes a more definite stance on value characteristics. Investors seeking a stronger tilt toward traditional value might find the Russell 1000 Value more appealing.
A passive strategy tracking the Russell 1000 Value would have a more traditional value tilt, which might mean more pronounced cyclical behavior — potentially underperforming during growth-led rallies but potentially outperforming in value-favorable conditions. Active investors aiming to outperform the value benchmark would need to consider the sector, risk factor, and stock weight differences when constructing their portfolios to ensure the excess return potential of their strategy is not overwhelmed by biases in the target benchmark. Understanding these biases is fundamental to attributing performance, be it stock selection or allocation decisions, and adjusting the strategy accordingly.
Conclusion
Understanding the nuances between the two benchmark construction methodologies is essential for determining their appropriateness as a benchmark to measure the performance of investment strategies. The Russell 1000 Value index, with its consistent low turnover and stable sector, risk factor, and stock allocations, offers a more predictable and defined value orientation versus the S&P 500 Value Index. This stability and clarity can make it a preferable benchmark for those seeking a robust representation of value characteristics.
This report is neither an offer to sell nor a solicitation to invest in any product offered by Xponance® and should not be considered as investment advice. This report was prepared for clients and prospective clients of Xponance® and is intended to be used solely by such clients and prospects for educational and illustrative purposes. The information contained herein is proprietary to Xponance® and may not be duplicated or used for any purpose other than the educational purpose for which it has been provided. Any unauthorized use, duplication or disclosure of this report is strictly prohibited.
This report is based on information believed to be correct, but is subject to revision. Although the information provided herein has been obtained from sources which Xponance® believes to be reliable, Xponance® does not guarantee its accuracy, and such information may be incomplete or condensed. Additional information is available from Xponance® upon request. All performance and other projections are historical and do not guarantee future performance. No assurance can be given that any particular investment objective or strategy will be achieved at a given time and actual investment results may vary over any given time.