
Read our blog post here: #derisking #assetallocation #equities #bonds #negative yields #yield curve#inflation#fed funds rate#industrial production#cape ratio#economic cycle downturns
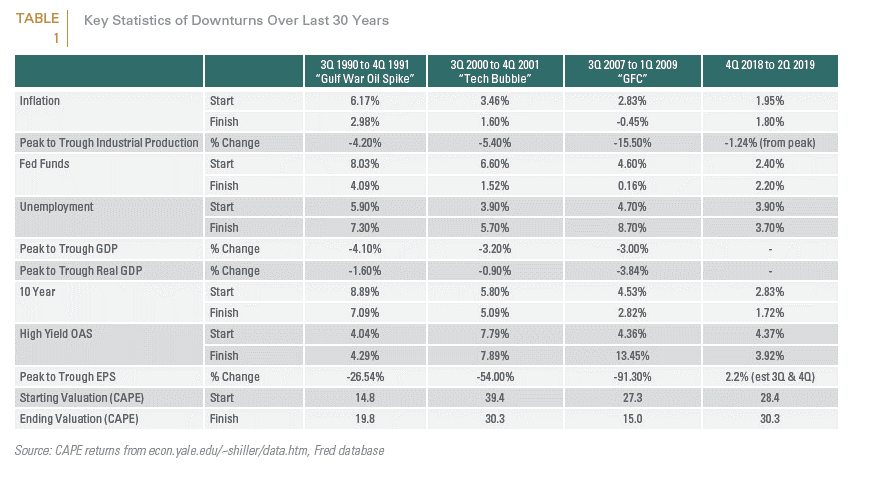
Our evaluation of key downturns over the last 30-year point to 3 key differences between today’s macro backdrop and the most recent period.
- As of June 30, 2019, the equity market’s cyclically adjusted (CAPE) valuation of 30.3 is higher than it was at the end of all bull markets that preceded a subsequent equity and cyclical downturns with the exception of the end of the dot com era.
- Levels of inflation, the yield on 10-year treasuries and the fed funds rate are significantly lower. As of June 30, 2019, the fed funds rate stood at 2.2% vs. 8.03% at the beginning of the 1990 downturn; 6.60% at the beginning of the dot com downturn and 4.06% at the beginning of the GFC.
- At $3.67 trillion, the Fed’s balance sheet is approximately four times its size pre-GFC. These last points are critical because of the Fed’s key role in mitigating prior equity market downturns. Therefore, if the decline in industrial production leads to recession, the Fed could have less bandwidth for conventional policy support to mitigate the next recession.
You can read our 2019 analysis of institutional investor derisking trends, Battening Down the Hatches, Part 2.