
The 4th quarter of 2023 was another volatile quarter, replete with changing market narratives. The 4th quarter Treasury and spread rally rescued the broad fixed income market from another year of negative or barely positive (depending on sector) returns. In traditional bond market fashion, however, we find much to worry about with stretched valuations in most of the spread sectors and an uncertain path forward for the economy and interest rates.
We begin with a recap of performance across the fixed income sector landscape and evaluate the market’s outlook for interest rate cuts over the course of 2024 (current futures implied pricing as of 1/22/24 is an expectation of 6 cuts for a total of nearly 150 bps of decreases to the Federal Funds rate). Yet the prevailing market narrative is for a soft landing that avoids recession. An economy navigating a soft landing should not need that number of cuts in such a short amount of time. We will examine this outlook against a backdrop of broad macro data points.
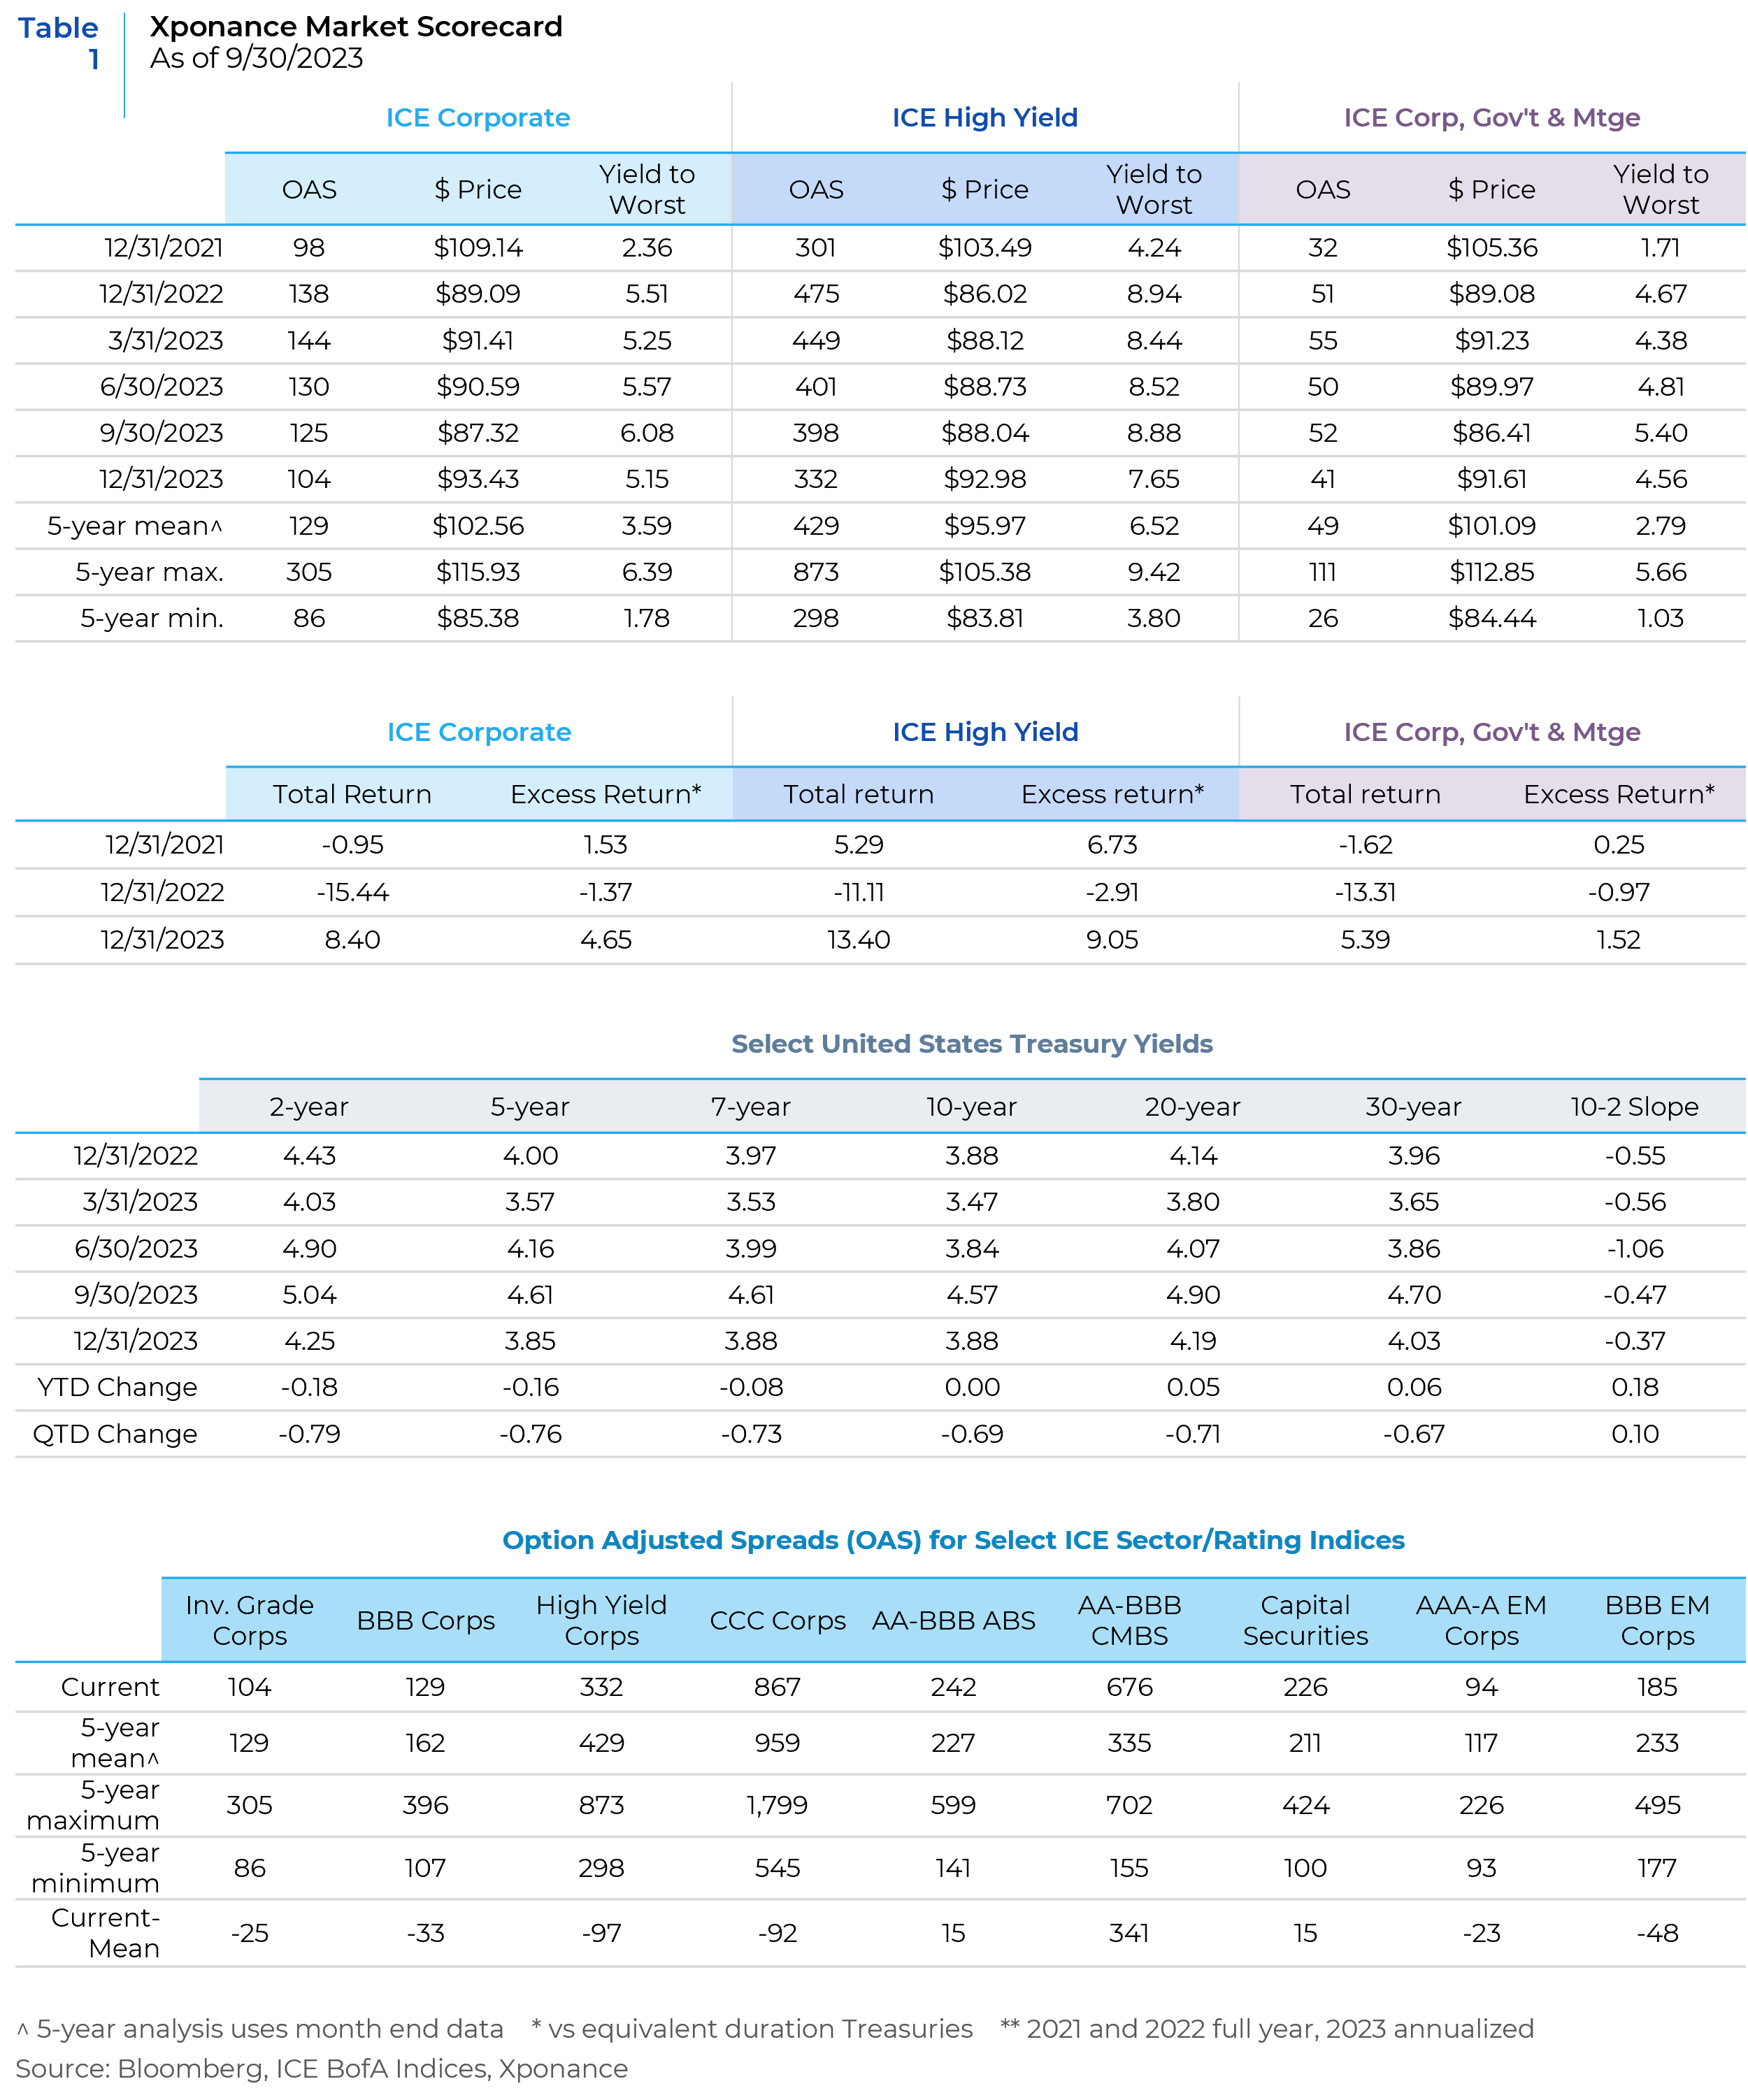
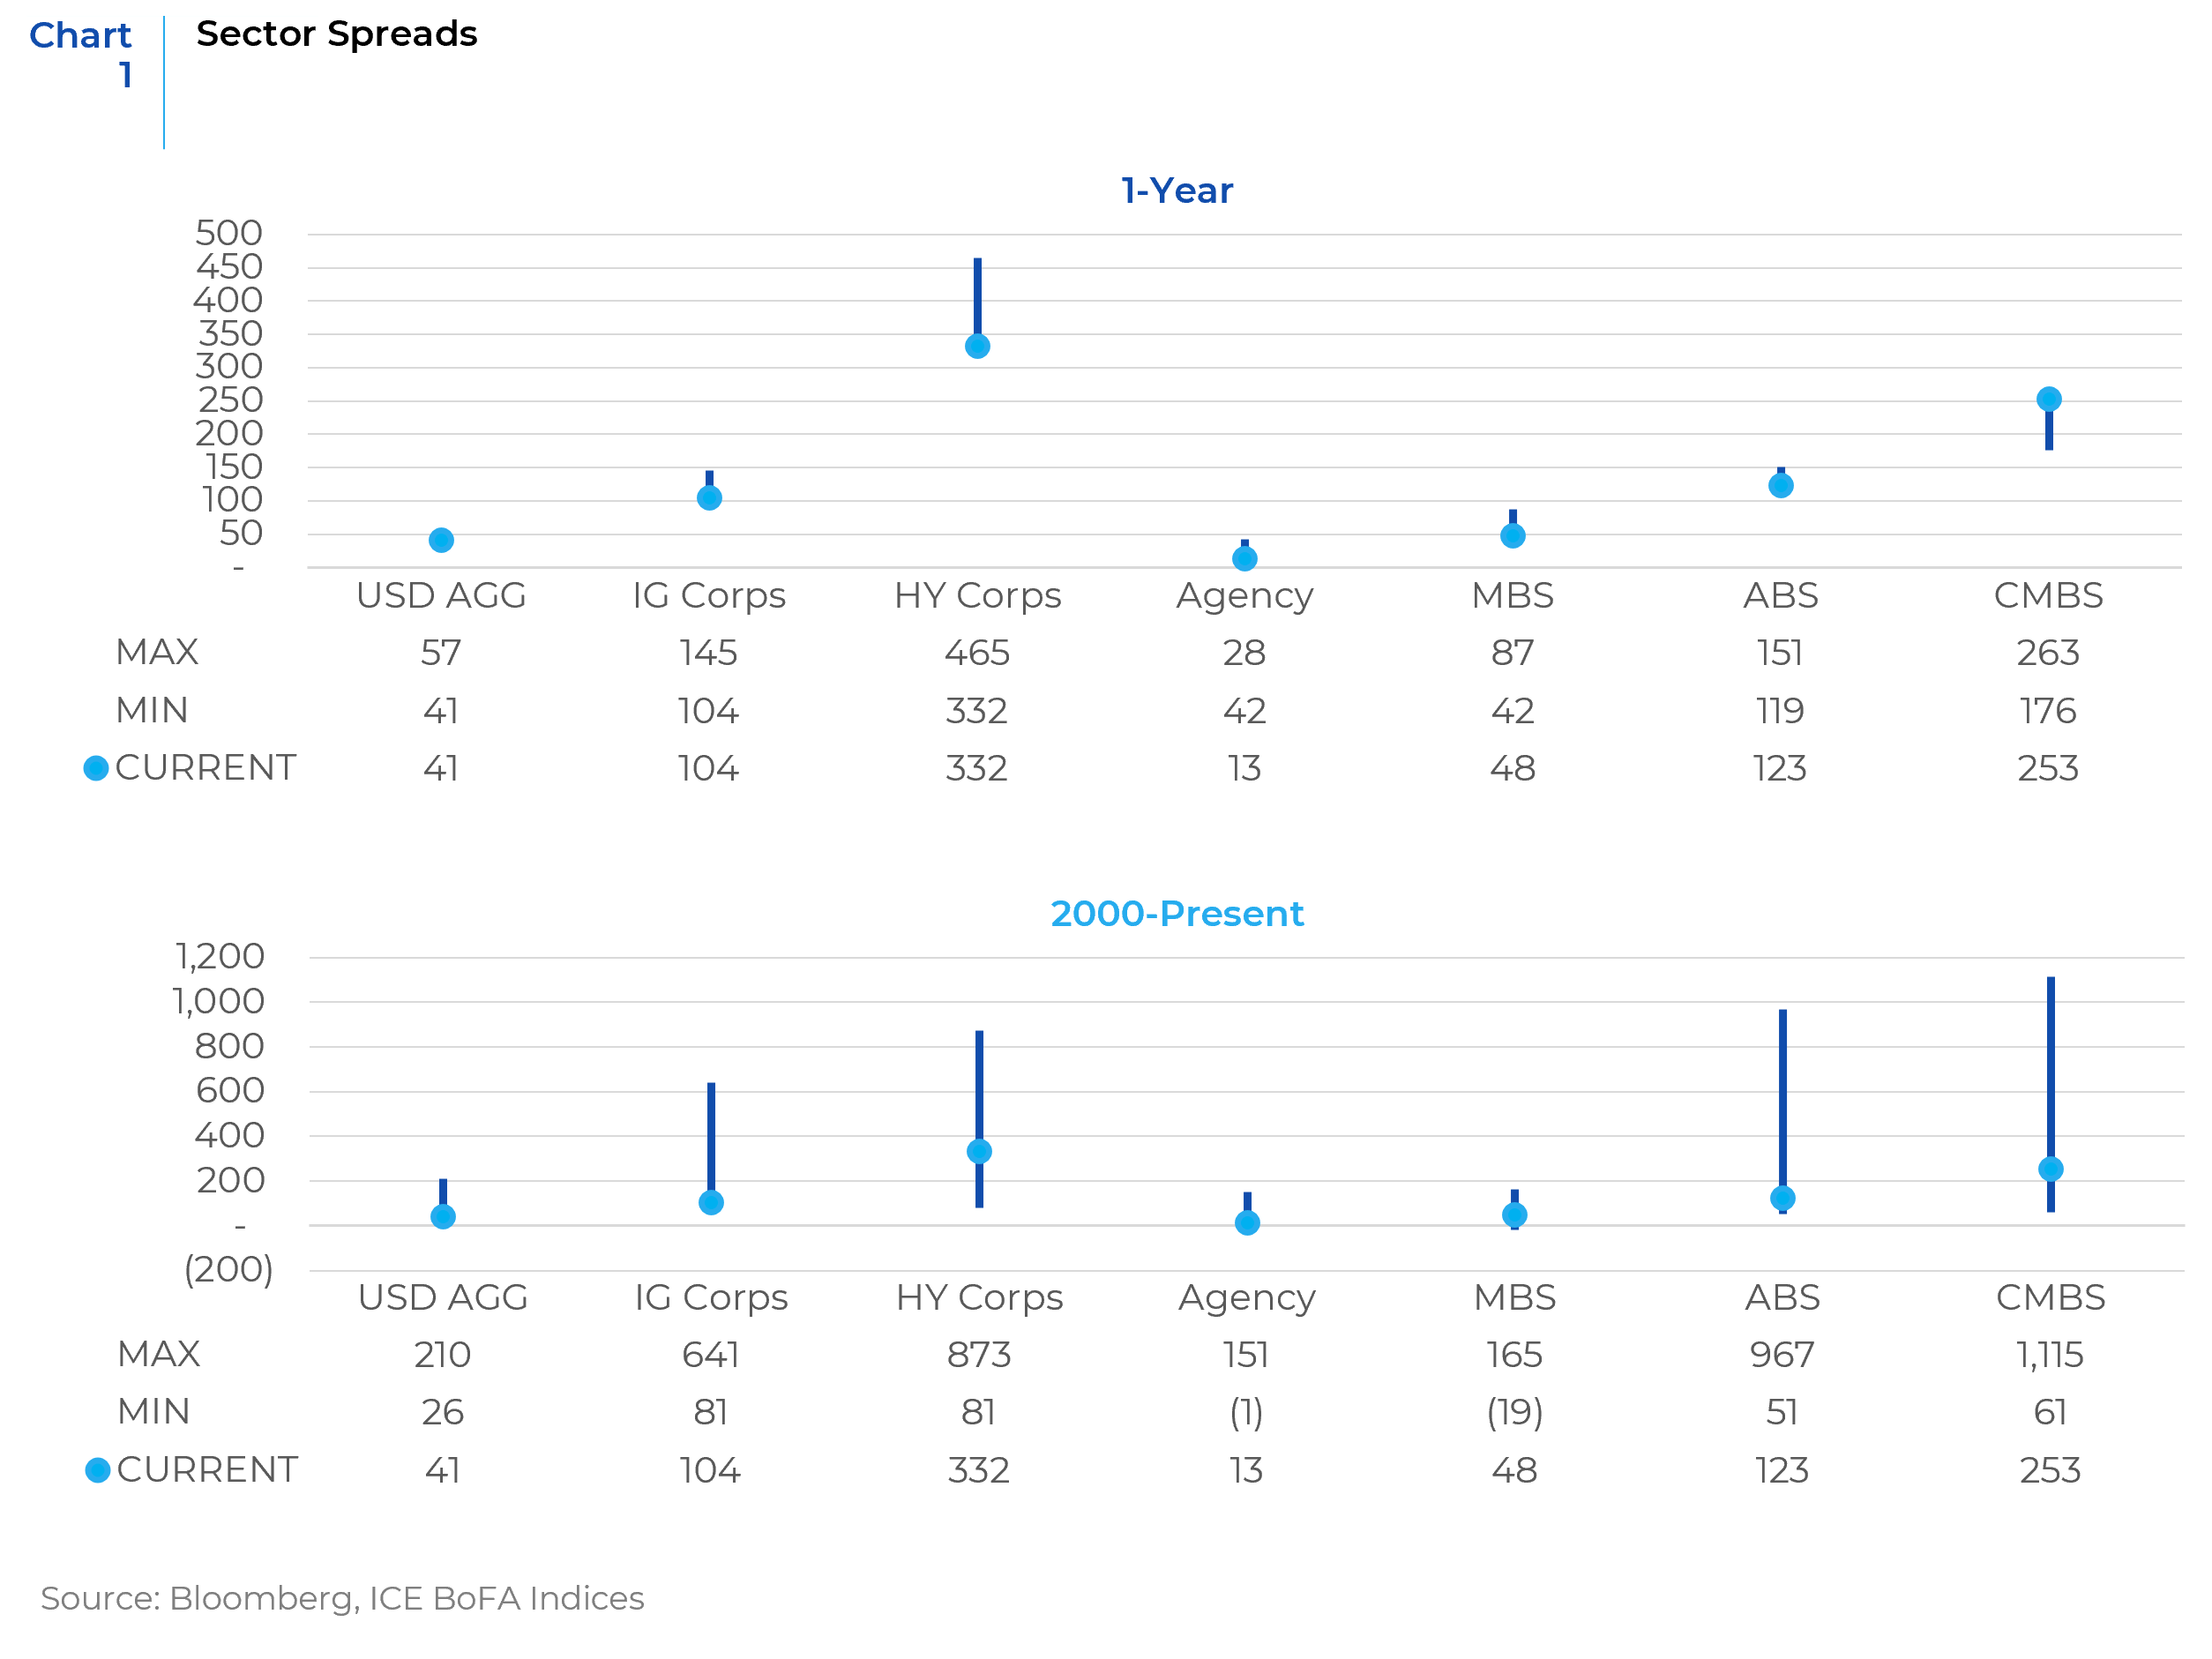
Finally, we examine a range of spread indicators against fundamental data to analyze relative value against this macro backdrop. Spread curves, for example, are very flat and with overall spreads at a very low (expensive) level which is more indicative of risk appetite and momentum rather than fundamental strength in credit quality. Fundamental credit metrics have been weakening at the margin and indicate a downward ratings migration for credit.
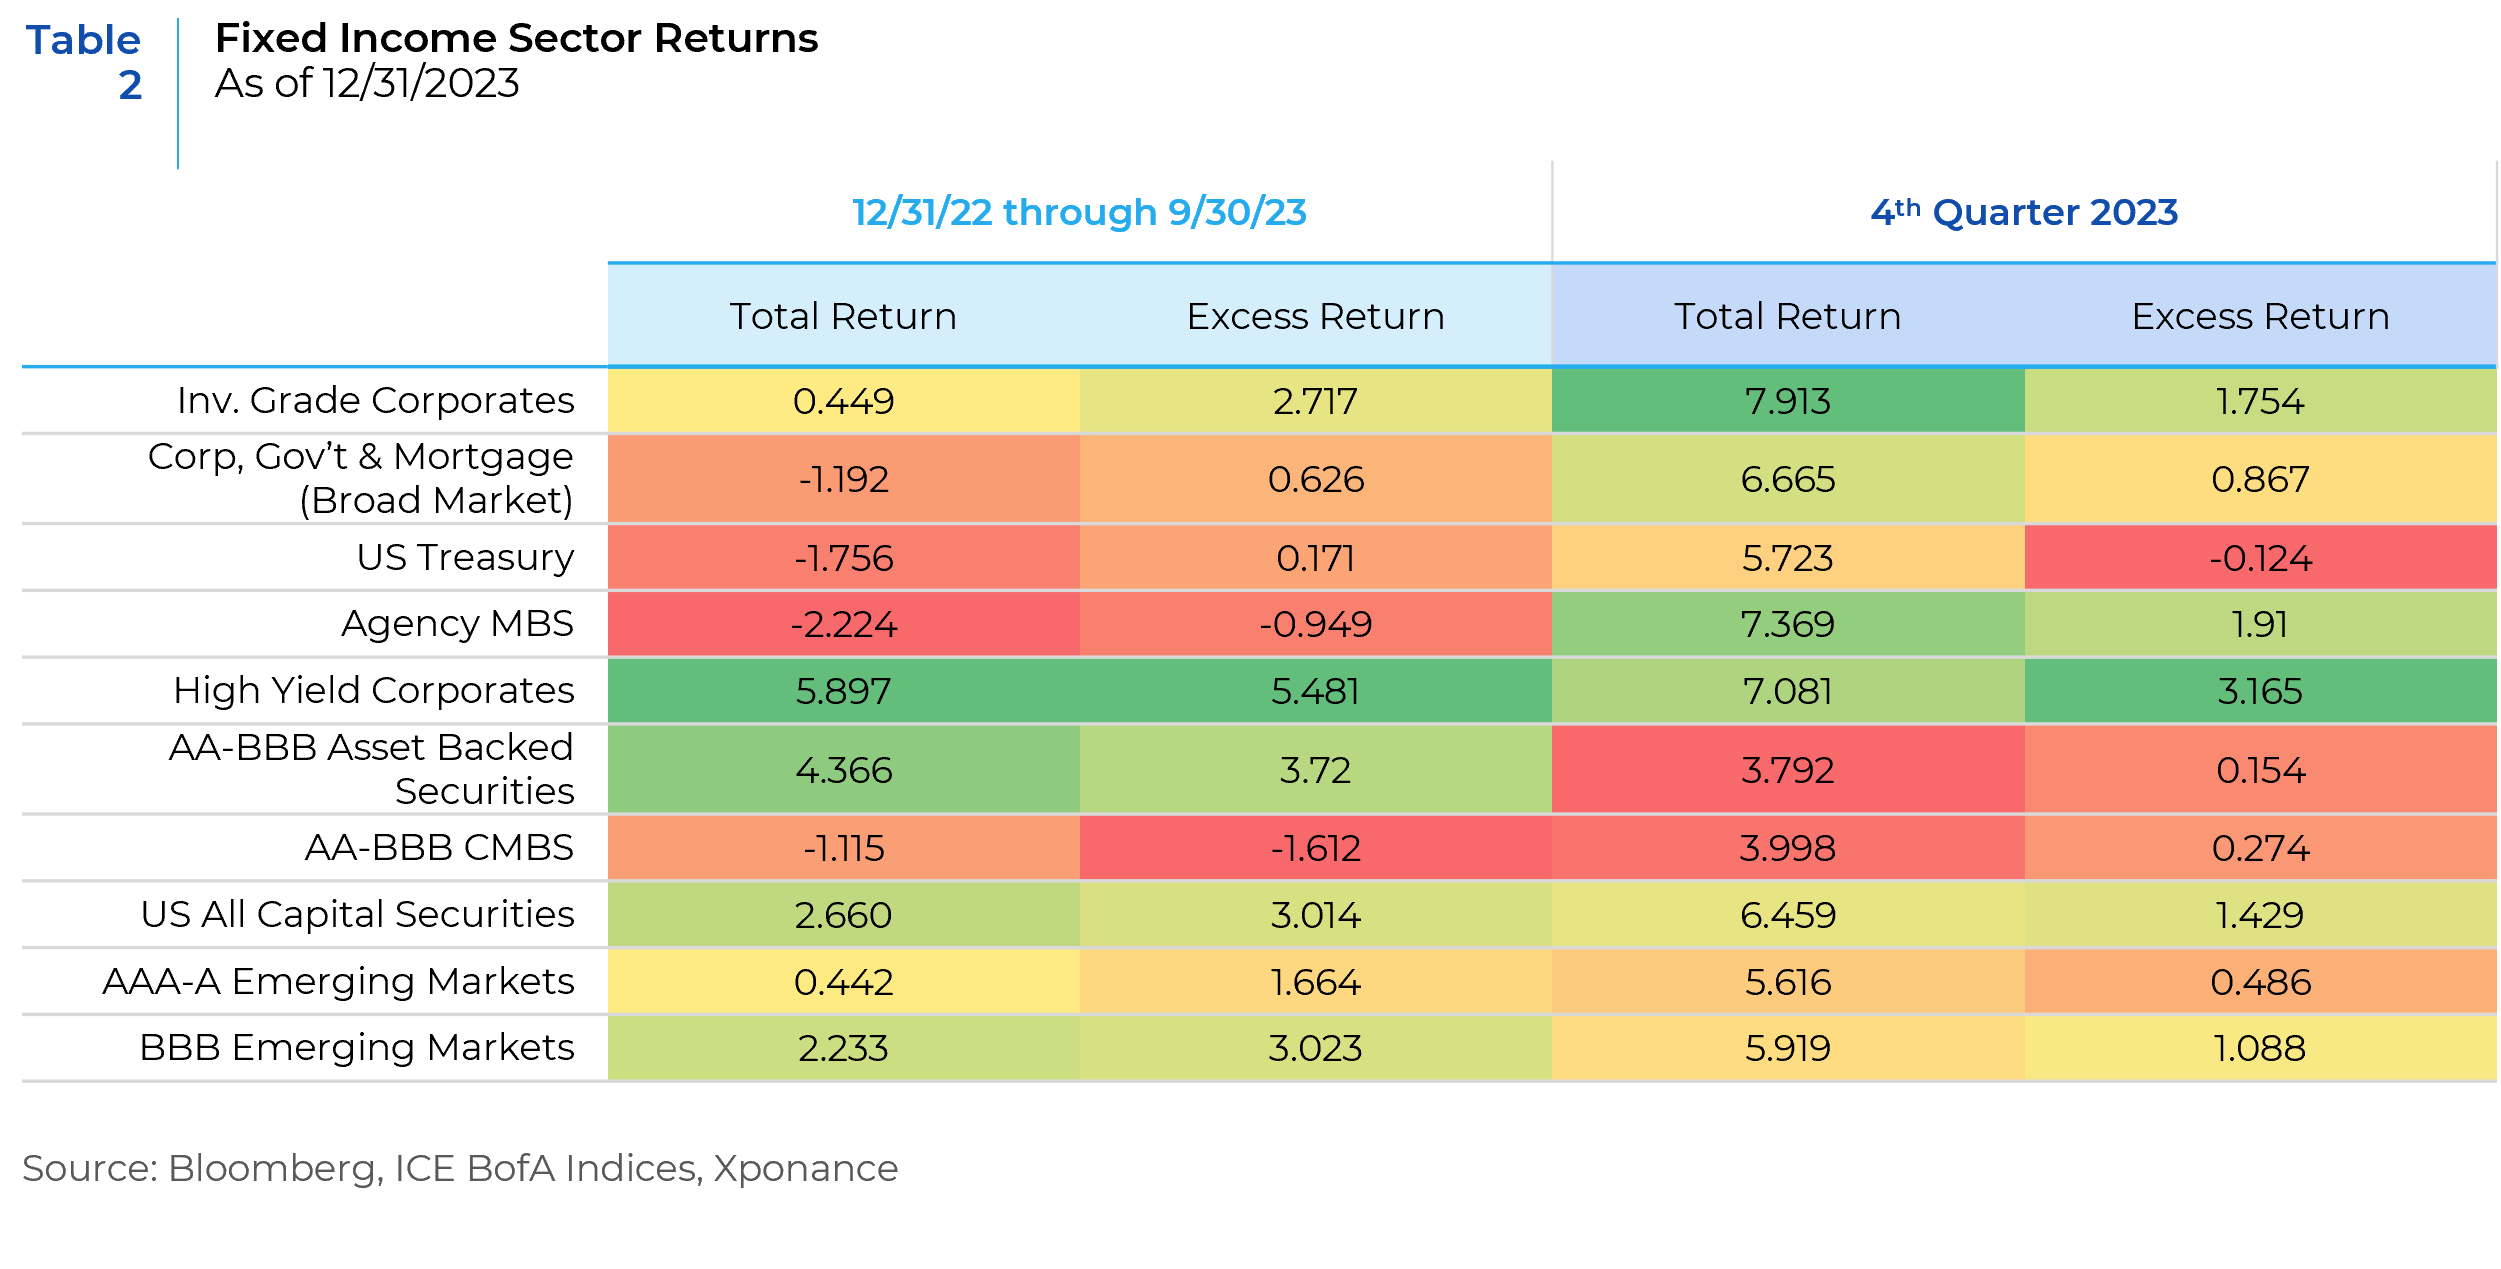
The final quarter of 2023 saw a significant run-up for risk assets across the fixed income spectrum, especially after Fed Chair Jerome Powell’s very dovish comments on December 13th (which other Fed officials spent much of December trying to downplay). Given the carnage fixed income has witnessed for much of the period since the Federal Open Market Committee (FOMC) began increasing rates in 1Q22, this was a welcome development for market participants and certainly asset owners and allocators. Despite the “higher for longer” rate narrative through most of 2023, high yield was the star performer both in the first three quarters of the year and tacked on strong fourth quarter performance as well. As shown below, investment grade corporate returns were much more muted through 9/30 but a combination of duration and spread tightening conspired to supercharge 4Q23 total returns. Agency MBS saw a significant turnaround in the 4th quarter, as spreads had widened quite dramatically earlier in the year (especially for such a high-quality asset class). Performance through 9/30 was meaningfully negative for MBS on both a total and excess-return (i.e. versus equivalent duration Treasuries) basis but mortgage-backed securities topped the 7% total return mark in 4Q23. Credit CMBS turned marginally positive for the year but was still a major laggard as compared to other market sectors.
When we think about the rate cut narrative which has moved from “higher for longer” to futures-based expectations of 150 basis points of cuts before the end of 2024, we believe the market is well ahead of itself, especially with labor market indicators remaining relatively robust. Moreover, while inflation has clearly been on a downward trajectory, various indicators of “sticky inflation” (including the Atlanta Fed’s sticky inflation data series) suggest the movement down to the Fed’s target level of 2% will likely be slower than the moves to this point. When housing is excluded, these measures do look more muted (in fact, the Fed’s preferred inflation measure, PCE, has a smaller weighting to housing than the more commonly quoted CPI). But housing is a major component of inflation expectations, and inflation expectations are part of the Fed’s calculus about slaying inflation. With FOMC expectations of 3 cuts for the year and the market at 6, we believe reductions in the Federal Funds rate will occur but will likely occur later in the year than the market is currently anticipating and at a smaller magnitude.
Against this economic and interest rate backdrop, we have examined various measures of credit spreads across the corporate market and against weakening fundamentals for aggregate credit quality. While credit has not deteriorated precipitously, net balance sheet leverage (i.e. inclusive of cash) has been creeping higher over the past several quarters. And interest coverage has, not surprisingly given the increase in rates, been falling. The downgrade to upgrade ratio across the investment grade market was nearly two to one in 2023 when looking at the two major rating agencies. And 2024 is expected to see a similar ratio. Similarly, cumulative 12-month default rates (while remaining low by the standards set during major recessionary periods) finished 2023 at 2.7% (according to data compiled by Bloomberg Intelligence, BI) as compared to 1% at year-end 2022. The post-pandemic peak using BI methodology was 6.2% in January 2021, but this compares to cyclical highs in the low double-digits during both the 2007-2009 recession and the 2001 recession.
What are credit spreads telling us with this weaker but relatively benign credit quality picture? Credit curves have become very flat (i.e. longer dated maturities offer very little extra spread compensation as compared to intermediate or short maturities). From a risk premium perspective, investors are therefore not paid for taking spread duration risk in credit. The obvious trade here is to move into the belly of the credit curve and wait for both credit curves and the Treasury curve to steepen out and then reverse the trade. To put this in context, both the BBB-rated and A-rated credit curves (defined as the 15+ index OAS less the 1-3 index OAS) look very flat relative to history going back to 12/31/2005 (in the run up to the Global Financial Crisis). Further, in the investment grade space, the ratio of single-A spreads to the broad corporate index spread looks slightly cheap compared to the longer-term mean, while BBB-rated credits look expensive based on the same measure. These two broad ratings categories make up 43.6% and 47.2%, respectively of the ICE BofA corporate index. In high yield, we see a different pattern. BB-rated credits (i.e. the highest quality rung of high yield) look as expensive on a ratio basis compared to the long-term mean as they have since before the pandemic. Meanwhile, CCC-rated credits (the lowest rung of non-defaulted securities, with a 5-year likelihood of default in the 50% range) look cheap when applying this same analysis. Nonetheless, this relationship for CCCs is appropriate given the default dynamics we discussed above. When looking at absolute spread levels, credit in general (whether high yield or investment grade) looks expensive by historical standards. From a trading perspective, then, where do opportunities lie? Clearly, single-A corporates provide an opportunity for defensive yield against an uncertain economic backdrop. BBBs look overbought to us, though pockets of value remain. For example, underfollowed higher beta names in some cyclical sectors are cheaper in the BBB space than similar maturity high yield names, especially for short-dated paper. Similarly, preferred and hybrid securities for high grade issuers (i.e. below investment grade bonds of investment grade issuers) provide a similar yield advantage. For an investor that can invest in both investment grade and high yield securities, we would avoid most of the BB space, given the relative richness of these bonds as well as the floor on spreads these issues have without an upgrade to investment grade. An exception to this is the energy space, where upgrade activity from high yield to investment grade is expected to occur for structural reasons.
In conclusion, we continue to believe that, while signals from the fixed income market are mixed, caution is still the order of the day. The good news is, with absolute yields remaining at attractive levels as compared to much of the era of Zero Interest Rate Policy, we can construct a reasonably defensive portfolio while still garnering a nice yield advantage relative to both broad market benchmarks and this recent history. As we have discussed, we expect the Federal Funds target rate to be lower at year-end than it is today. While we disagree with the market about what this level will be by the end of the year, we think there will be a reduction in short rates while the Treasury curve should be steeper in this monetary policy environment. Given our cautious view about the economy, we have identified investment tactics and strategies that we think will outperform against this view. Portfolio construction is much different now than a year ago, but durable yield advantaged portfolios are still achievable even while moving into higher quality securities in the “belly” of the maturity curve. Reducing credit beta by changing the composition of the underlying spread duration in the portfolio is the most obvious way to express this view. This should also position the portfolio to move back to a more aggressive positioning when credit curves and spread relationships normalize. We expect 2024 to be another volatile year given the changing but uncertain monetary policy regime, compressed risk asset valuations, and high and potentially rising geopolitical risks. While we do not know what 1Q24 will hold, the next version of this piece will likely be discussing a much different valuation landscape. Stay tuned!
This report is neither an offer to sell nor a solicitation to invest in any product offered by Xponance® and should not be considered as investment advice. This report was prepared for clients and prospective clients of Xponance® and is intended to be used solely by such clients and prospects for educational and illustrative purposes. The information contained herein is proprietary to Xponance® and may not be duplicated or used for any purpose other than the educational purpose for which it has been provided. Any unauthorized use, duplication or disclosure of this report is strictly prohibited.
This report is based on information believed to be correct, but is subject to revision. Although the information provided herein has been obtained from sources which Xponance® believes to be reliable, Xponance® does not guarantee its accuracy, and such information may be incomplete or condensed. Additional information is available from Xponance® upon request. All performance and other projections are historical and do not guarantee future performance. No assurance can be given that any particular investment objective or strategy will be achieved at a given time and actual investment results may vary over any given time.