
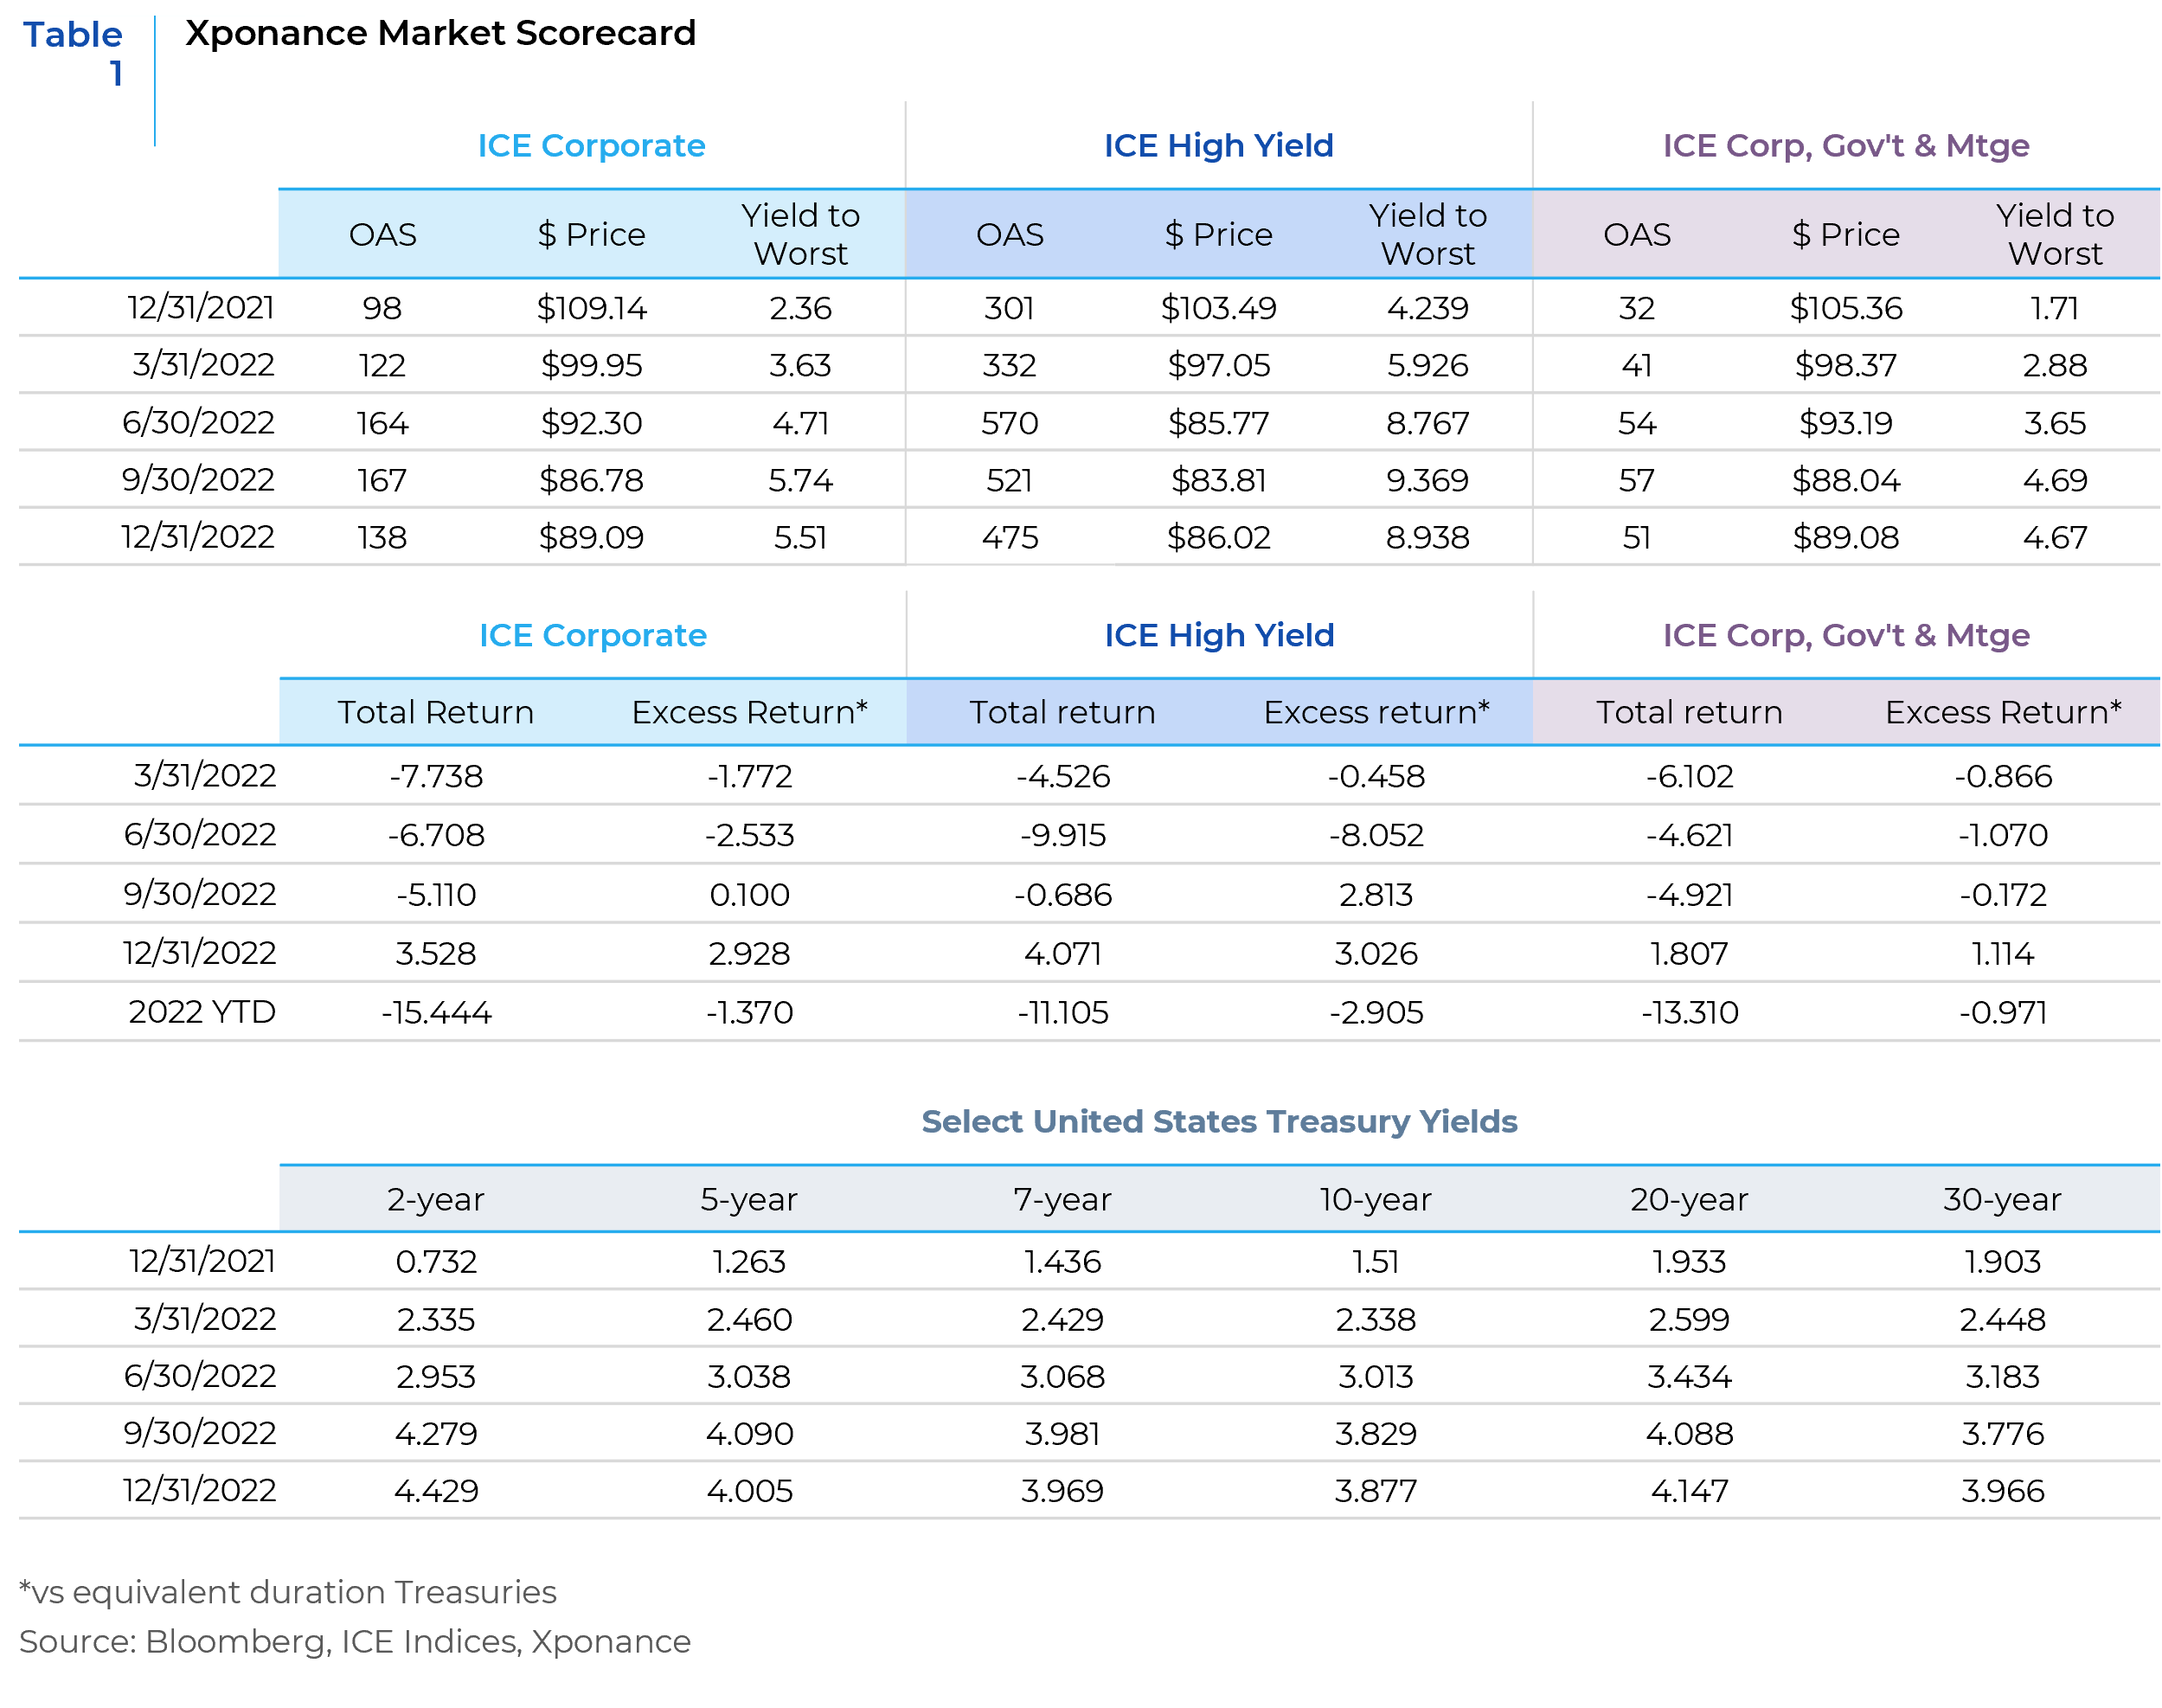
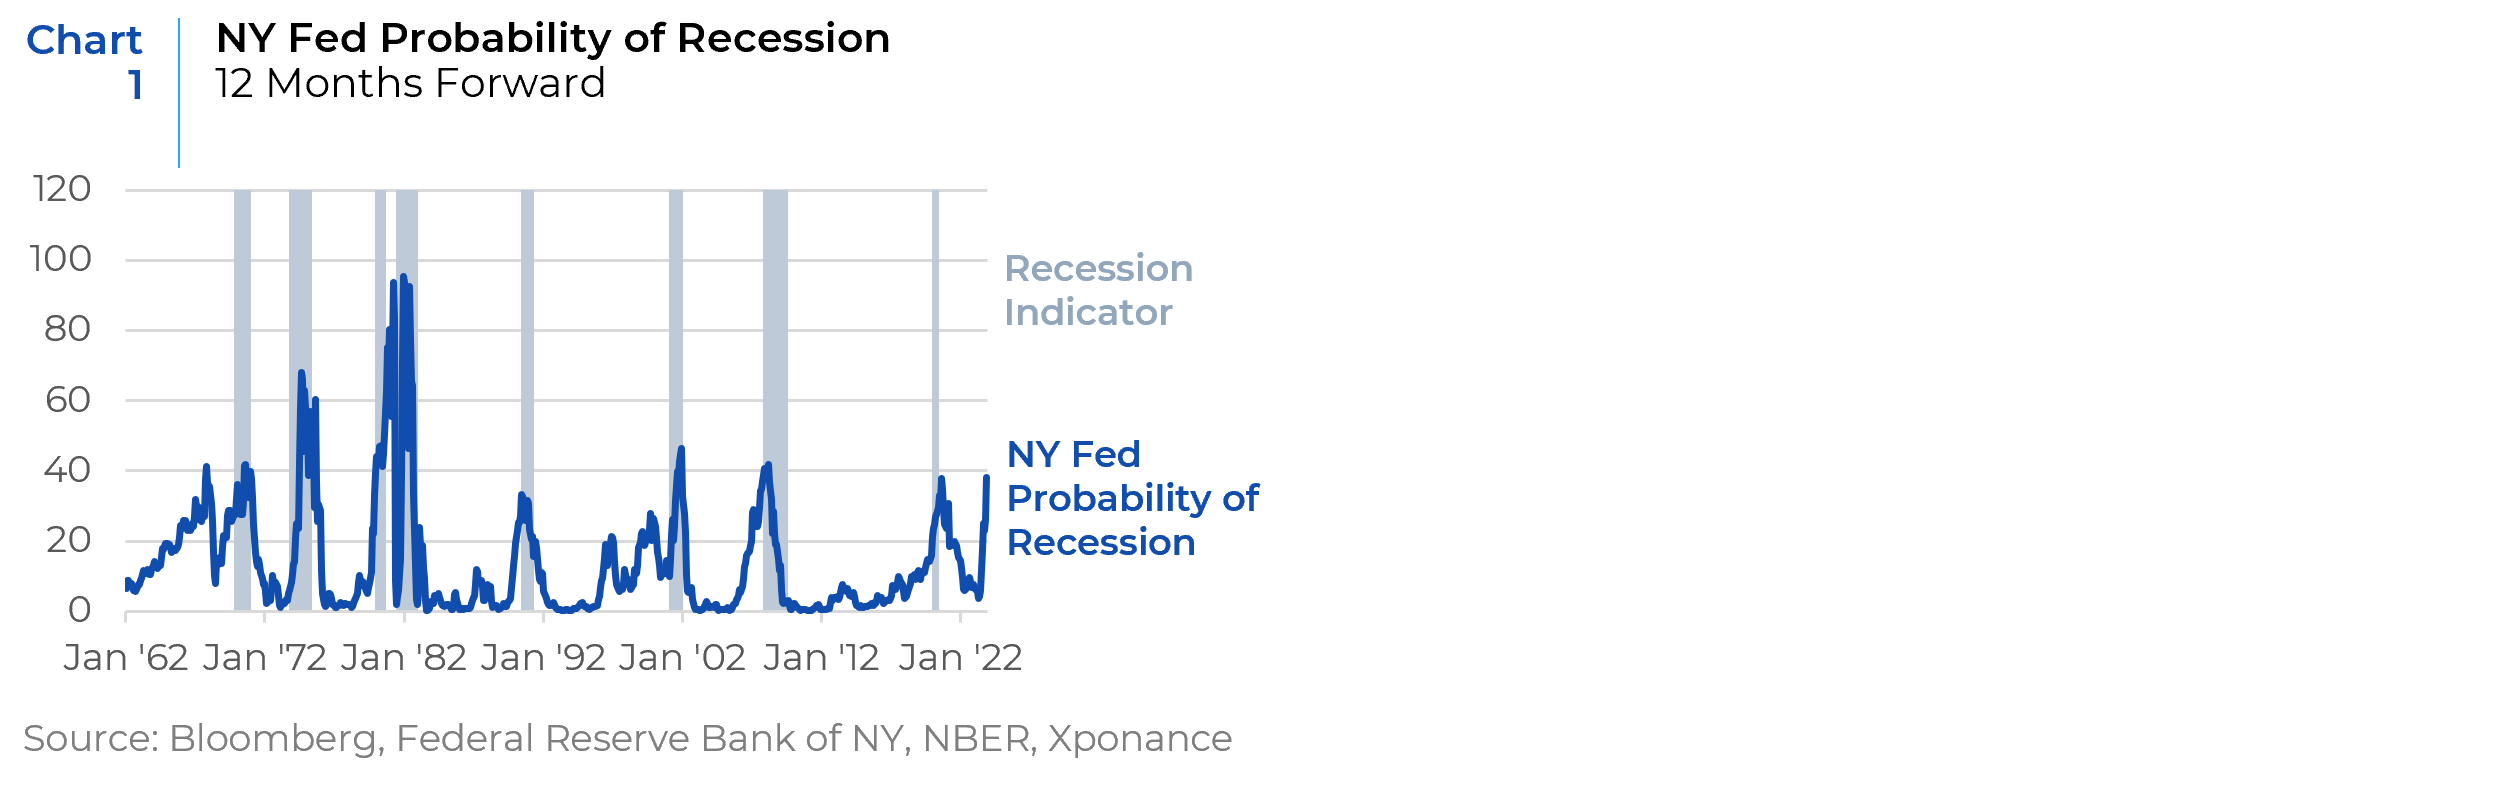
To summarize the perspective provided in this outlook, we believe 2023 will likely be a tale of two halves. Given the continued strength in the labor market, we do not think that recession (assuming it occurs) will happen early in the year and that should it occur, it will be mild. The New York Fed’s model for forecasting the probability of a recession over the next 12 months (based on the slope of the 10-year minus 3-month T-bill), currently stands at 38% (a level which has ultimately predicted an economic downturn). (See Chart 1). With respect to credit spreads, we do not believe current levels are pricing in a contraction in GDP for even a non-recessionary slowdown. Current spreads and yields do, however, provide a buffer against further increases in spread or yield before total returns are impacted and we would note that investment grade spreads are more fairly valued than high yield at this juncture. For now, the trading playbook and portfolio positioning remains similar to much of 2022. We continue to believe that maintaining a defensive posture from a sector and curve perspective will preserve capital and allow for rotation into relatively cheaper assets as the year moves forward. There will be a time when fixed income investors are paid to take more risk in a variety of ways but given the relatively juicy yields we can achieve without taking undue risk in an uncertain environment, patience is the order of the day.
Now that we have put 2022 in the rear-view mirror, we can now look ahead to what 2023 holds. During the fourth quarter, we had many conversations with clients, prospects, and other market practitioners that seemed to coalesce around variations of the same broad themes. Will a recession occur and what will it look like (specifically in the US, but also globally)? If a recession does occur, what direction and level will interest rates take? Are risk premia in the spread markets appropriately priced for the outlook? And the last question we heard often is what do we anticipate for fixed income performance over the course 2023?
On the recession question, the obvious answer is that the inversion of the yield curve is a historically tried and true indicator of impending recession. As is often the case when a yield curve inversion occurs, various market commentators have tried to theorize as to why the indicator no longer has useful predictive power. While we ultimately disagree with this notion (we will call this the “soft landing” camp), we are sympathetic to the idea that the economy was on solid footing prior to the onset of large interest rate increases. After nine months and 425 basis points of tightening, however, much of the incoming economic data is clearly showing a slowdown in pockets of the economy. Labor market indicators (which are by their very nature coincident, rather than leading, data points) have remained robust, however, and play into the “soft landing” narrative. Rate increases of this magnitude and speed from the Federal Open Market Committee (FOMC) are unprecedented. Given that monetary policy works with a “long and variable lag” a significant slowdown in economic activity seems to be a reasonable assumption and the lag effects mean that we have not seen the full economic impact of the hiking campaign. If a recession does occur, it does not necessarily need to be either deep or protracted, however. The current strength of the labor market (and the desire of many employers to hold on to workers so as not to be left without them when these workers are needed) suggests the likelihood of a mild recession. Moreover, it does appear that the worst-case economic scenario for Europe as a result of the Russian invasion of Ukraine may have been avoided for now, and the end of the Covid Zero policy in China could also help the global economy weather the storm. Obviously, a long period of zero interest rates and quantitative easing may have created conditions for more damaging underlying issues within the economy and markets, but this is not our base case. We are concerned about unexpected linkages between financial markets and the real economy that have been distorted by monetary policy. Mortgage origination, for example, is now almost entirely conducted by non-bank entities that rely on wholesale funding and securitization of mortgages to keep the origination machine operating. With the yield curve inverted and choppier capital markets, trouble could be brewing for what has been a relatively untested business model (in a different guise than existed during the housing and mortgage crisis that precipitated the GFC). Nonetheless, we will explore what could happen should a more conventional recessionary outcome prevail.
Rather than focusing on the current level of inversion of the curve (in this case the 10-year minus 2-year and 30-year minus 2-year), we look ahead to what the slope of these curves look like as the recession takes hold. Typically, curves will begin to re-steepen even before the economy is in recession. While the official start date for recessions by the National Bureau for Economic Research (NBER), is called ex-post, economic data paints a clear picture during the recession itself. Generically, the 10s/2s curve steepens to above 200 basis points as the recession begins and the 30s/2s curve moves above 300 basis points. These curves will become positively sloped even before the FOMC begins to cut rates (as the economic data turns unambiguously negative). Clearly, the rate on the 2-year Treasury note is the coupon Treasury (distinct and separate from Treasury bills) that most closely reflects FOMC policy rates. (See Chart 2)
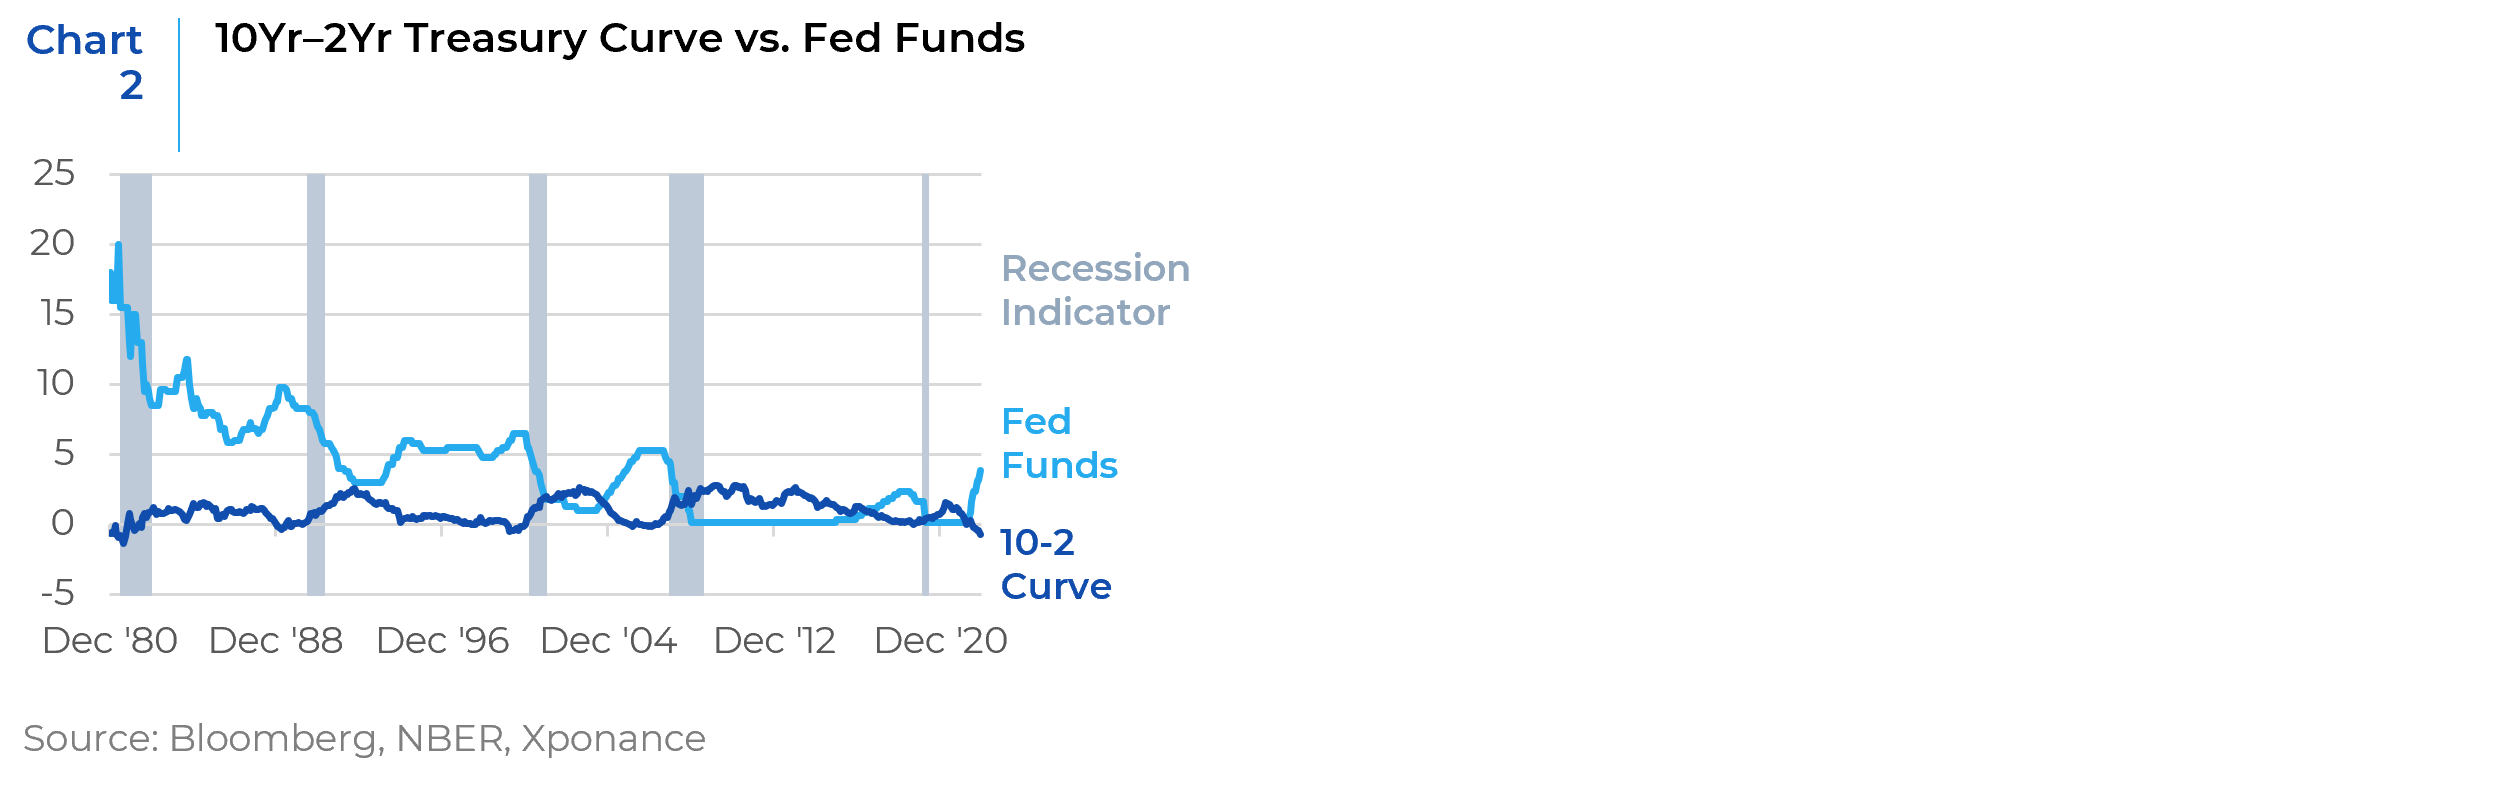
We start with an assumption that the terminal Fed Funds rate will end up around or slightly above 5% (which seems reasonable according to futures-based market expectations, surveys of economic observers, and projections of Federal Reserve policymakers). Historically, this has meant that the 2-year will briefly approximate the same level as Fed Funds before beginning to fall ahead of the actual policy rate moving lower. The Fed Funds target rate is currently already at the highest level since the run-up to the Great Financial Crisis (GFC) over 15 years ago. But during that period, the inflation backdrop was lower than it is today but higher than the struggle to reach 2% that occurred for much of the post-GFC period.
During the post-GFC era of free money and low inflation, investors broke from history and no longer demanded a term premium or positive real interest rates. Going forward, we believe that, when the FOMC ultimately does begin to cut rates, the lower bound will not approach zero again for several reasons. These include a much different global backdrop (i.e. far fewer deflationary tailwinds from globalization and a different global trade regime) and a recognition on the part of policymakers that the zero interest rate policy (ZIRP) caused significant distortions in both capital markets and the real economy (examples of which include cryptocurrency for the former and another era of companies with growth but slim or negative margins for the latter). As such, we believe that a new floor for the Federal Funds rate will be well above zero. For the purposes of this discussion, we will use 2% as a floor for Fed Funds (approximating the previous FOMC inflation target). If this turns out to be the case, then a 2s/10s curve of 200-plus basis points implies a 10-year Treasury at or above 4% as a recession takes hold. The same analysis of the 2s/30s curve would put the long Treasury bond above 5%.
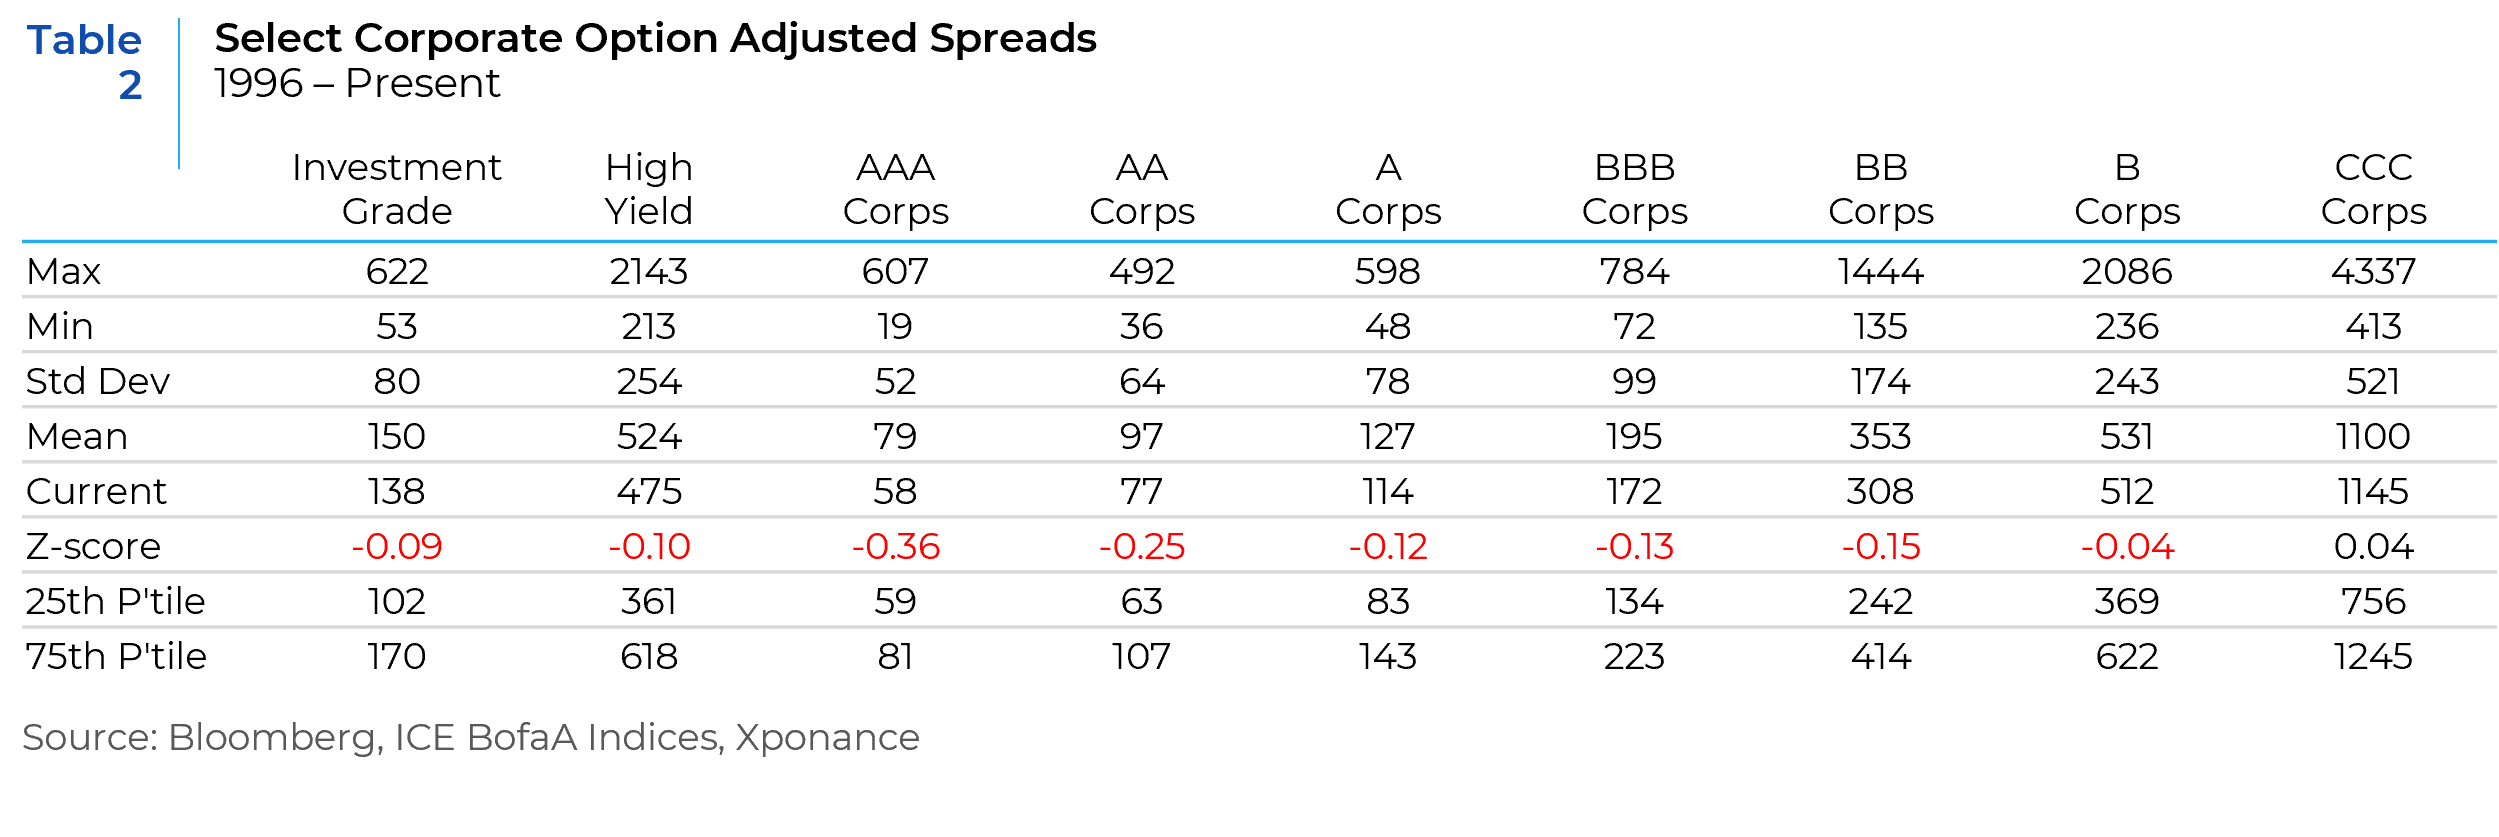
Moving on to credit spreads, we do not believe current levels of spreads are pricing in the fundamental deterioration in credit quality that occurs as GDP contracts. Further, while credit curves are mildly positively sloping, we expect them to steepen further (on a spread basis but also on an absolute yield basis as credit curves steepen and the Treasury curve steepens as well). While credit yields (including corporate bonds but also the broader credit categories, such as municipals and sovereigns/supranationals) are beginning the year at much more enticing yields than we have seen in quite some time, we expect a more attractive entry point for these and other spread sectors as the year moves on. With current corporate spreads around 140 basis points for investment grade and 475 basis points for high yield, these are at best fair value relative to their historical range since 1996 (when spread data first becomes available). (See Table 2). In the aftermath of the mild 2001 recession, for example, investment grade spreads peaked at over 260 basis points during 2002, while high yield peaked above the 1000 basis point level. During the GFC, investment grade spreads climbed to over 620 basis points, while high yield spreads rose above 2000 basis points. While we do not expect anything approaching what we witnessed during the GFC, current spread levels are not consistent with elevated levels typically seen during a mid-cycle slowdown without a recession. Current spreads and yields do, however, provide a buffer against further increases in spread or yield before total returns are impacted. We would note that investment grade spreads are more fairly valued than high yield at this juncture, but both have room to widen.
Where does this leave us as far as our outlook for 2023? We have discussed the heftier yields on offer across US domestic fixed income but to put this in context (in data going back to 1985) we began the year at the highest yield for the broad market since 12/31/2007. 2008 began with a yield of 4.81%, whereas 2023 began with a yield of 4.67%. Not only is this the highest starting yield since 2008, but the market has only started a year above 3% twice since 2009 (the other being 3.3% to begin 2019). If we couple this fact with the idea that most of the FOMC’s interest rate increases are behind us, market conditions are starting from a much healthier place where income can actually contribute to total return over the course of the year. The question really becomes one of assessing the pace of decline in economic data and the market’s reaction to both data and sentiment. Consistent with history, the yield curve will likely begin to price in recovery before risk assets will follow. The relationship between the shape of the Treasury curve and the level of credit spreads looks different now than in past periods, however, and this is the tension with which fixed income investors must contend. Given the level of inversion in the Treasury curve, credit spreads would typically have already begun to widen, a condition that would normally continue until well after the Treasury curve re-steepened. While credit risk premia did move wider for much of last year before tightening in 4Q22, it is highly unusual for the Treasury curve to signal economic slowdown while credit spreads are pointing toward recovery. Not only does this fly in the face of historical valuation data, but it makes little sense from a real-world perspective. Fortunately, prudent positioning for a steeper yield curve should also allow us to play defense in risk assets including (but not limited to) corporates. Moreover, even though fixed income risk assets are all highly correlated, individual bonds with fundamentally improving prospects can still meaningfully outperform the broader market during periods of weakening fundamentals. Therefore, we expect fixed income performance in 2023 to be driven by the resolution of the broad Treasury/risk asset conundrum as well as careful sub-sector positioning combined with an even greater emphasis on fundamental analysis.
This report is neither an offer to sell nor a solicitation to invest in any product offered by Xponance® and should not be considered as investment advice. This report was prepared for clients and prospective clients of Xponance® and is intended to be used solely by such clients and prospects for educational and illustrative purposes. The information contained herein is proprietary to Xponance® and may not be duplicated or used for any purpose other than the educational purpose for which it has been provided. Any unauthorized use, duplication or disclosure of this report is strictly prohibited.
This report is based on information believed to be correct, but is subject to revision. Although the information provided herein has been obtained from sources which Xponance® believes to be reliable, Xponance® does not guarantee its accuracy, and such information may be incomplete or condensed. Additional information is available from Xponance® upon request. All performance and other projections are historical and do not guarantee future performance. No assurance can be given that any particular investment objective or strategy will be achieved at a given time and actual investment results may vary over any given time.