
As we put 2020 firmly in the rear-view mirror, we simultaneously contemplate the state of fixed income markets as we head into 2021. We spent much of our commentary budget last year discussing the massive dislocation and subsequent recovery in fixed income markets while also viewing these from a historical perspective. Much of the past year has seen Federal Reserve officials talking about the notion of keeping monetary policy ultra-loose for an extended period, in terms of leaving the policy rate near zero, continuing asset purchases, and allowing inflation to “run hot” (meaning above the 2% “target”). Rate increases were said to be several years into the future according to Fed officials’ own projections. Discussion of “yield curve control” (i.e. targeting longer-dated US Treasury purchases to keep longer term interest rates low) was a breathless topic in the financial press and lightly touched in Fed speeches and interviews. Now, the topic has turned to “tapering”, or the idea that Federal Reserve asset purchases (of both US Treasuries and agency mortgage-backed securities) will decrease as a form of reducing monetary accommodation. To be sure, this is a market reaction to both the significant increase in inflation breakeven rates as well as perceptions of further stimulus and altered spending priorities with unified Democratic government. Further, some Fed officials seem open to the idea. We would note, however, that employment data has weakened in the face of the post-Thanksgiving COVID resurgence, and while inflation will appear high owing to “base-effects” (comparisons to last years’ COVID influenced disinflation) the Fed has been trying to stoke inflation for the better part of a decade. Moreover, surely all Fed officials will recall the “Taper Tantrum” in 2013, and a similar episode today could imperil the recovery. Recall that 10-year Treasury yields increased from the 2013 low of 1.63% to 3% in both September and then again in December after a brief rally in the interim.
Despite calls from Chair Powell and other Fed officials for continued fiscal stimulus to support the Main Street economy and individuals/small businesses that are largely left behind by traditional monetary policy mechanisms, the likely culprit behind the taper talk is the overall size of the multiple rounds of stimulus relative to the overall economy. The most recent headlines suggest a headline price tag of $1.9 trillion for another round of stimulus (at least as a starting point for negotiations), on top of the original CARES act ($1.8 trillion) and the more recent package of $900 billion. In round terms, this puts the total stimulus, above and beyond normal government outlays, at $4.6 billion or nearly 22% of GDP. To put that in perspective, total government outlays have been running at about 20% of GDP for the past several years, which would mean total government outlays are on pace to be nearly double the recent historical run rate. This would also be by far and away the largest spike in government outlays relative to GDP since World War II, which also saw the largest deficit spending in the history of the republic.
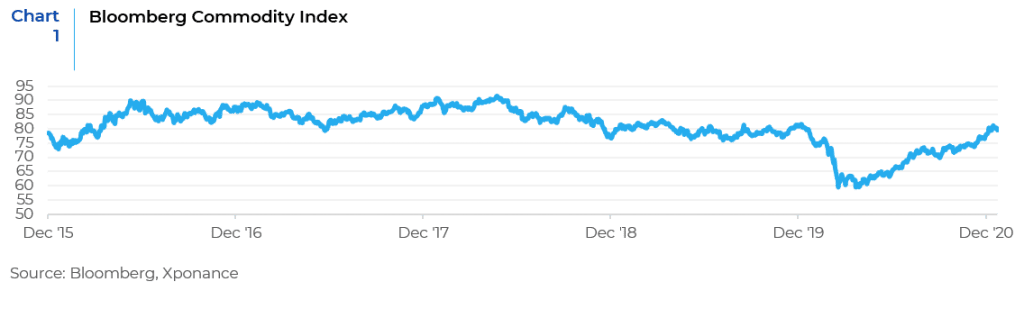
Against this backdrop of both stimulus in the economy and the debt issuance required to support it (a recent favorite topic of our outlooks) what are the implications for fixed income markets? On the one hand, the sheer amount of money being injected into the economy should do more than just stimulate financial markets alone. And, while economic data is currently looking sickly, especially with weak to negative job formation and incredibly elevated unemployment claims, a return to some sense of pre-COVID normalcy should clearly unleash pent-up demand across a range of economic categories. So, the idea of a reopening and reflation trade seems to be at hand. But much of this has already occurred. TIPS break-evens recently reached the highest level since 3Q18, WTI crude has climbed back from the (briefly) negative level of April 2020 to above $50, and other commodity prices have climbed as well (see chart). In corporate bond land, December sector returns were led by some of the worst-hit sectors, including oilfield services, pipelines, leisure, and energy exploration and production. This is either the reflation trade in full swing or a classic low-quality rally as investors reach for yield.
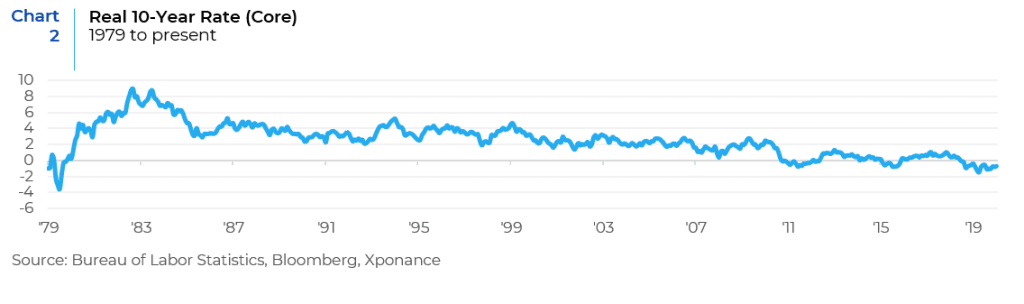
So where does that leave fixed income returns and sector leadership? Clearly, there are two primary questions for 2021. First, the magnitude (and directionality) of changes in interest rates. Given the discussion above, one would expect rates to move higher. Some of this has already occurred, but we would note that economists and market participants almost universally call for higher rates each time we enter a new trading year. The broadly deflationary forces of the last thirty years have generally proved this to be incorrect, as we all know. Prior to the great moderation in inflation, investors demanded a significant real return to make up for inflationary risks and the to compensate for the recent memory of inflationary outbreaks. Yet investors have now grown accustomed to accepting either negative or zero real return on their fixed income portfolios. The last two years have masked this phenomenon, as price appreciation has made up for the lack of yield and income in fixed income markets. We would be wary, if there is a breakout of inflation well above the 2% “target”, that this could spook investors and lead to a rapid bear steepening move.
The second question for 2021 is the direction of movements in risk premia. While the generally tight levels of spreads on corporate bonds and other “risky” asset classes suggest meager returns to many investors, we would elaborate and offer a few observations. If we look at yield per unit of duration for broad fixed income indices, the metric is at or near all time-lows. This measure, which implies breakeven yield or spread movements as compared to the underlying yield-to-maturity of the index or security, is a useful analytic starting point. In aggregate, this would imply a risk/reward proposition skewed to the downside, but when we drill down to individual subsectors of the bond market, pockets of relative value remain. Moreover, while this metric implies a lower threshold for an increase in yields or spreads to overwhelm the yield of a given index or security, an improvement in economic fortunes and thus the financial state of fixed income assets could allow for improvement in spreads. And, while each sector has relatively unattractive breakeven yields based on these figures, there are investments within each sector that can provide a better risk/reward construct than the 40,000 foot view implies. Moreover, though the duration/yield metric allows for apples-to-apples comparisons, fixed income sectors are varied in their actual sensitivity to interest rates. So, while absolute performance is likely to be much more modest given strong performance in both 2019 and 2020, relative performance is still to be found.
While we are skeptical that the consensus view about imminent and persistent inflation remains correct, certain sectors should provide more yield and lower exposure to rate or spread movements. Crossover and high-quality high yield credit, preferreds and hybrid securities, esoteric ABS, and seasoned CMBS, (both agency and private label) have either not recovered as much as more heavily trafficked sectors or provide a more attractive relative valuation. To be sure, these types of investments are a much smaller swath of fixed income securities, and some are not even contained within standard benchmarks. That said, the ability to access these types of investments will likely be a key to success in 2021, as will the ability to avoid frothy valuations elsewhere in fixed income. 2021 will certainly be a year for patience and not a year to reach indiscriminately for what yield remains.
This report is neither an offer to sell nor a solicitation to invest in any product offered by Xponance® and should not be considered as investment advice. This report was prepared for clients and prospective clients of Xponance® and is intended to be used solely by such clients and prospects for educational and illustrative purposes. The information contained herein is proprietary to Xponance® and may not be duplicated or used for any purpose other than the educational purpose for which it has been provided. Any unauthorized use, duplication or disclosure of this report is strictly prohibited.
This report is based on information believed to be correct, but is subject to revision. Although the information provided herein has been obtained from sources which Xponance® believes to be reliable, Xponance® does not guarantee its accuracy, and such information may be incomplete or condensed. Additional information is available from Xponance® upon request. All performance and other projections are historical and do not guarantee future performance. No assurance can be given that any particular investment objective or strategy will be achieved at a given time and actual investment results may vary over any given time.