
Once again, we begin this piece by lamenting the recent performance of the domestic fixed income markets. In this quarter’s update, we begin by looking at interest rates at the very broadest levels, i.e. Treasury markets and Federal Open Market Committee (FOMC) actions. We then take stock of the fixed income landscape, looking at current market metrics against a historical backdrop. Given the murky economic landscape and monetary policy path, we also contemplate the state of the various subsectors of the broad bond market. Given the yields on offer, however, markets have been able to withstand the recent upward move in rates, as evidenced by total returns and explained by yield and spread break-evens, a measure we like to revisit periodically in these pages. Lastly, we offer a general road map of fixed income portfolio construction against an increasingly challenged (in our view) economic landscape.
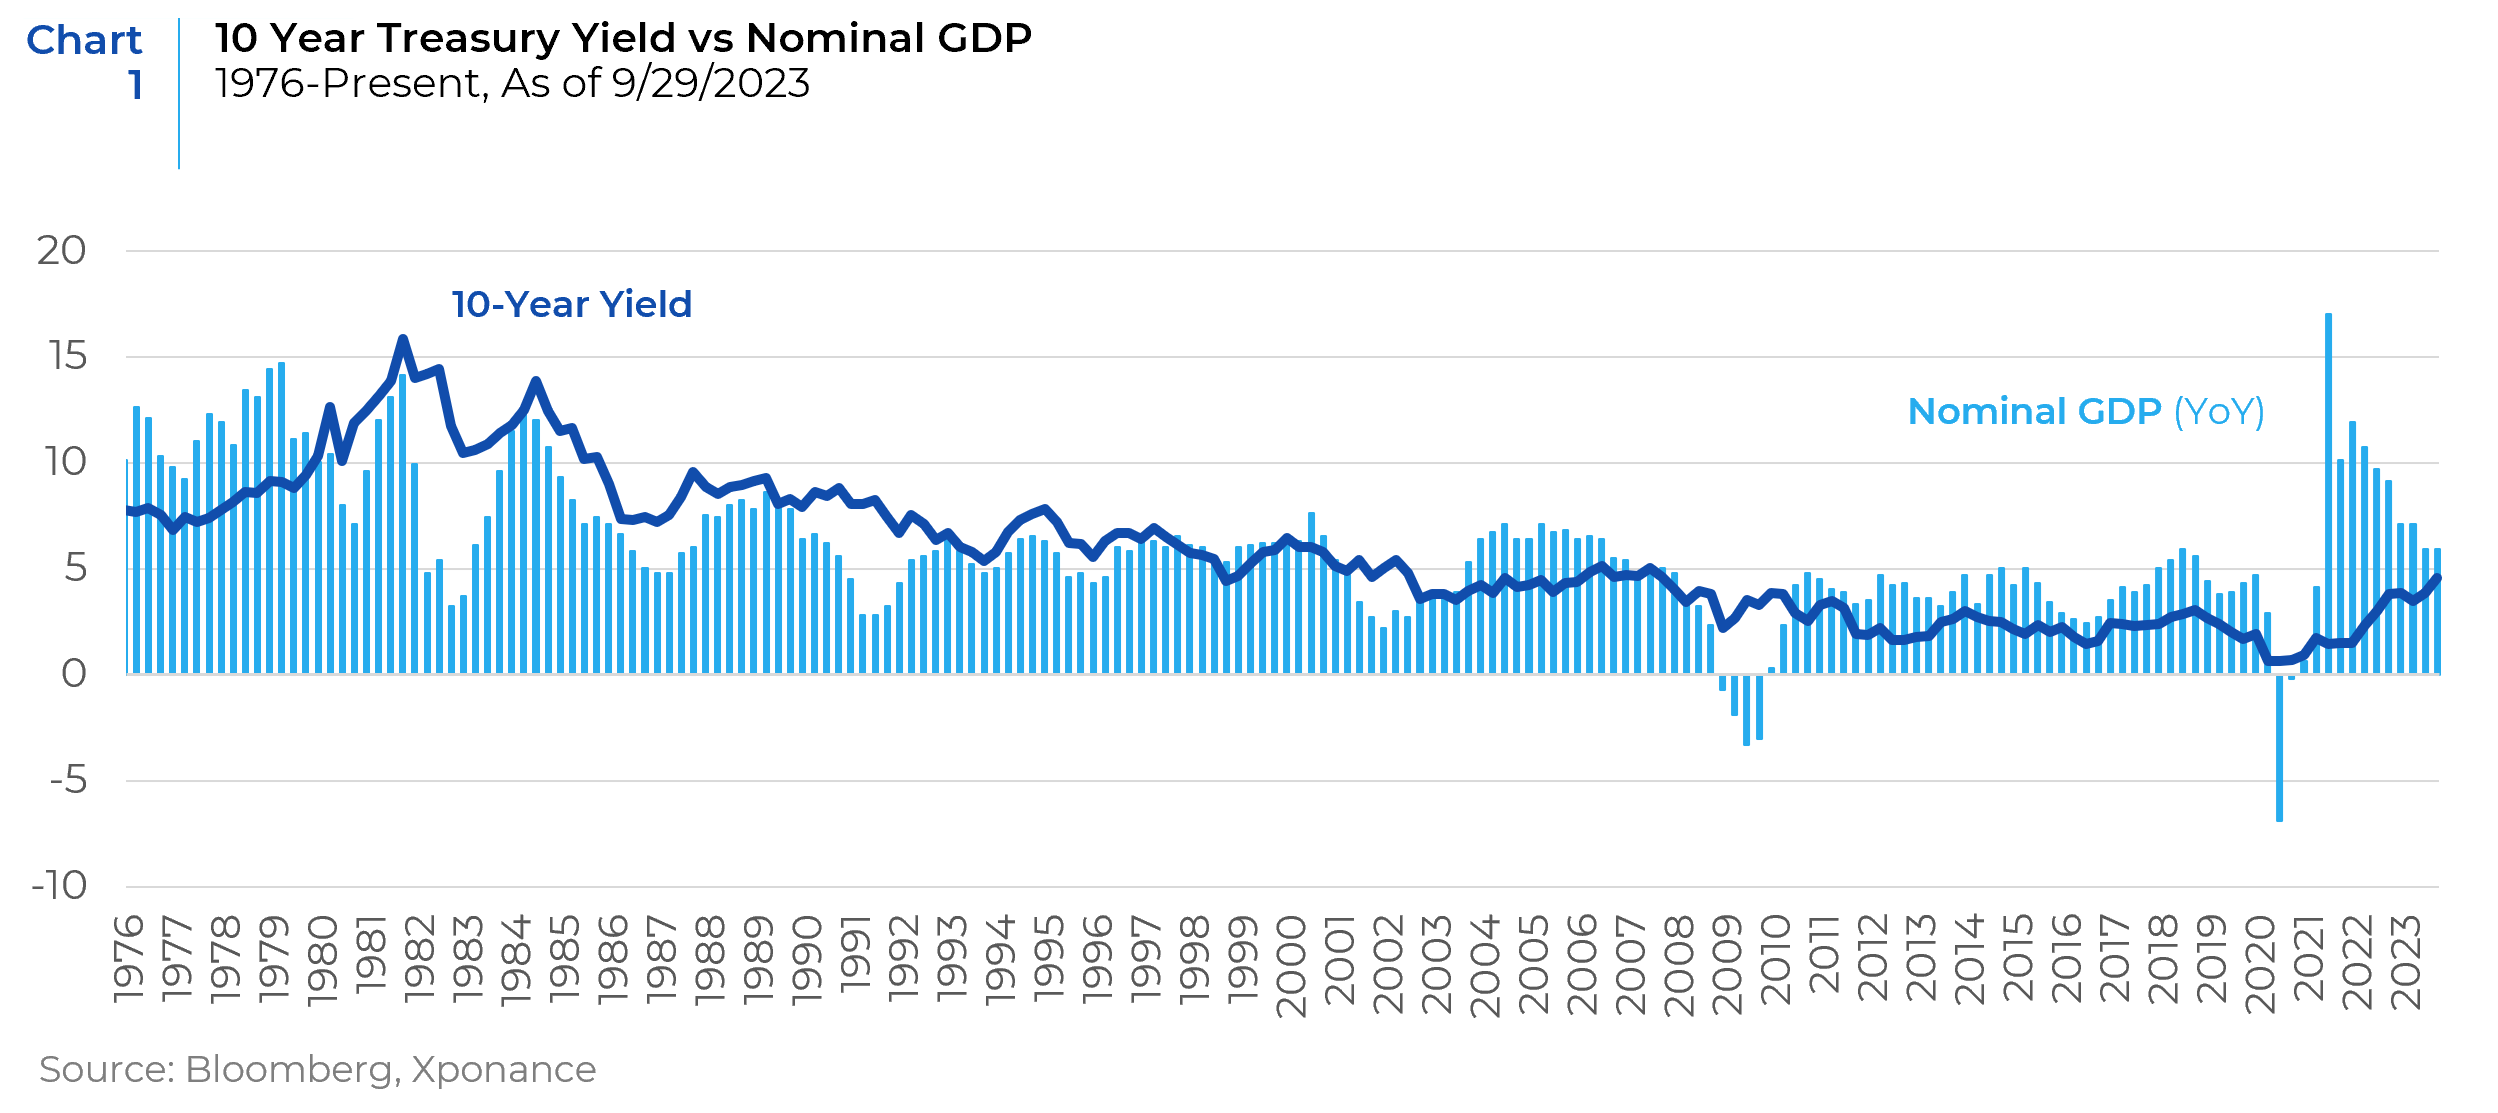
Since the FOMC embarked on its tightening campaign to begin 2022, the Treasury market has clearly been in a state of disarray from a variety of perspectives. Interest rate volatility, as measured by the MOVE index, remains at elevated levels not seen since the immediate aftermath of the Global Financial Crisis (GFC). Volatility in monetary policy expectations remains elevated as well. Between 6/30/23 and 9/30/23, expectations for a reduction in the Federal Funds target rate derived from Fed Funds futures contracts moved from anticipating the first cut in May 2024 to September 2024. While this measure is not particularly accurate that far in advance (and notoriously volatile based on headlines and prevailing short-term sentiment), it is nonetheless a good gauge of market expectations at a given point in time. Clearly, the variation in both inflation expectations and incoming inflation data is influencing market behavior. And, as has been widely noted in the financial media and by market practitioners, the 10-year US Treasury yield is higher than at any point since the run up to the GFC. We would note that traditional measures of interest rate relative value seem to be coming back to the bond market after the long period of Zero Interest Rate Policy (ZIRP). The relationship between economic activity and interest rate levels is returning to a rational equilibrium level that makes intuitive sense, including the notion of positive real interest rates that protects fixed income instruments from erosion of capital. ZIRP clearly kept rates at an artificially low level that was well below nominal GDP, and often below the standalone inflation rate. If we look at the 10-year Treasury through the lens of nominal GDP, we are currently much closer to fair value than at any time since the first decade of this century (i.e. nominal GDP and the 10-year have converged). If we use the broad Treasury market index as a proxy for US rates, the data paints the same overall picture of the interest rate landscape as compared to overall economic activity.
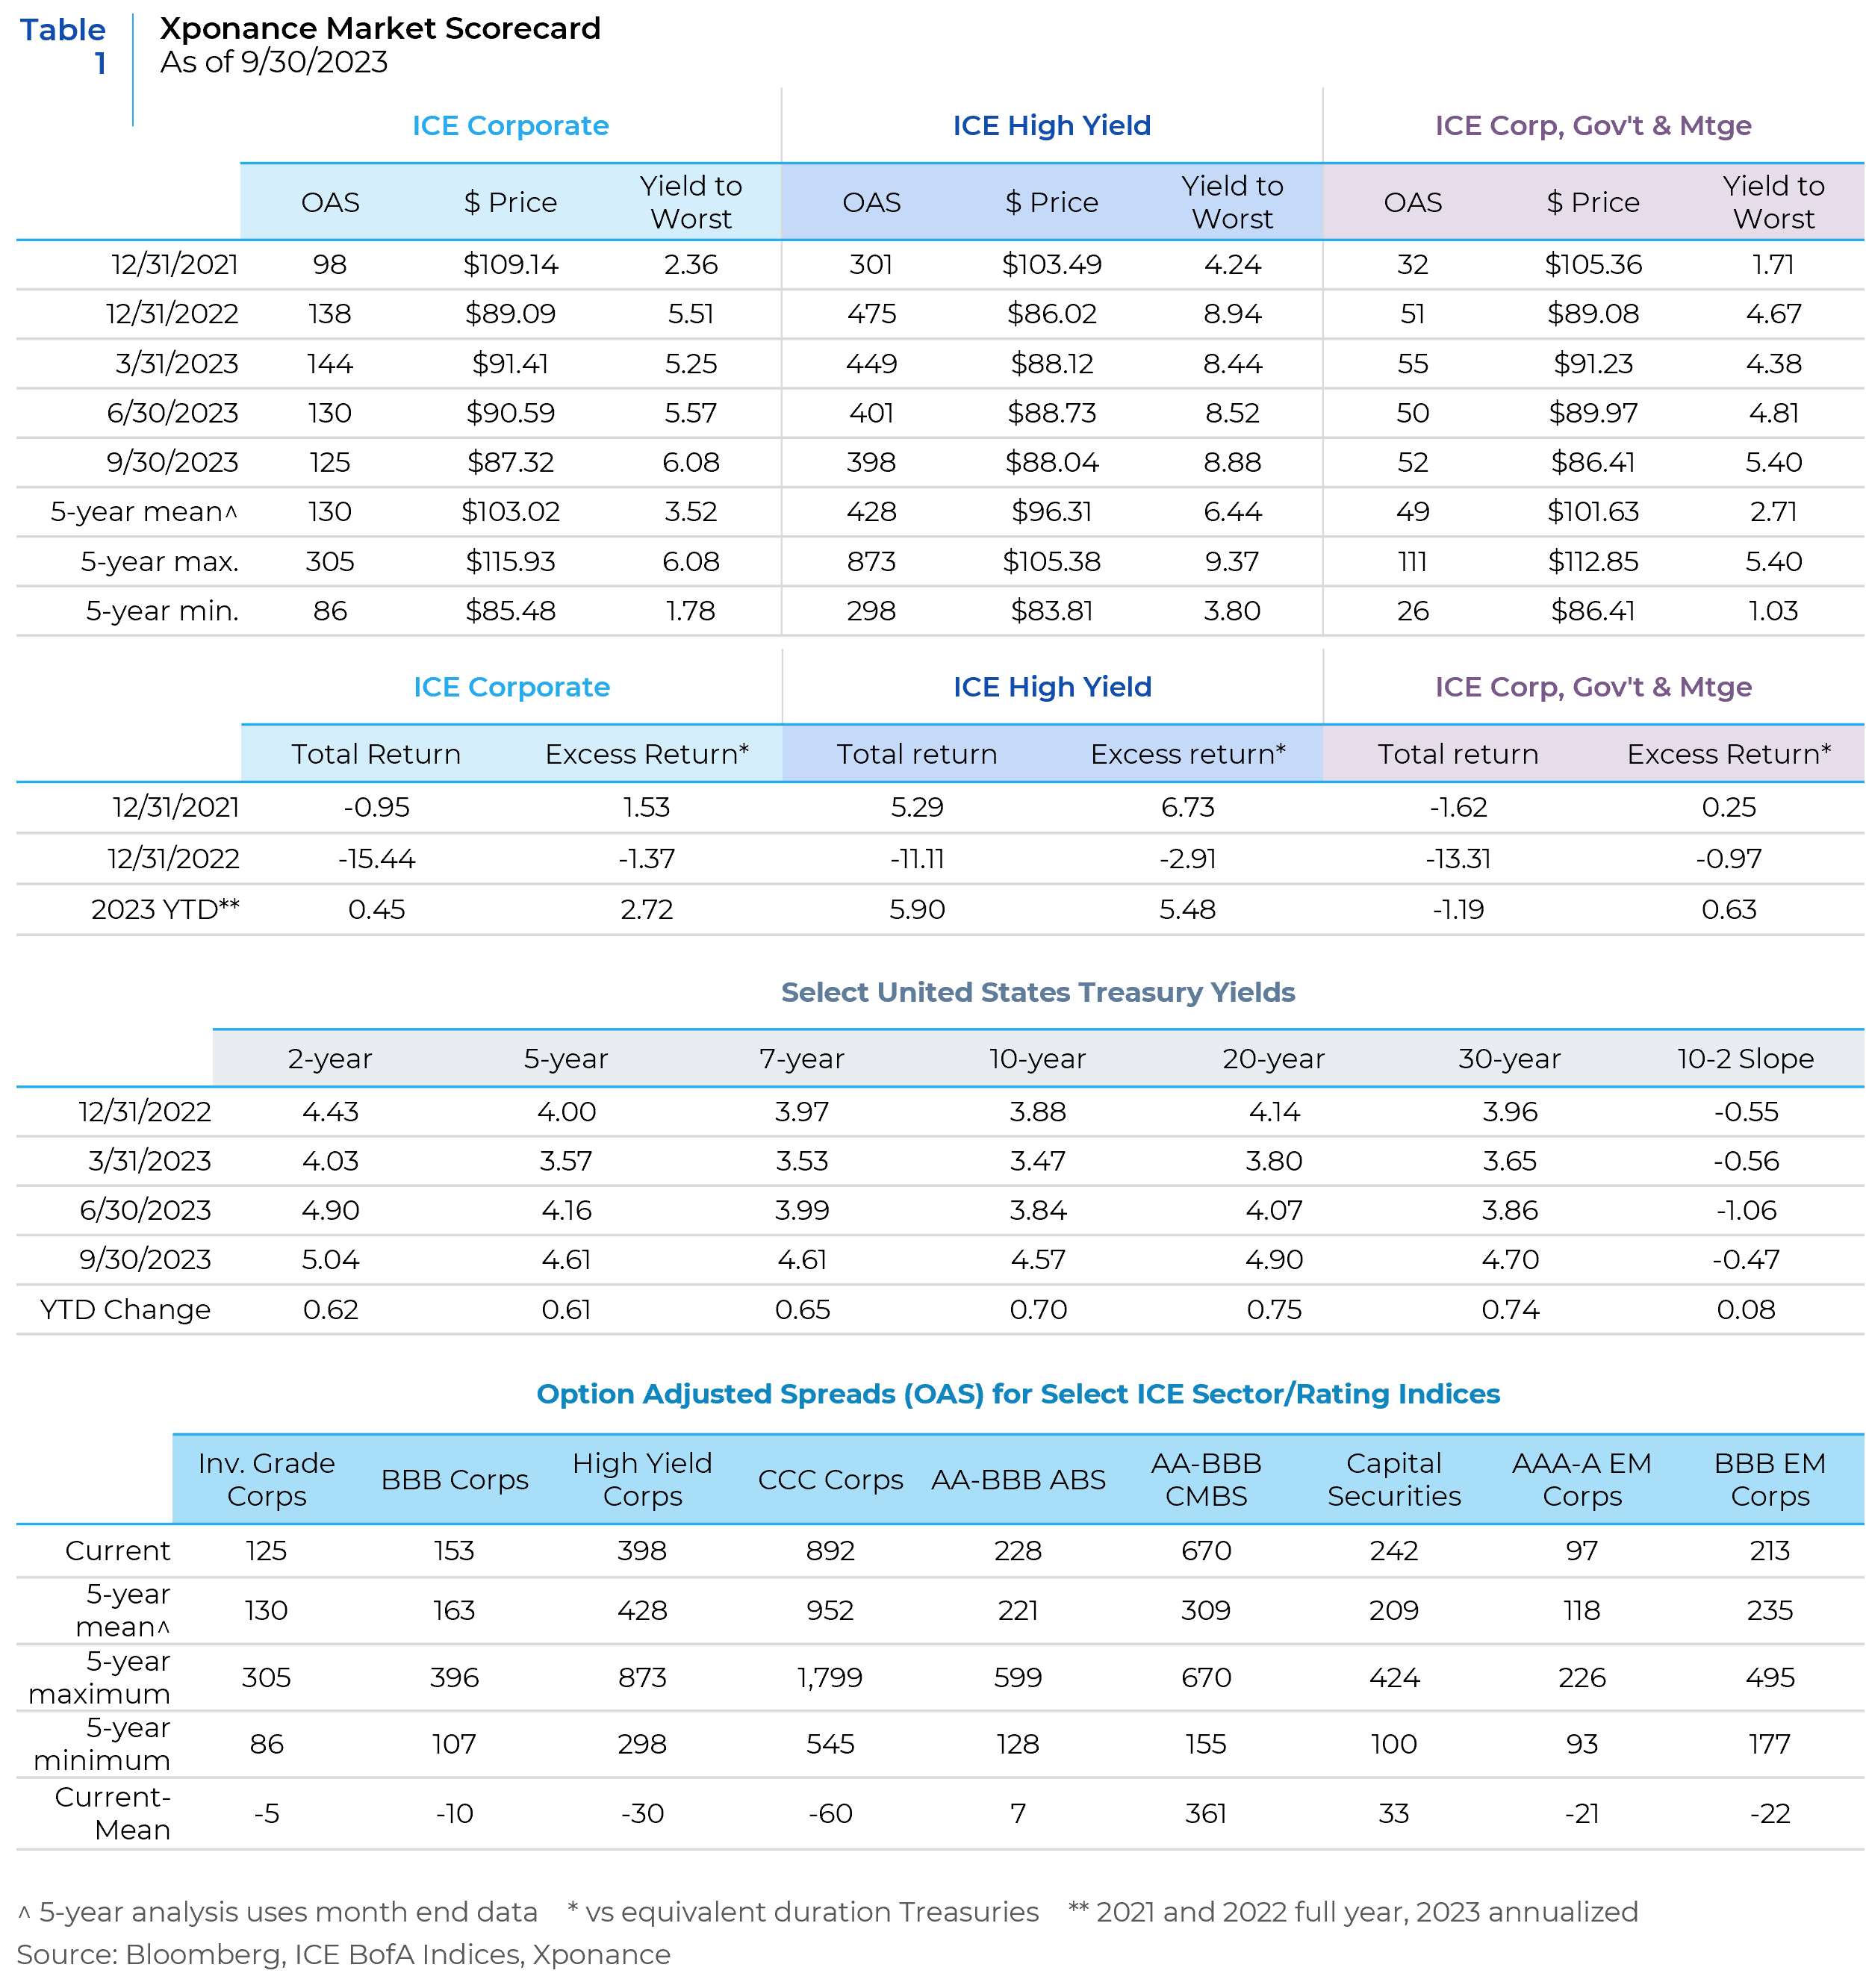
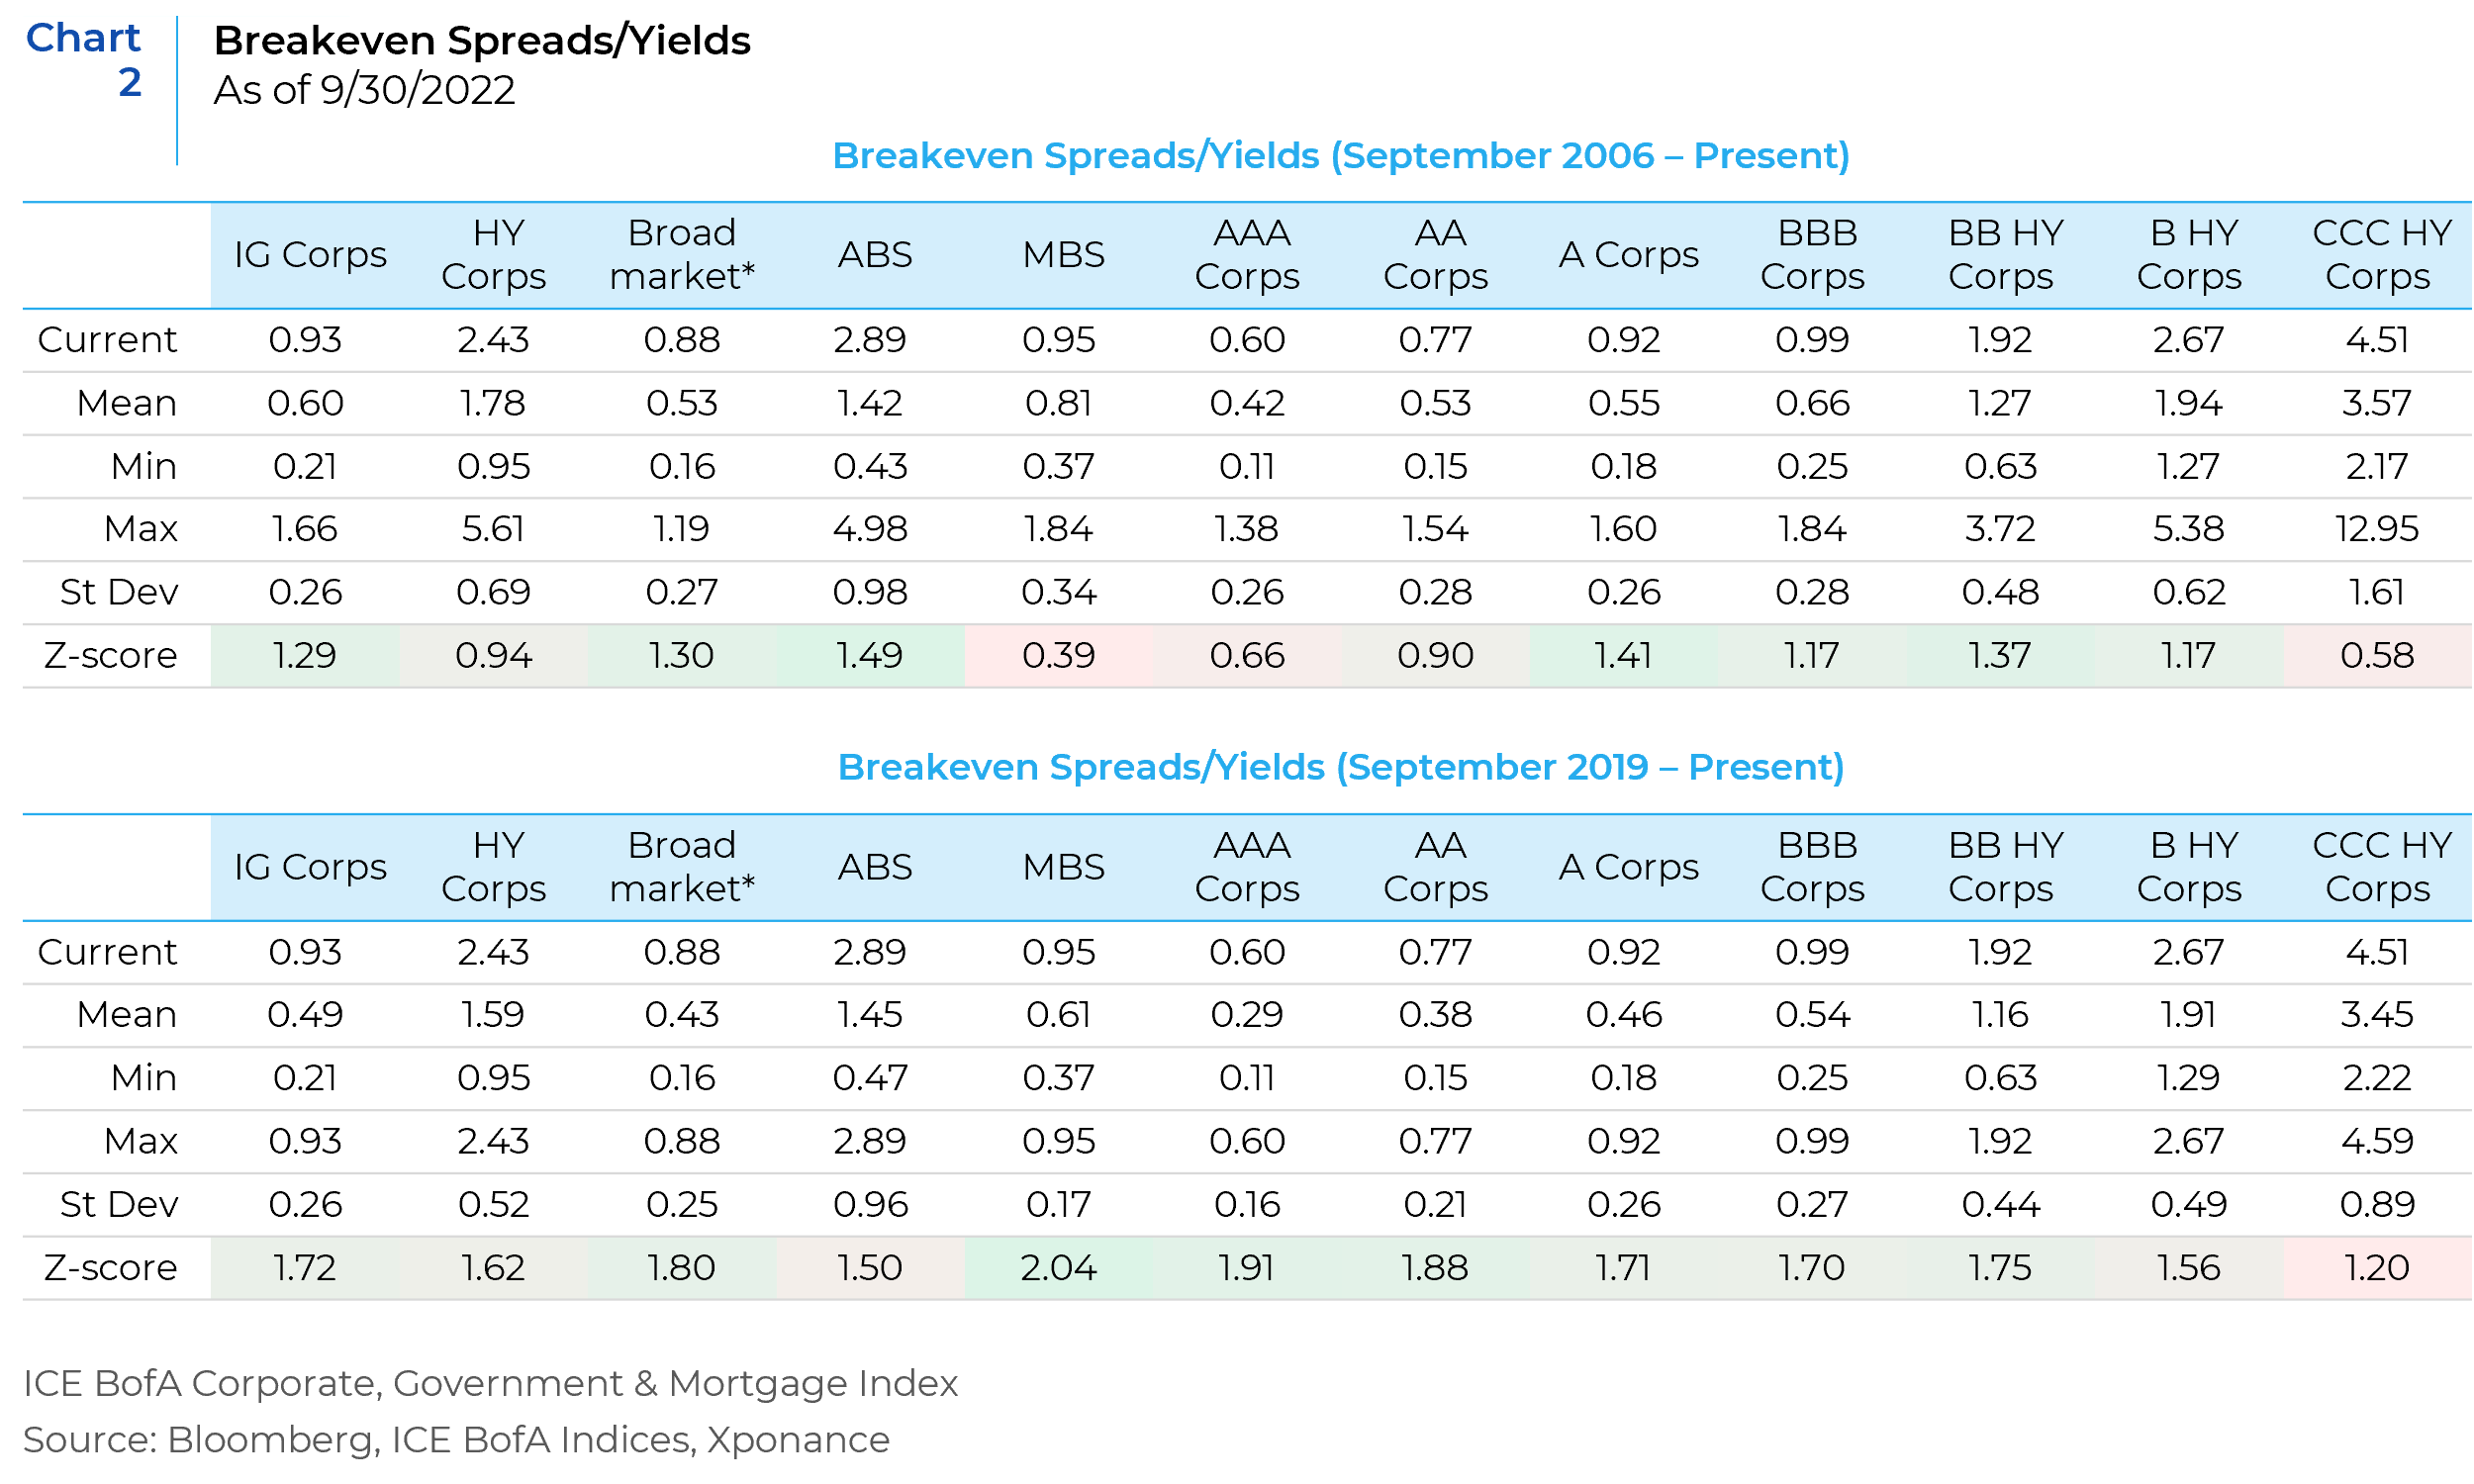
Despite the relatively dismal return profile for fixed income broadly in 3Q23, the damage was inflicted by interest rates, as spreads saw very limited movement, with both total and excess returns remaining positive for most of the fixed income risk sectors. As a reminder, total return is the absolute level of mark-to-market return (price change plus interest) while excess returns represent the relative return of a bond or a sector as compared to an equivalent duration Treasury. The latter measure measures performance of any risky fixed income asset (corporate bonds, agency notes and debentures, municipal bonds, agency MBS, and both the CMBS and ABS components of the securitized sectors) as compared to taking no risk beyond the interest rate risk embedded in a US Treasury. We refer to this as the portfolio manager’s dilemma, when and how should we leverage the other risks present in the fixed income market (including credit risk, prepayment risk, liquidity, volatility, etc). Absent a significant increase in interest rates because of the weakening fiscal position of the United States vis a vis debt-to-GDP, rates seem to be near a cyclical top, at least for the 10-year point on the yield curve. The historical relationship between the 10-year Treasury and 30-year Treasury suggests further steepening between the two points on the yield curve, however. Given the current interest rate regime, yield and spread break-evens imply that fixed income total returns should stabilize and turn positive (see Breakeven Spreads/Yields chart below). Excess returns as compared to Treasuries will be more challenged in a potentially recessionary environment, essentially reversing the experience of the market so far in 2023, though such a scenario would likely see positive total returns across the board. The caveats to this total return outlook are for those spread sectors that could see dramatic widening in risk premia (high yield specifically). CMBS (and in particular those CMBS rated below AAA) have already seen significant underperformance as compared to both the broader market and Treasuries. And, when we consider dollar prices for various sectors of the market, we are at or near all-time dollar lows for several sectors, including credit CMBS and capital securities (subordinated bonds and preferreds). We view both sectors as “canaries in the coal mine” for the forward economic outlook, given the precarious nature of several commercial real estate property types and the broadly leveraged state of US corporations in a much higher yield regime than has been the case for the current crop of US corporate executives. To expand upon this notion, many fixed income sectors are not priced for any economic slowdown or recession at all, while both CMBS and capital securities seem to be pricing in a downturn. Other sector and/or rating cohorts have held in better and could have further to fall. This group includes high yield and the CCC rating level more specifically.
As we approach the end of the year, we find ourselves in much the same position as we did to close out the final quarter of 2022. Rates have risen significantly, and economic growth is moderating, but fixed income yields are attractive. 4Q22 saw a significant “risk-on” trade to close the year (in spread product in general and corporates in particular) as market participants sought to salvage an abysmal year for returns. We think this trade is less likely to occur to close 2023 given the general tightness of spreads and the fact that existing portfolio allocations provide a yield cushion against further moves higher in yield without taking further risk. Our economic outlook remains cautious given that the new interest rate regime is clearly filtering through the economy. Corporate America has weathered the storm thus far, however, and the consumer has been resilient, though cracks in the façade of calm are beginning to appear. One needs to look no further than 1Q23 to see the potential economic and financial market effects from the impacts of the relentless series of FOMC rate increases. Investors woke up to the fact that the massive move upward in interest rates created large holes in balance sheets (specifically regional banks in the case of 1Q23 but also general account insurance portfolios and any valuation requiring discounted cash flows, including real estate cap rates).
Looking forward against this backdrop, performance attribution in times like these tends to come from security selection rather than sector allocation. While correlations between all fixed income instruments are very high since the primary determinant of mark-to-market return is interest rates, performance dispersion increases both among sectors and between securities within these sectors, which places a premium on finding those individual bonds that can outperform. There are a range of strategies and tactics that can achieve this goal. From a top-down perspective, portfolio construction will favor less contribution to spread duration relative to market value contribution from the spread sectors. Specifically, overall yields are attractive, but a recessionary environment will cause risk premia (spreads) to widen while interest rates will simultaneously fall. Therefore, owning the extra yield that non-Treasury sectors provide provides a nice yield advantage relative to a given benchmark, but relative returns as compared to Treasuries will be challenged in that scenario. So, more volume of yield (market value contribution) with less sensitivity to yield and spread movements (duration contribution) should win the day, especially given the more attractive spread break-evens for shorter duration securities. Given the relatively low (but climbing) dispersion of spreads across corporate bonds, investors are not paid to add spread beta. Lastly, the Non-Agency securitized sectors (namely CMBS and esoteric ABS), while offering a significant yield pickup compared to the more mundane credit and Treasury sectors that comprise the majority of the broad market indices, could likely see further stress from here. We believe opportunities are close to presenting themselves, but we are maintaining a wait-and-see approach. To take advantage of these relative value opportunities, we believe investors must have dry powder available in the form of cash, on-the-run Treasuries and recently issued corporates that tend to trade more easily in a potentially stressed market environment.
This report is neither an offer to sell nor a solicitation to invest in any product offered by Xponance® and should not be considered as investment advice. This report was prepared for clients and prospective clients of Xponance® and is intended to be used solely by such clients and prospects for educational and illustrative purposes. The information contained herein is proprietary to Xponance® and may not be duplicated or used for any purpose other than the educational purpose for which it has been provided. Any unauthorized use, duplication or disclosure of this report is strictly prohibited.
This report is based on information believed to be correct, but is subject to revision. Although the information provided herein has been obtained from sources which Xponance® believes to be reliable, Xponance® does not guarantee its accuracy, and such information may be incomplete or condensed. Additional information is available from Xponance® upon request. All performance and other projections are historical and do not guarantee future performance. No assurance can be given that any particular investment objective or strategy will be achieved at a given time and actual investment results may vary over any given time.