
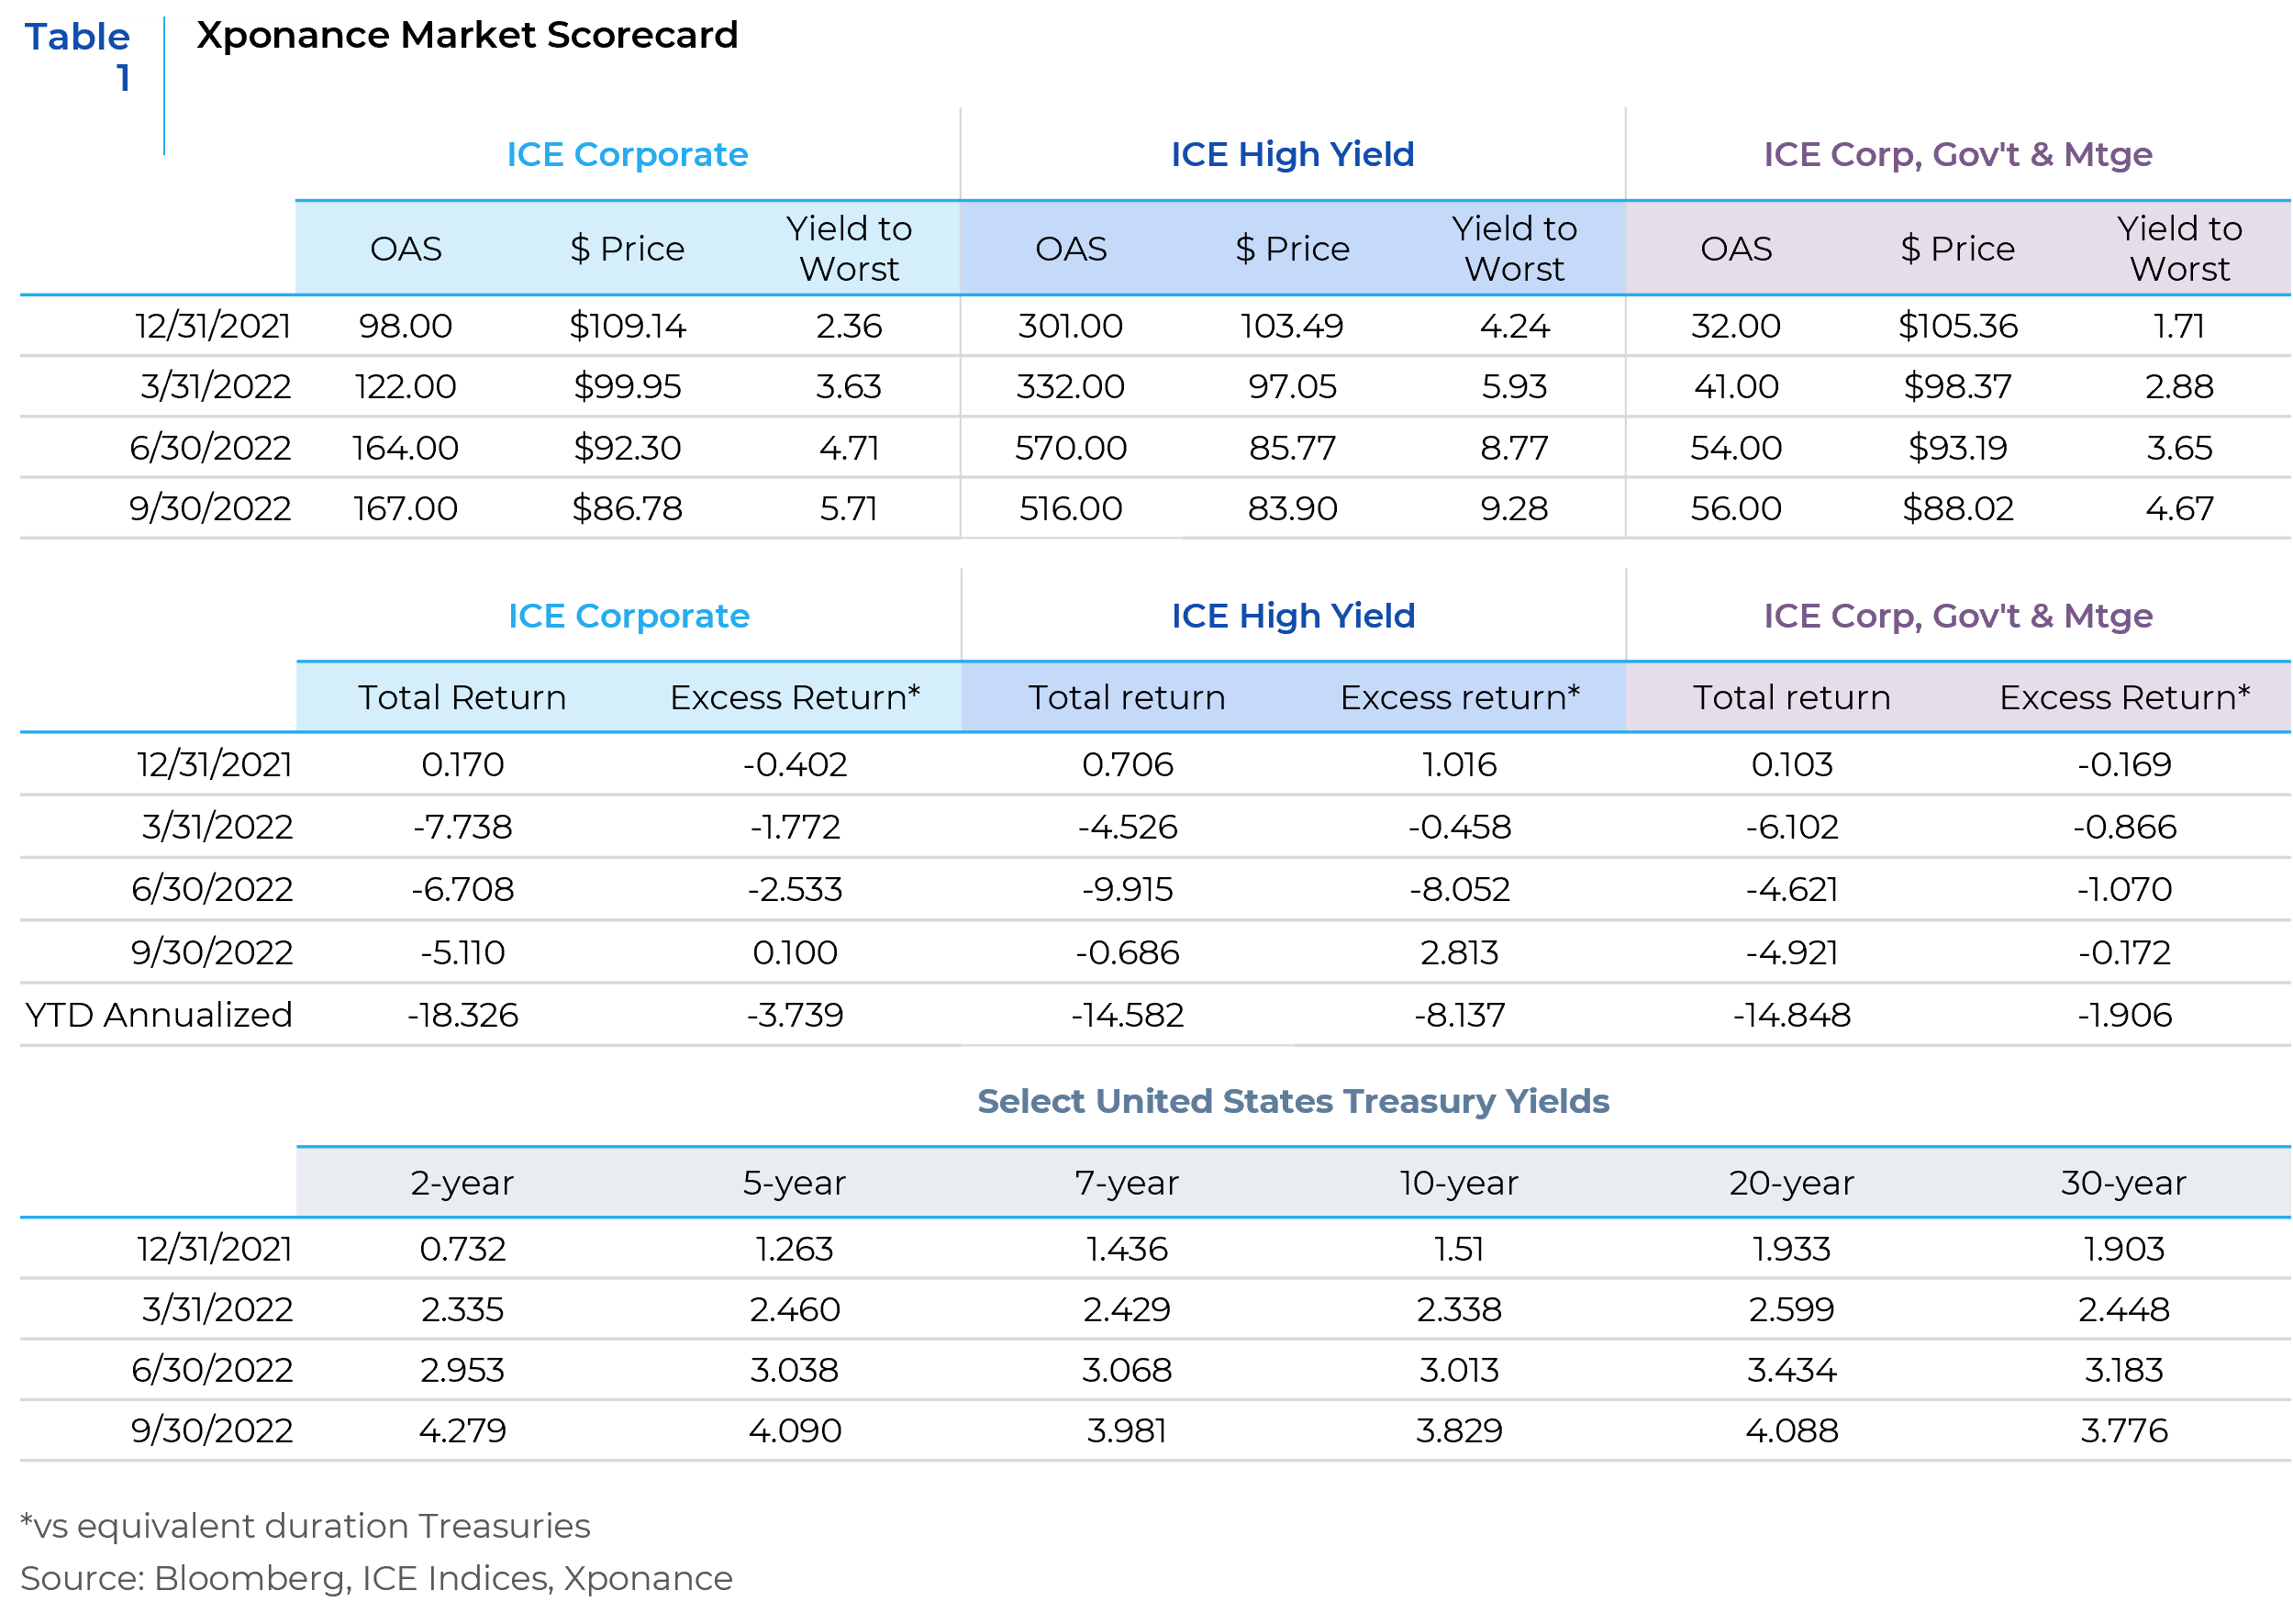
We continue to believe that risk assets could see spreads widen given our underlying view of the domestic (and global) economy. Overall yields, however, are significantly more attractive than they have been for an extended period. Looking at yields for the broad corporate investment grade market, for example, current yield levels are higher than at any point since the immediate aftermath of the Great Financial Crisis. At 5.74% at quarter-end, this is the first month-end reading above 5% for the ICE BofA corporate index since 8/31/2009. There are clear and obvious differences between the two time periods (relatively tight spread levels being the main difference now) but yields currently on offer are beginning to present a case for compelling forward returns. Given fairly tight spread levels against what is likely a recessionary backdrop, the real question at hand is whether yields stay fairly stable with rates falling and spreads widening? Or, does the macroeconomic backdrop (including potentially higher structural inflation) portend stable or upward pressure on rates while spreads are simultaneously widening? The answer has real implications for sector, curve and rating exposures.
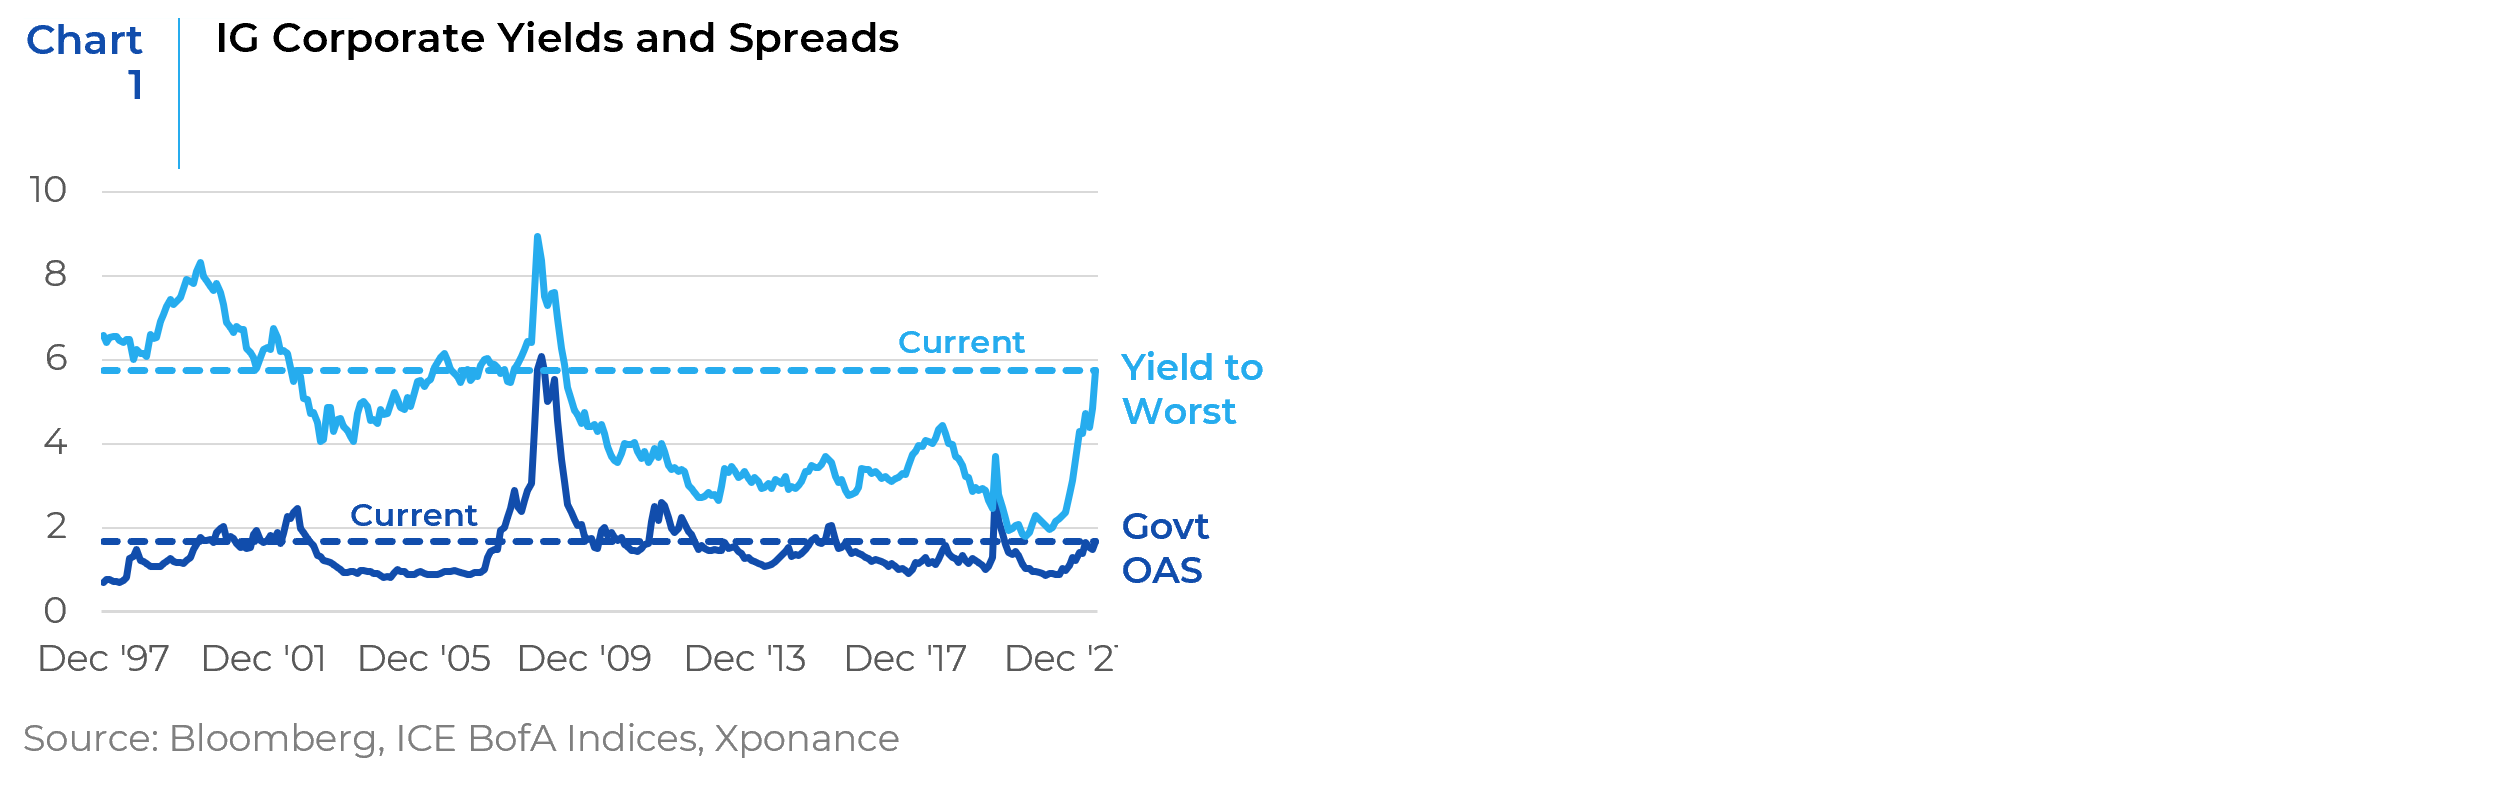
One way we attempt to decipher value in such an uncertain environment is by looking at yield and spread breakevens, defined as the yield increase or spread widening that a bond can take before the yield is overwhelmed by negative price return. We discuss this and other value propositions in Table 2.
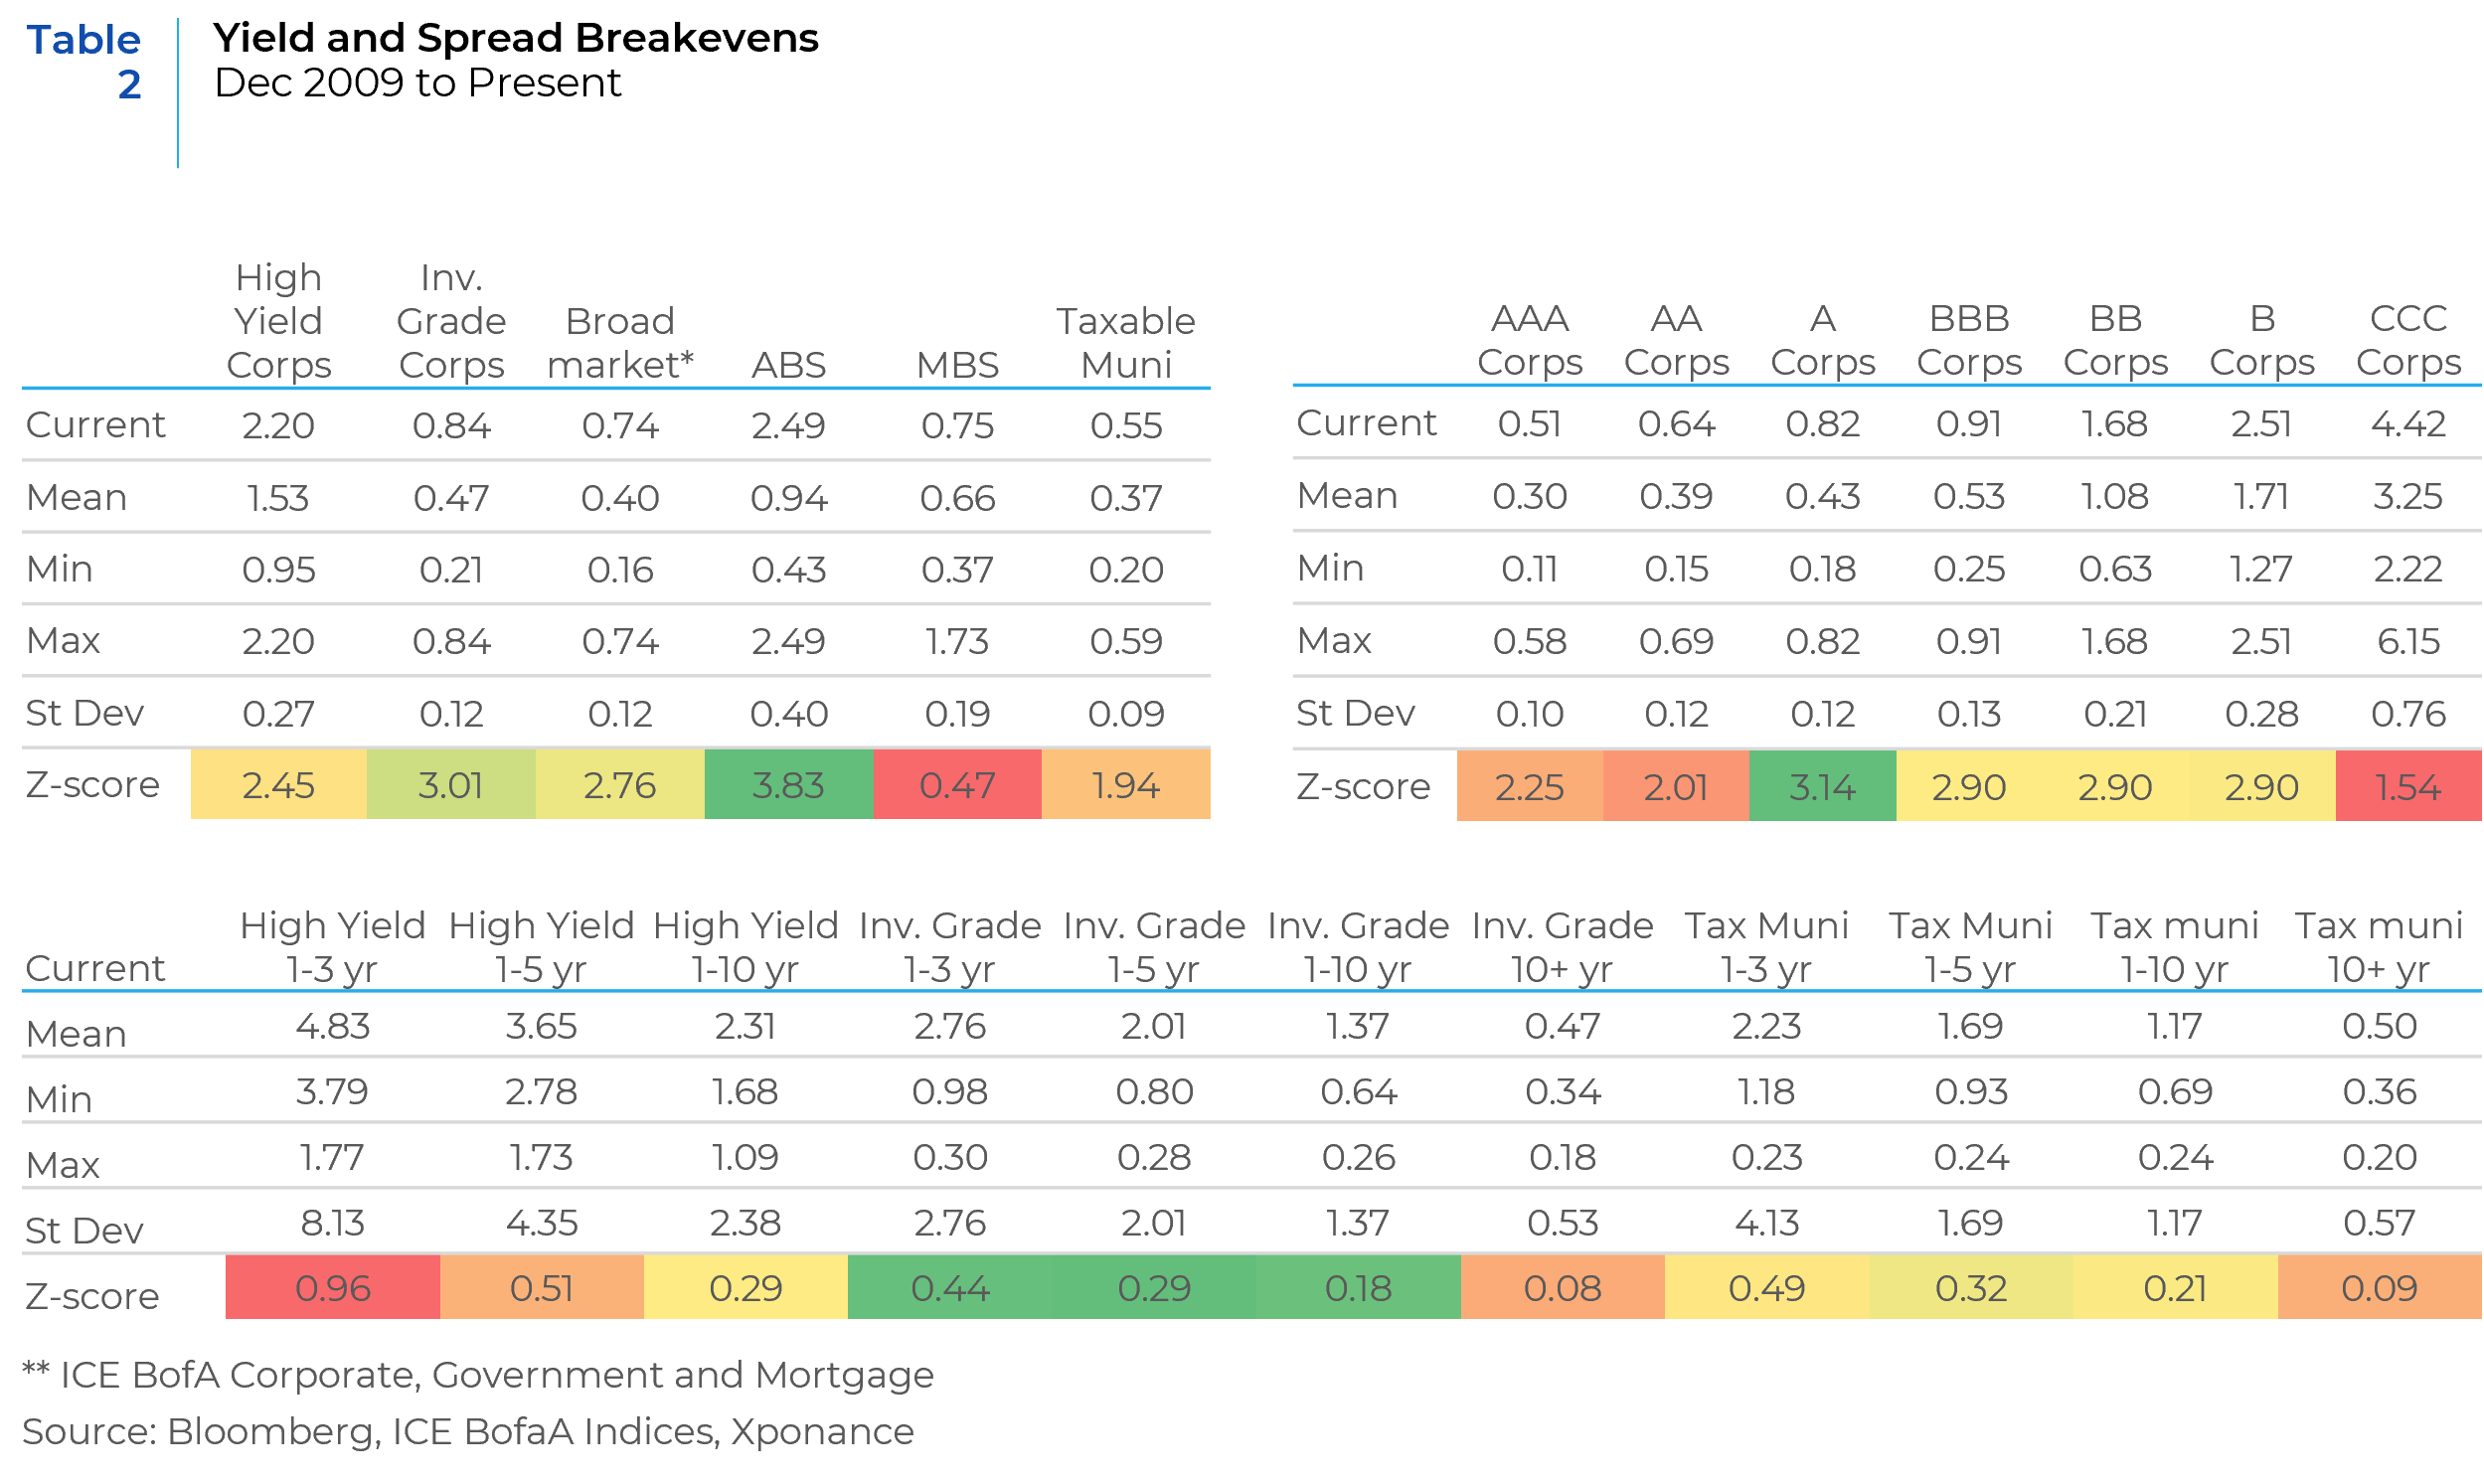
A host of factors are emerging to present opportunities across the fixed income markets. As noted above, spread and yield breakevens are beginning to show value in a few select places. Further, even sector, maturity and rating bands that were extremely unattractive by this metric are moving towards investability (when analyzing the period immediately following the GFC to the present). If we look over the shorter term, breakevens look even more attractive. Mortgage-backed securities and high yield corporates look the least attractive by these measures, while short and intermediate investment grade corporate bonds seem to provide good value. As is generally the case, longer duration instruments seem unattractive, though a steepening in the Treasury and/or credit curves will provide a nice entry point as we get deeper into the business cycle. As noted in last quarter’s update, low dollar prices for much of the fixed income universe also present a unique risk/reward, somewhat akin to the post-GFC period (and most prevalent in long-dated assets, providing a counterpoint to the breakeven story). Lastly, given the move in rates during 3Q22, these dollar prices are even more attractive now.
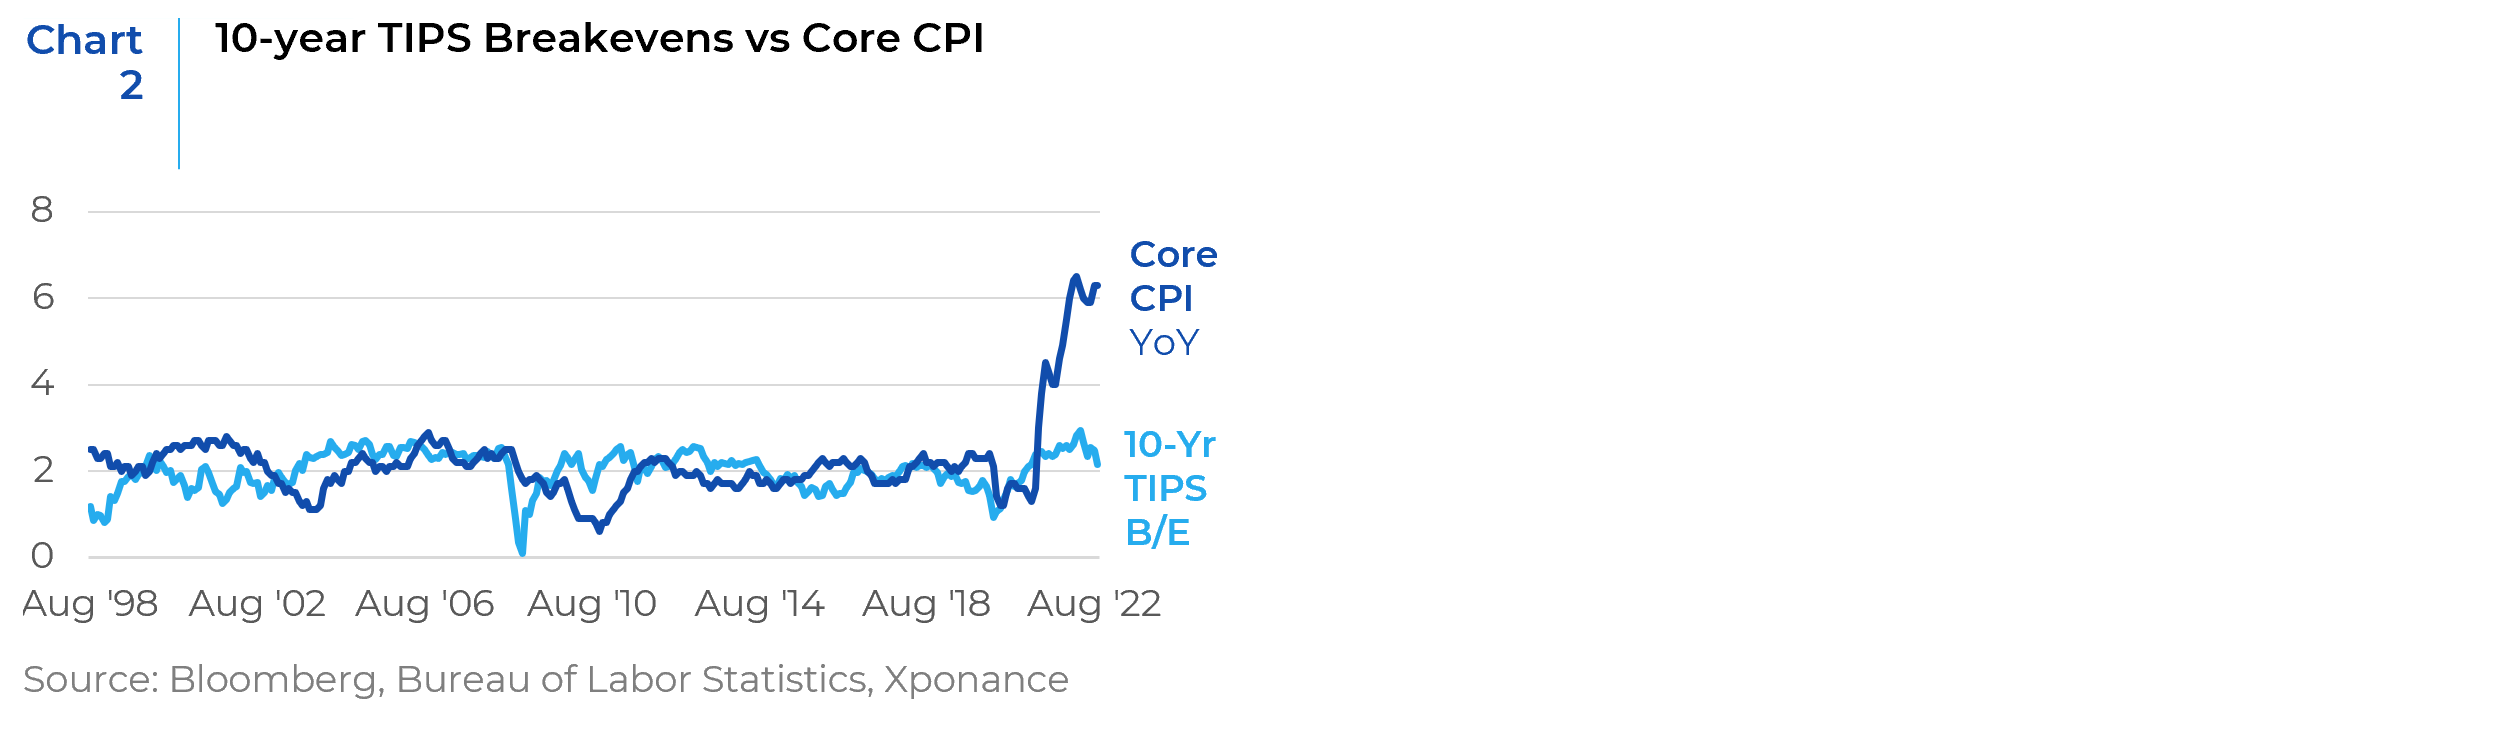
As our Founder and CEO/CIO discusses in her Q4 2022 Market Outlook entitled The Times They Are A-Changin’, structural inflation could well be on the rise after decades of secular disinflation. If this is truly the case, as we believe, then Treasury Inflation Protected Securities (TIPS) also present a compelling longer-term investment opportunity. Breakeven levels have come down from well north of 3% to around 2.25% for intermediate tenors (specifically the 5-year and 10-year points along the curve). As a reminder, TIPS breakevens represent the difference between the yields on TIPS as compared to the nominal Treasury of the same maturity (and distinct from the yield and spread breakevens discussed above). Short-term sentiment and technical factors often drive trading in the relatively small and illiquid market for TIPS, but current levels of inflation protection seem very low against an inflationary regime change. We looked at a range of inflation indicators, including trimmed mean and sticky CPI measures as well as the more familiar core Consumer Price Index, but these all present a similar story. From a trading perspective, TIPS often do not perform as advertised (see Chart 2). It is worth noting, however, that TIPS performance is predicated on the inflation accrual in addition to market movement. Inflation that runs consistently above these relatively low breakeven levels is a winning trade.
2022 has been a year of trying to use volatility to find trades that were relative winners against the unrelenting backdrop of rising rates and widening risk premia, understanding that the overall return picture has been bleak. By its very nature, fixed income cannot lose forever, and we are beginning to see the outlines of a positive return stream. While we may not see this for the remainder of the year, we can continue to add higher yields in relatively defensive corners of the market. This should help to propel returns into 2023. Garnering outsized yields in short maturities can help to insulate against the next few moves by the Federal Reserve, and we can slowly rotate into these from the floating rate securities that have helped to insulate some of the upward moves in the Fed Funds rate. At some point, high yield will fully price in a worsening default picture and these securities should allow for outsized performance as this happens. While we remain cautious, we do finally see a hint of blue sky on the horizon. And this most welcome sight cannot come soon enough!
This report is neither an offer to sell nor a solicitation to invest in any product offered by Xponance® and should not be considered as investment advice. This report was prepared for clients and prospective clients of Xponance® and is intended to be used solely by such clients and prospects for educational and illustrative purposes. The information contained herein is proprietary to Xponance® and may not be duplicated or used for any purpose other than the educational purpose for which it has been provided. Any unauthorized use, duplication or disclosure of this report is strictly prohibited.
This report is based on information believed to be correct, but is subject to revision. Although the information provided herein has been obtained from sources which Xponance® believes to be reliable, Xponance® does not guarantee its accuracy, and such information may be incomplete or condensed. Additional information is available from Xponance® upon request. All performance and other projections are historical and do not guarantee future performance. No assurance can be given that any particular investment objective or strategy will be achieved at a given time and actual investment results may vary over any given time.