
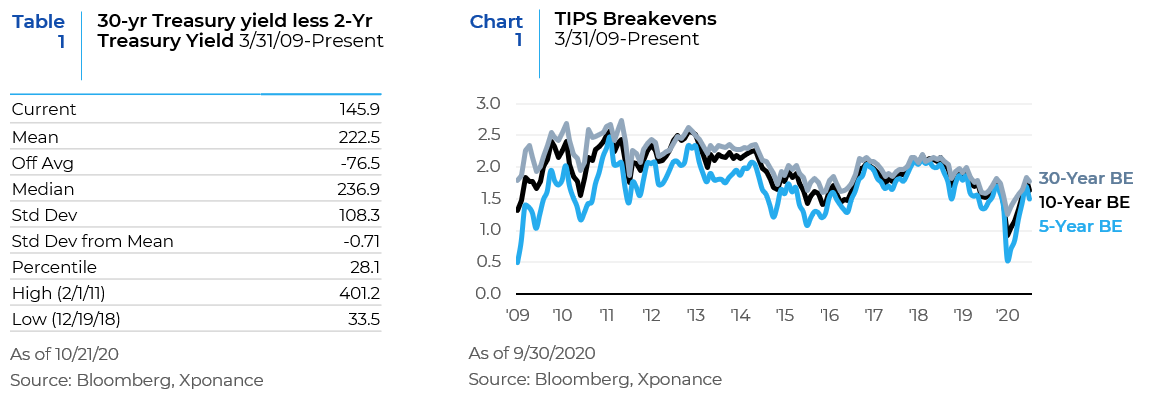
The final stanza of 2020 is upon us, and the fixed income landscape looks quite complacent across many sectors of the market. Treasury rates are somewhat of an exception, as the re-steepening of the treasury curve is pronounced, at least as compared to the very low starting point after the Federal Reserve made its emergency moves in March. Nonetheless, the breathless commentary from the financial press is largely overblown from an absolute historical perspective. To be sure, the slope of the 30-year less the 2-year Treasury curve is the roughly at the highest level of 2020, (at around 146 bps currently) but this level of slope is quite low by the standards of the post Great Financial Crisis period. While this slight steepening of the curve is likely indicative of potential further stimulus, it is certainly not indicative of either an economic breakout to the upside or accelerating inflation. If we use break-evens from Treasury Inflation Protected securities (TIPS) as a guide, sentiment around growth and inflation has improved from the lows earlier in the pandemic period but have moderated from midsummer optimism. While a broad ranging and large stimulus bill would clearly be a positive for aggregate demand, we remain concerned about the continuing impact of the pandemic on joblessness and incomes even with a large stimulus bill.
Against this background of slow to moderate growth extrapolated from Treasury market movements, we continue to contemplate risk premia across spread sectors. Similar to our historical analysis of the Treasury curve slope, we compare previous periods of dislocation in risk markets since the end of the GFC at the end of 1Q09. In the corporate space, while credit spreads were just over 3x wider at 3/31/20 than they were at year-end 2019, these were still tighter than either the GFC period or the Eurozone default and banking crisis (EZ crisis) during 3Q11. Our previous two quarterly reviews have focused squarely on the corporate sector, given the large size of the sector relative to the overall broad market benchmarks.
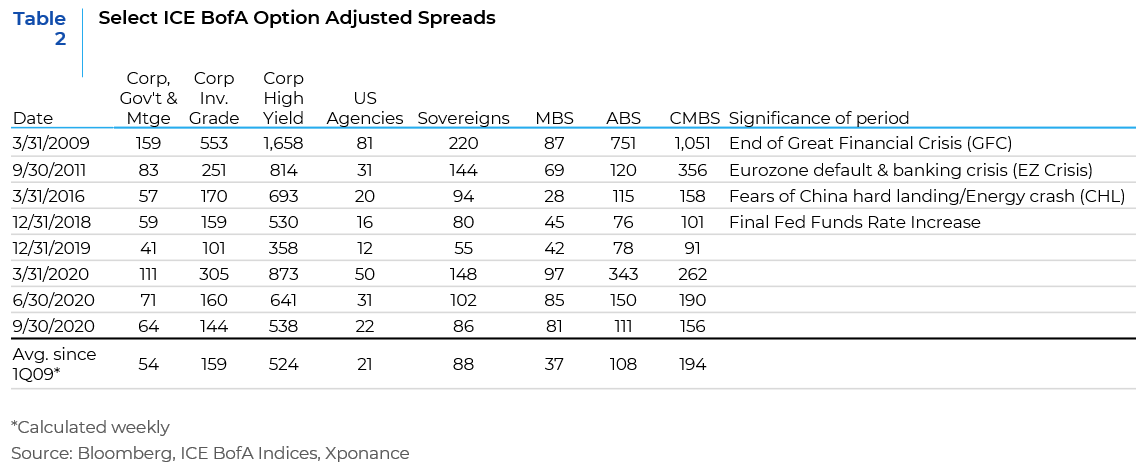
When we look at option adjusted spreads (OAS) in the securitized sectors, asset-backed securities (ABS) have led the way in terms of recovering from the pandemic-induced wides of March, but still remain fairly wide as compared to previous “risk-off” markets. Even after having retraced about two thirds of the widening since the end of March, the OAS for the ABS sector is around the same level reached in both the 3Q11 EZ crisis and 1Q16 (fears of a China “hard landing”, CHL). The difference between the two previous periods and now, however, is that the consumer was only tangentially impacted by either the Eurozone crisis or the fears of a hard landing in China, whereas COVID-19 directly impacts them. From a fixed income benchmark perspective, the asset backed securities contained within the index and thus reflected in the sector OAS largely consist of two main types – the senior tranche of credit card and auto loan receivables. As such, we think of ABS spread trends as broadly reflective of consumer credit quality in the economy. While this is an oversimplification, ABS spreads have tended to follow the credit quality trend at banks, with the exception of outsized spread moves during broad risk-off markets. We are seeing a weakening credit quality trend on average at the Big Four US universal banks, yet ABS spreads continue to tighten. As with subsectors in the corporate indices, certain types of ABS will be hurt less by the vagaries of the financial fallout from COVID-19, but we will continue to see the effects on borrowers from the ongoing economic pain and the resurgence of the virus.
Commercial mortgage backed securities (CMBS) spreads have not come as far back from the 1Q20 wides as ABS spreads have, but also did not widen as much at the outset. The option adjusted spreads quoted here are for the liquid securities contained within the index, with the more esoteric and non-index eligible parts of both CMBS and ABS having traded to higher spreads during the pandemic and taking longer to recover afterwards. Nonetheless, if we compare CMBS spreads to previous crises, current levels are comparable to the 1Q16 CHL scenario, but not nearly as wide as either the 3Q11 EZ Crisis or anything witnessed during the GFC. Given that most CMBS are a mix of property types, that complicates the analysis when assessing both fundamental performance and relative value. Delinquencies in aggregate were near all-time highs in June but have since recovered modestly as we moved through the summer. Lodging and retail delinquencies are extremely high, yet industrial, office and industrial have registered more modest increases. Some of the improvement was related to “curing” of the delinquencies as some borrowers became current on loans for several reasons, including forbearance. While forbearance temporarily helps both borrowers and delinquency statistics, it is not equivalent to forgiveness and the bill remains due.
While large corporations that issue into the credit markets have clearly been the beneficiaries of Federal Reserve policies and programs, the securitized sectors (agency mortgage backed securities notwithstanding) have not benefitted significantly from any coordinated policy response. We believe the securitized sectors away from generic agency MBS are more reflective of the financial pain that the pandemic has caused in the economy, which has in turn created greater uncertainty within the sectors and security subtypes. Clearly, certain subsectors in ABS are indicative of a general move down in underwriting standards as the economic expansion wore on (longer repayment terms and negative equity rollovers in auto loan ABS, for example). Similarly, certain property types in CMBS have been in the crosshairs of the pandemic, as discussed above. Despite, or maybe because of these factors, we believe there are and will continue to be opportunities in these sectors going forward. The ABS and CMBS sectors make up a very small percentage of the index, which renders them less liquid and somewhat underfollowed relative to the larger more liquid portions of the market. The spread between index eligible and non-index eligible bonds in these sectors also tends to be larger than we typically see in the corporate markets. Careful analysis of both the underlying collateral and the structure of a given securitization could give investors diversified carry away from the broad sectors that comprise most fixed income benchmarks.
This report is neither an offer to sell nor a solicitation to invest in any product offered by Xponance® and should not be considered as investment advice. This report was prepared for clients and prospective clients of Xponance® and is intended to be used solely by such clients and prospects for educational and illustrative purposes. The information contained herein is proprietary to Xponance® and may not be duplicated or used for any purpose other than the educational purpose for which it has been provided. Any unauthorized use, duplication or disclosure of this report is strictly prohibited.
This report is based on information believed to be correct, but is subject to revision. Although the information provided herein has been obtained from sources which Xponance® believes to be reliable, Xponance® does not guarantee its accuracy, and such information may be incomplete or condensed. Additional information is available from Xponance® upon request. All performance and other projections are historical and do not guarantee future performance. No assurance can be given that any particular investment objective or strategy will be achieved at a given time and actual investment results may vary over any given time.