
Keep Your Head and Limbs Inside the Coaster, and Use the Provided Safety Restraints
Despite the relative calm in markets, Q2 2025 was undeniably a roller coaster. The quarter opened with volatility fueled by “Liberation Day” tariffs and closed on a more composed financial note—though uncertainty around international trade policy remains unresolved. For the most part, markets have dismissed these disruptions as mere “noise,” a sentiment echoed in equity index performance and credit spreads across both investment-grade and high-yield fixed income assets.
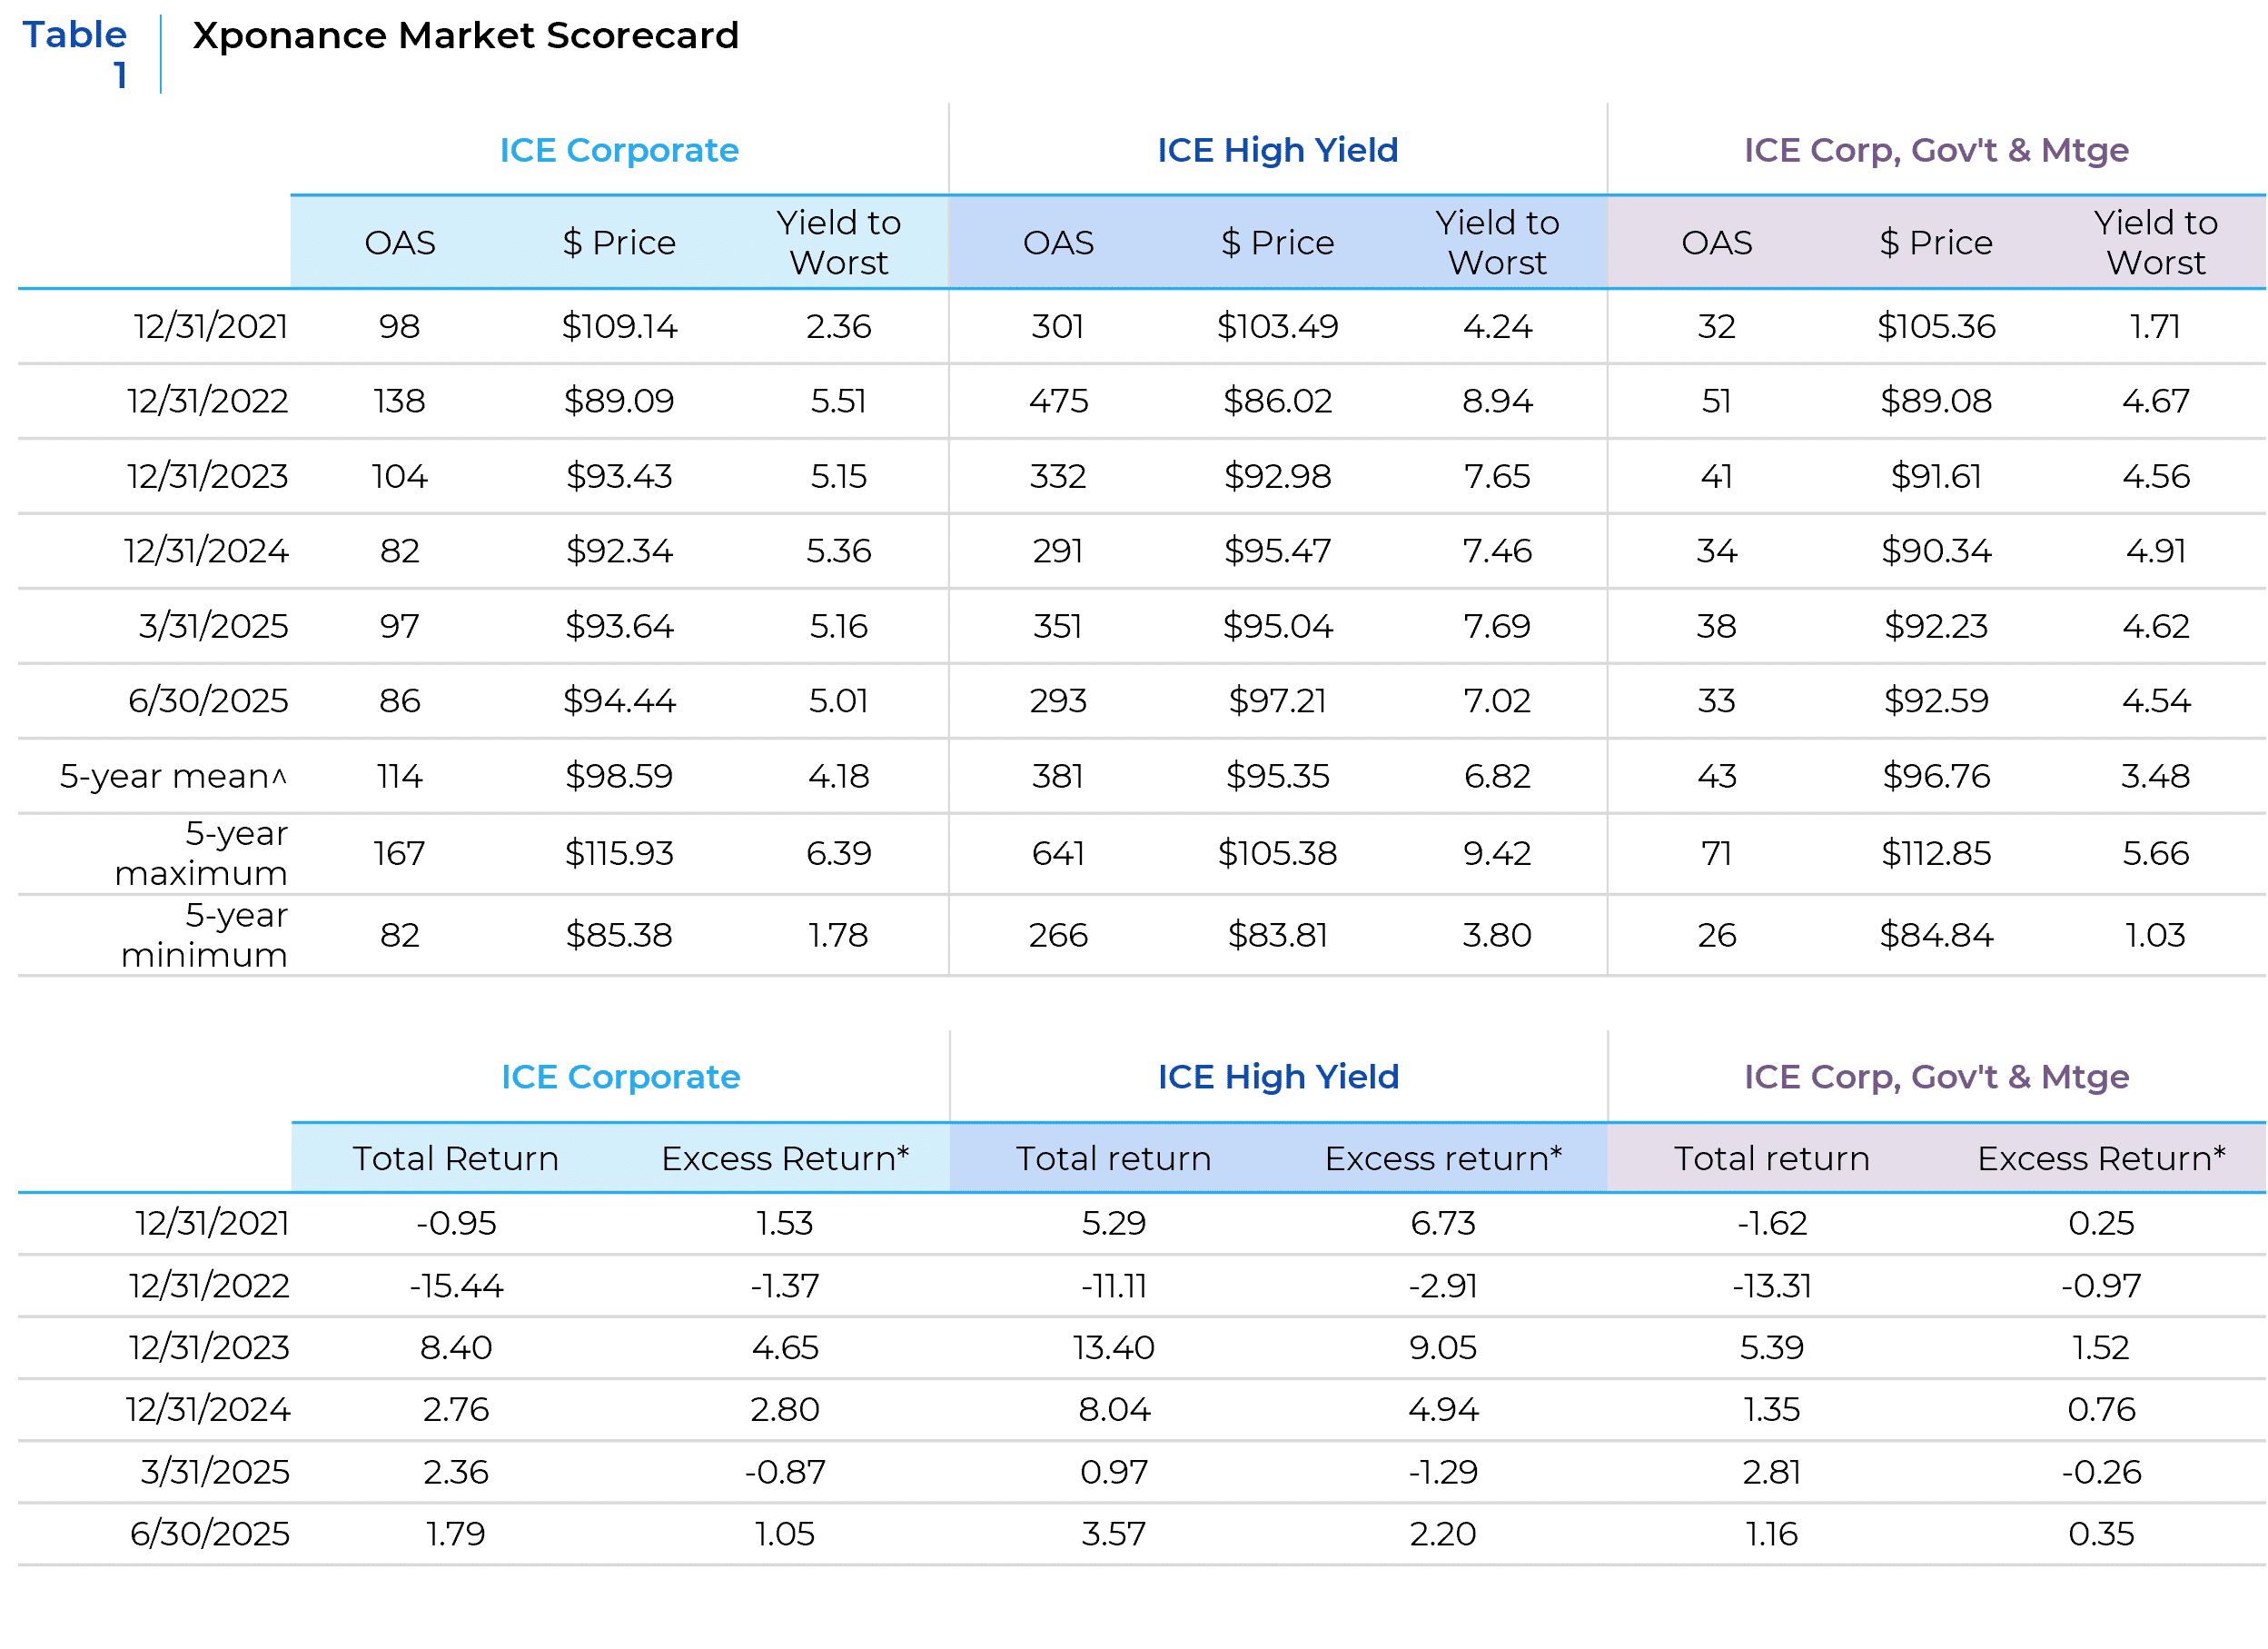
Beneath headline-level credit spread data, patterns for investment grade ratings cohorts show little alarm despite mounting macroeconomic risks. High yield rating relationships have begun to price in credit stress, however. In this research note, we analyzed this spread dispersion using ratios across corporate index ratings levels to gauge investor sentiment toward underlying economic conditions. We conclude that investors are not being adequately compensated—relative to historical norms—for taking longer-duration credit risk.
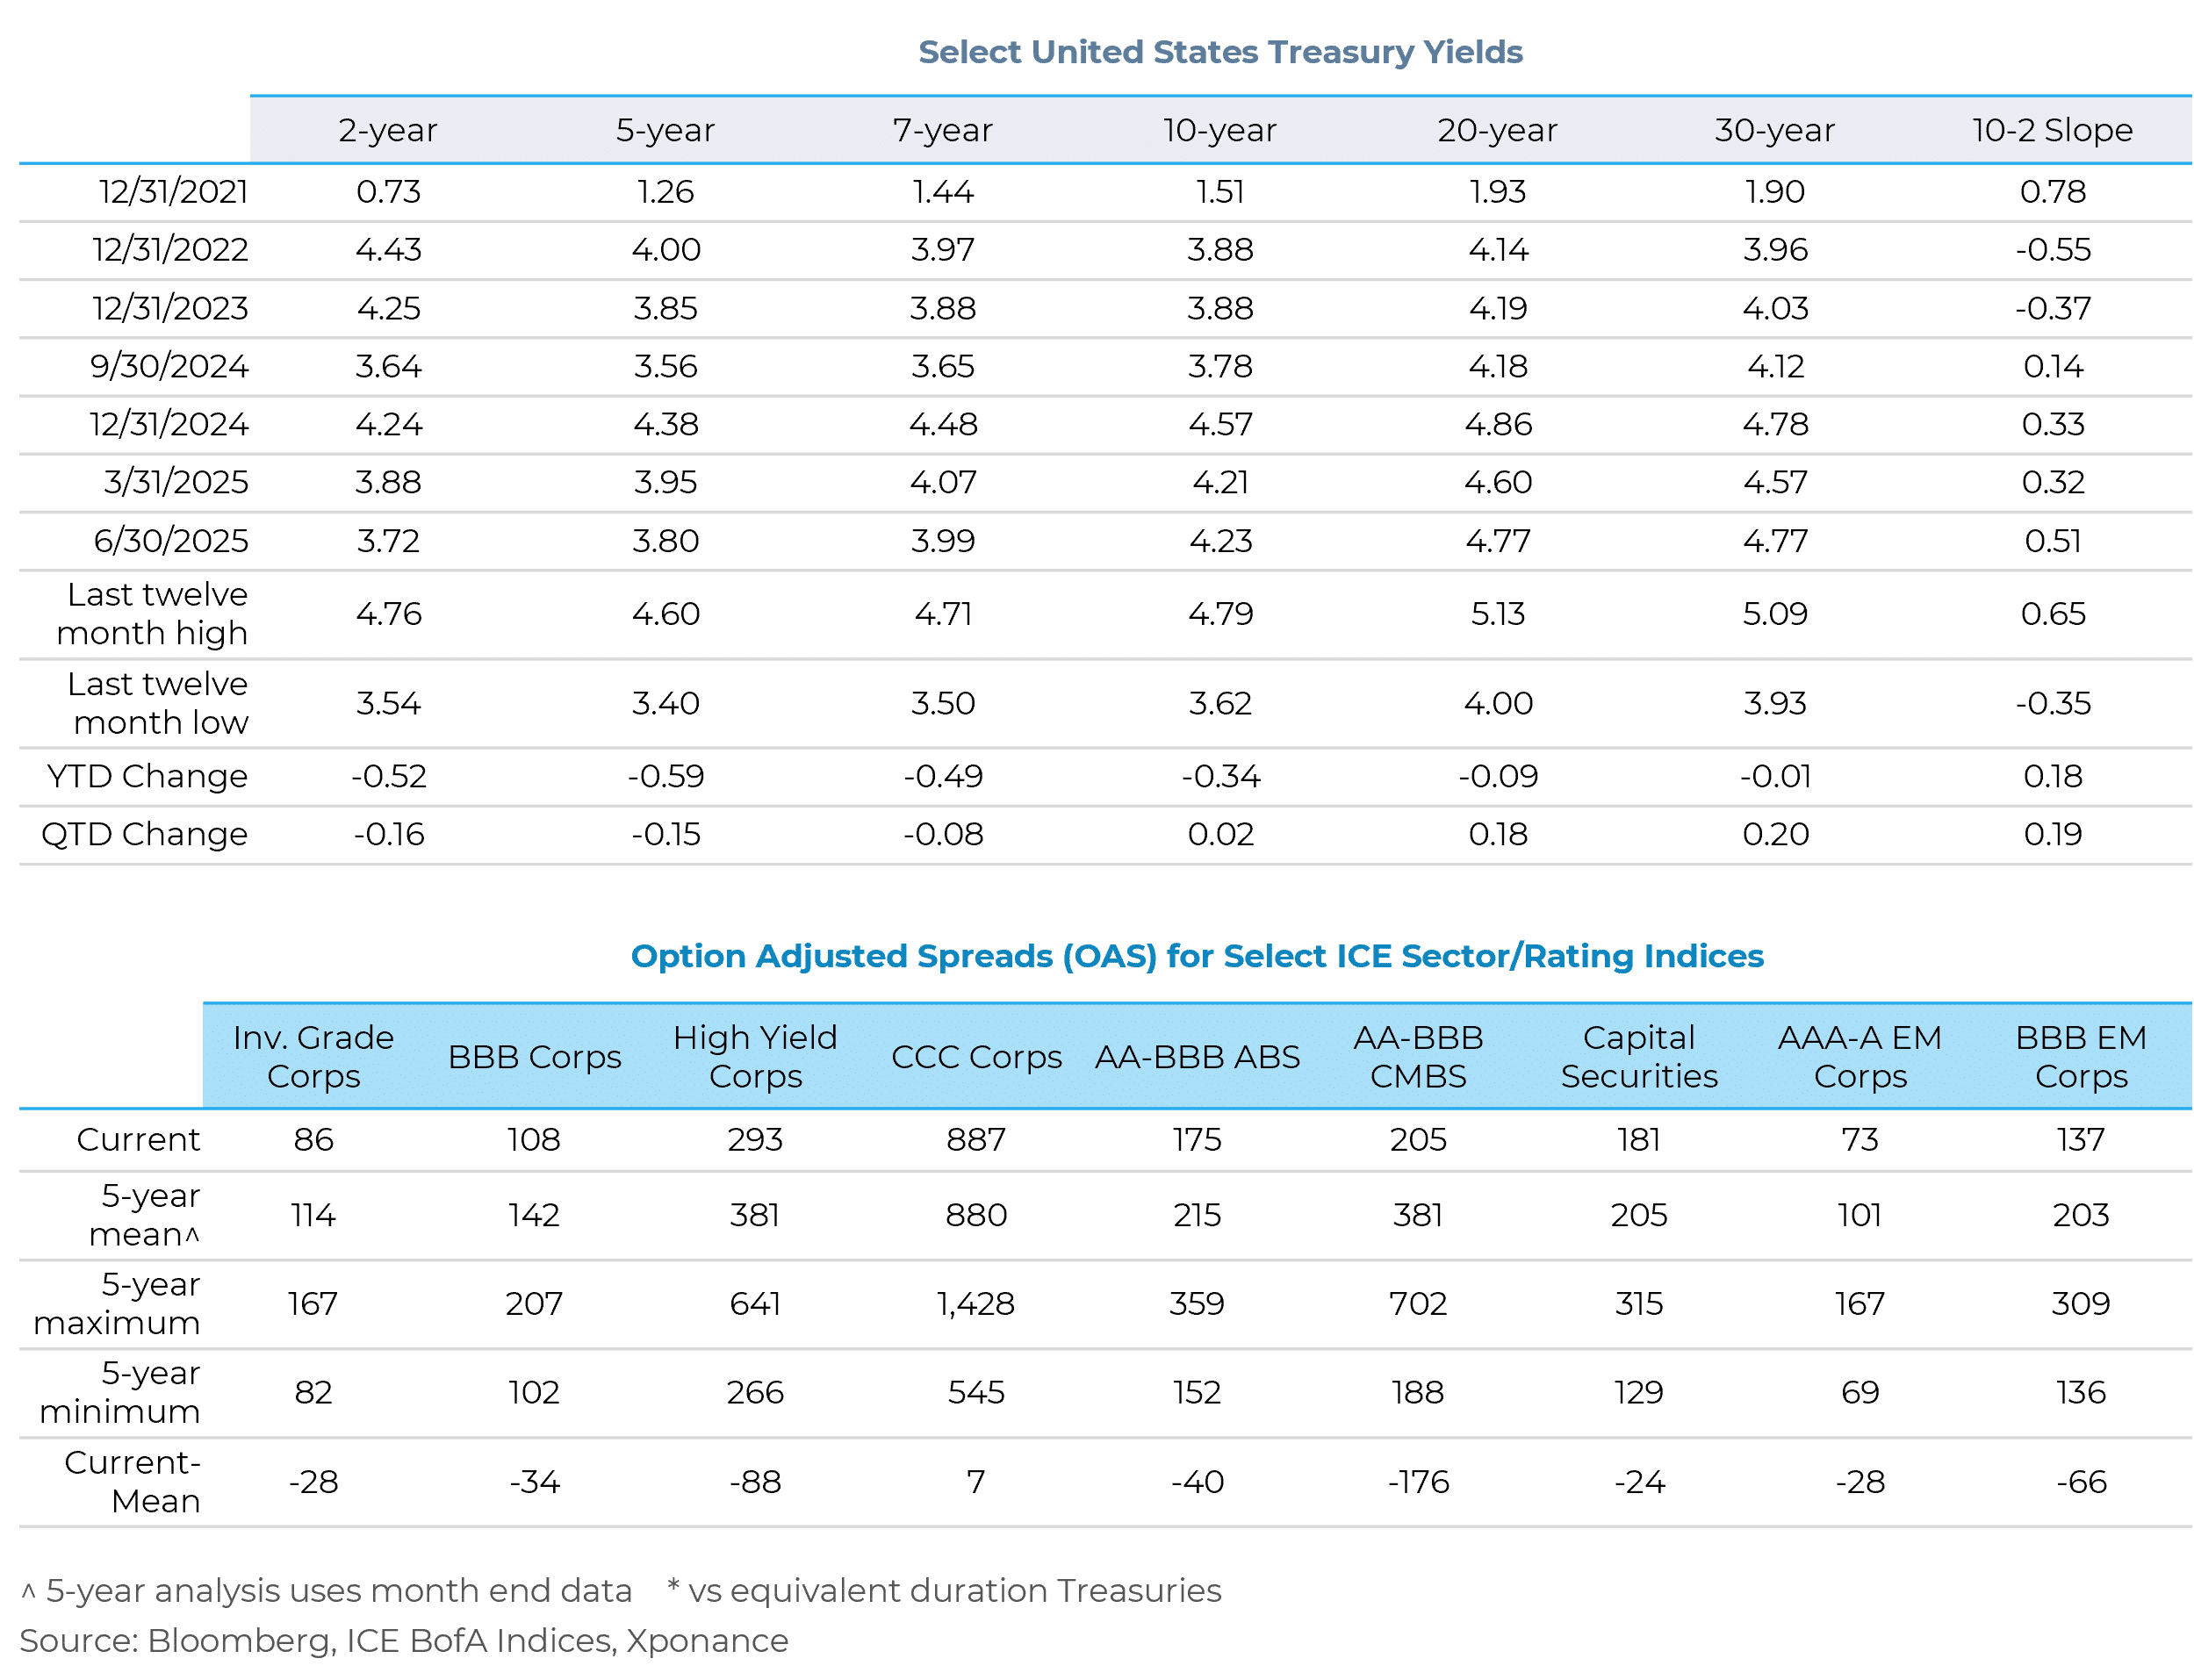
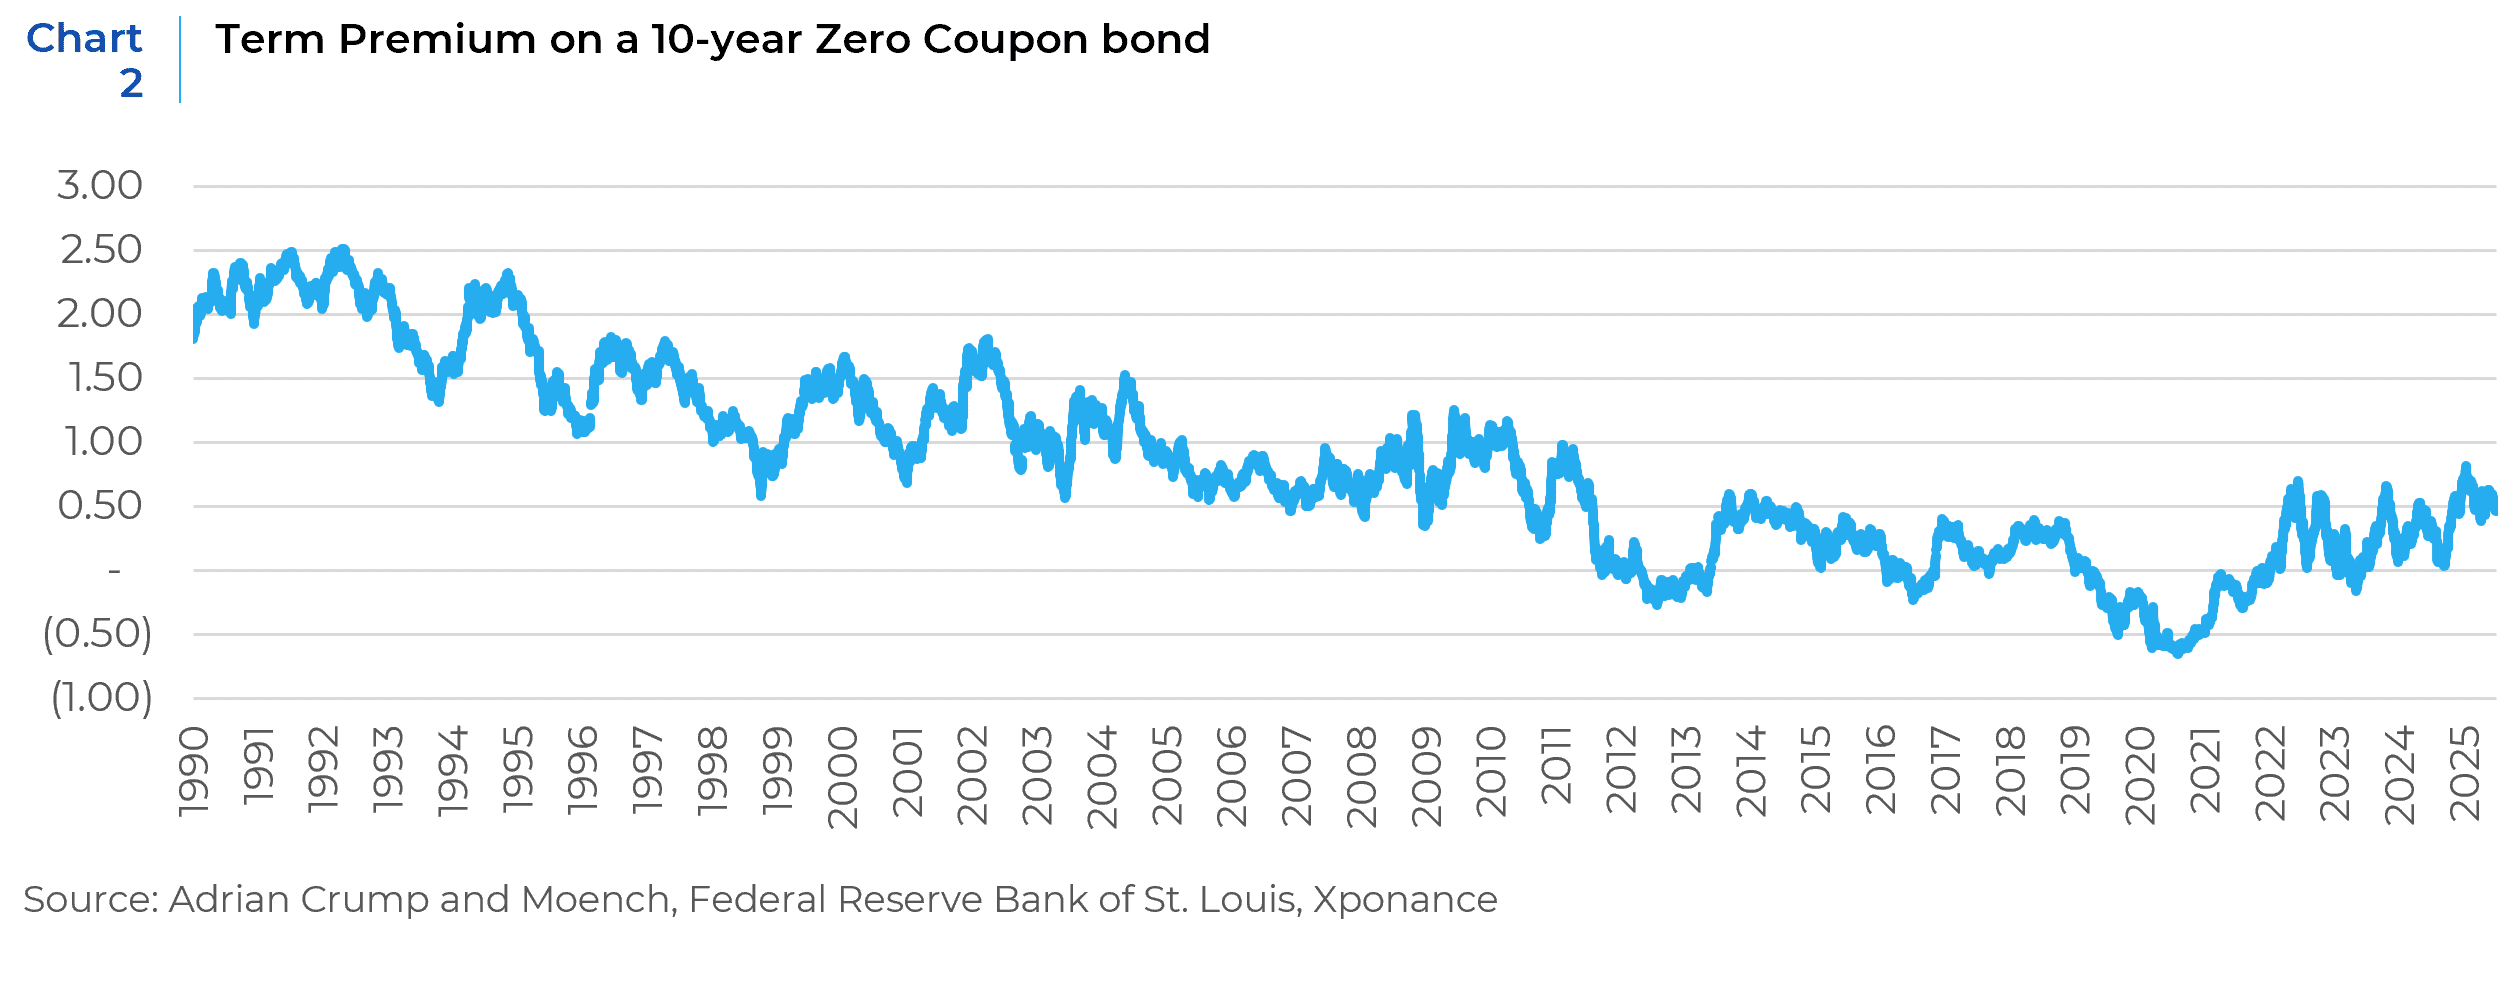
Long-term interest rates tell a more cautionary tale. Yields on longer-maturity bonds remain stubbornly high by post-GFC standards and have yet to rally with the broader Treasury curve. Other developed markets reflect a similar trend: a gradual return to more normalized term premiums, the added compensation investors expect for holding longer-term debt versus rolling over shorter maturities.
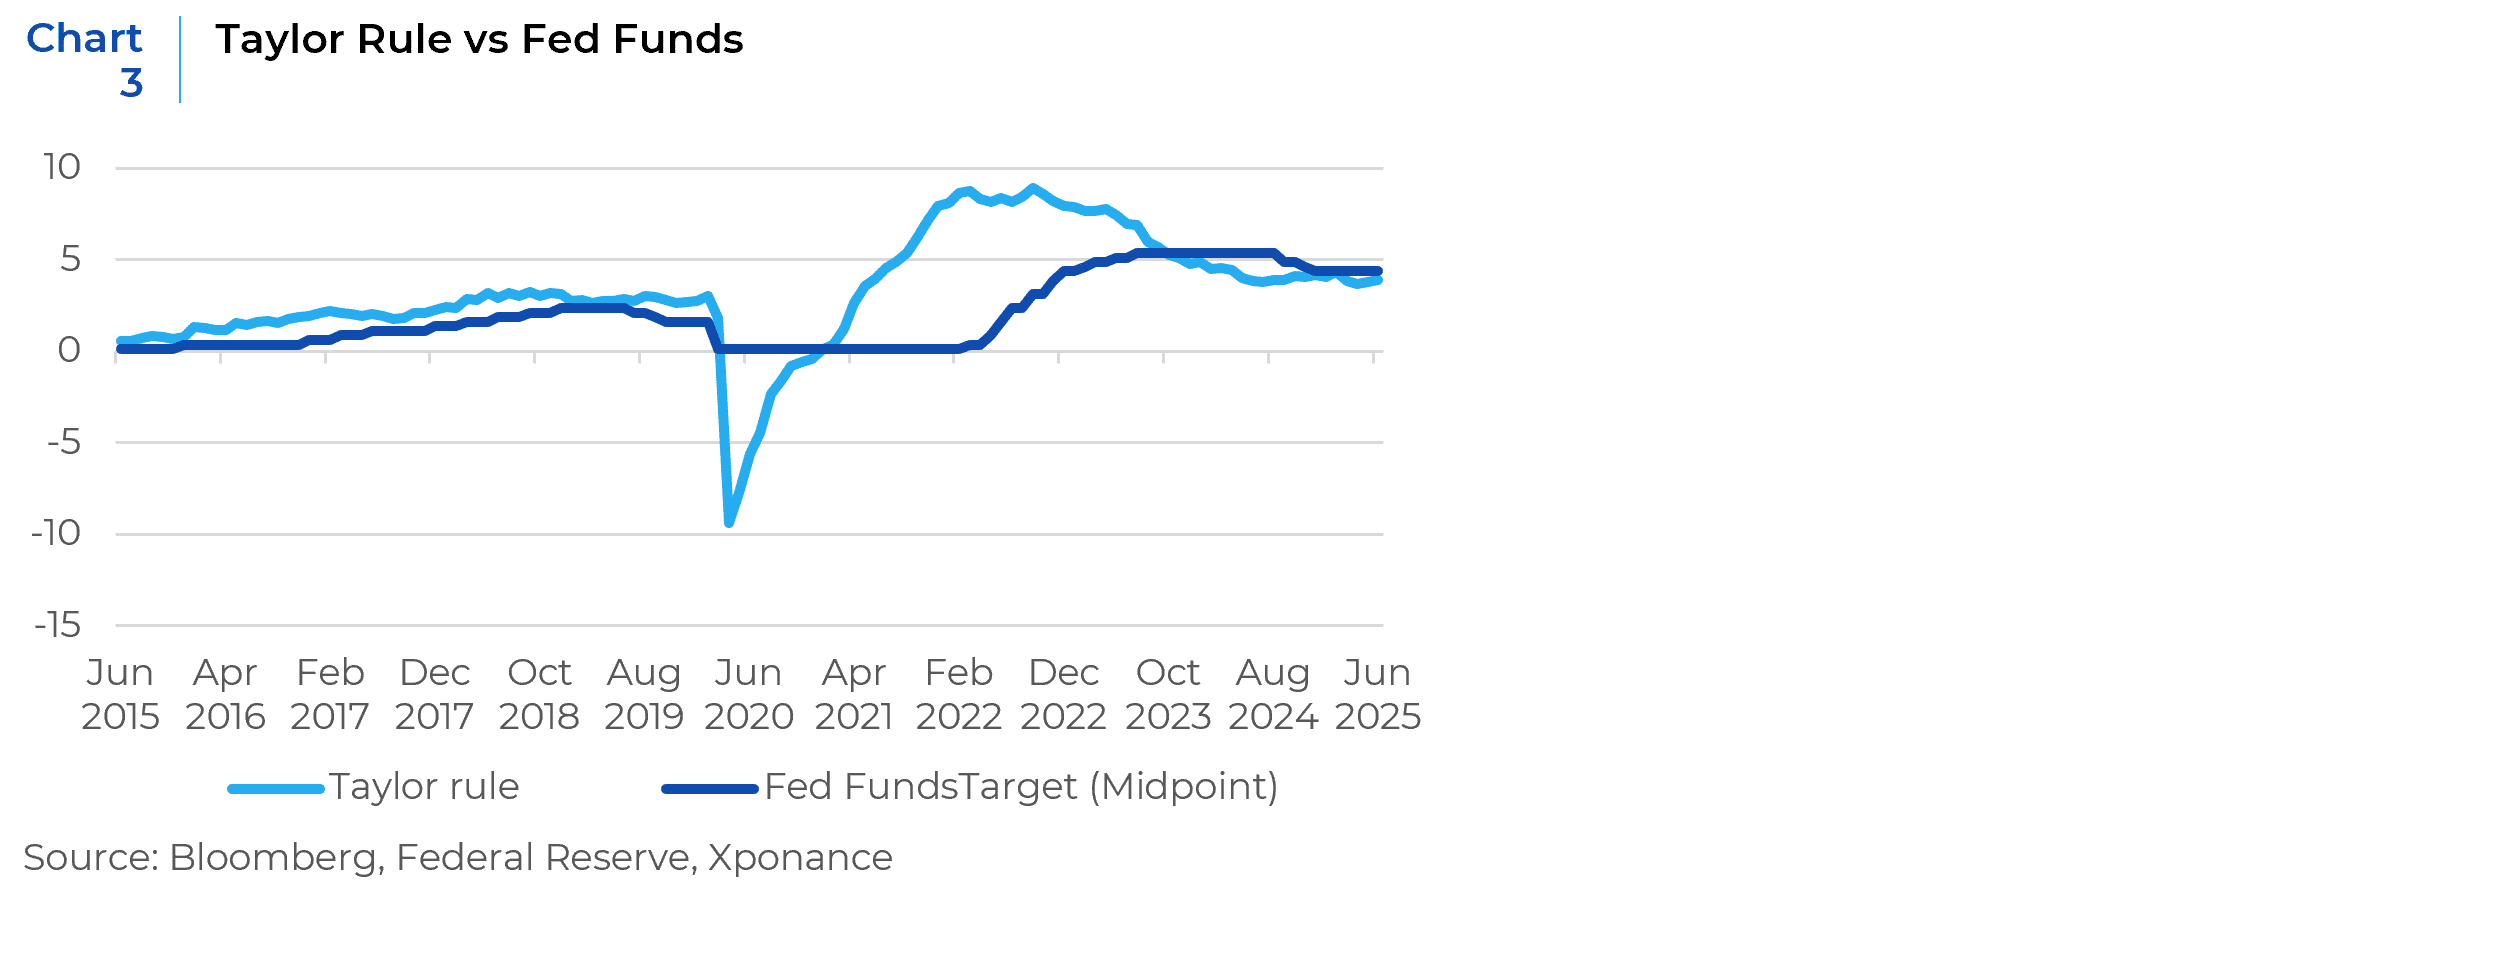
Finally, intensifying debate among market participants and financial media focuses on the appropriate level of Federal Reserve policy rates, as labor market dynamics and inflation remain in flux. Interestingly, the time-tested Taylor Rule indicates that the Fed’s current posture of policy patience may be exactly what the economy needs.
Credit Market Sentiment and Valuation
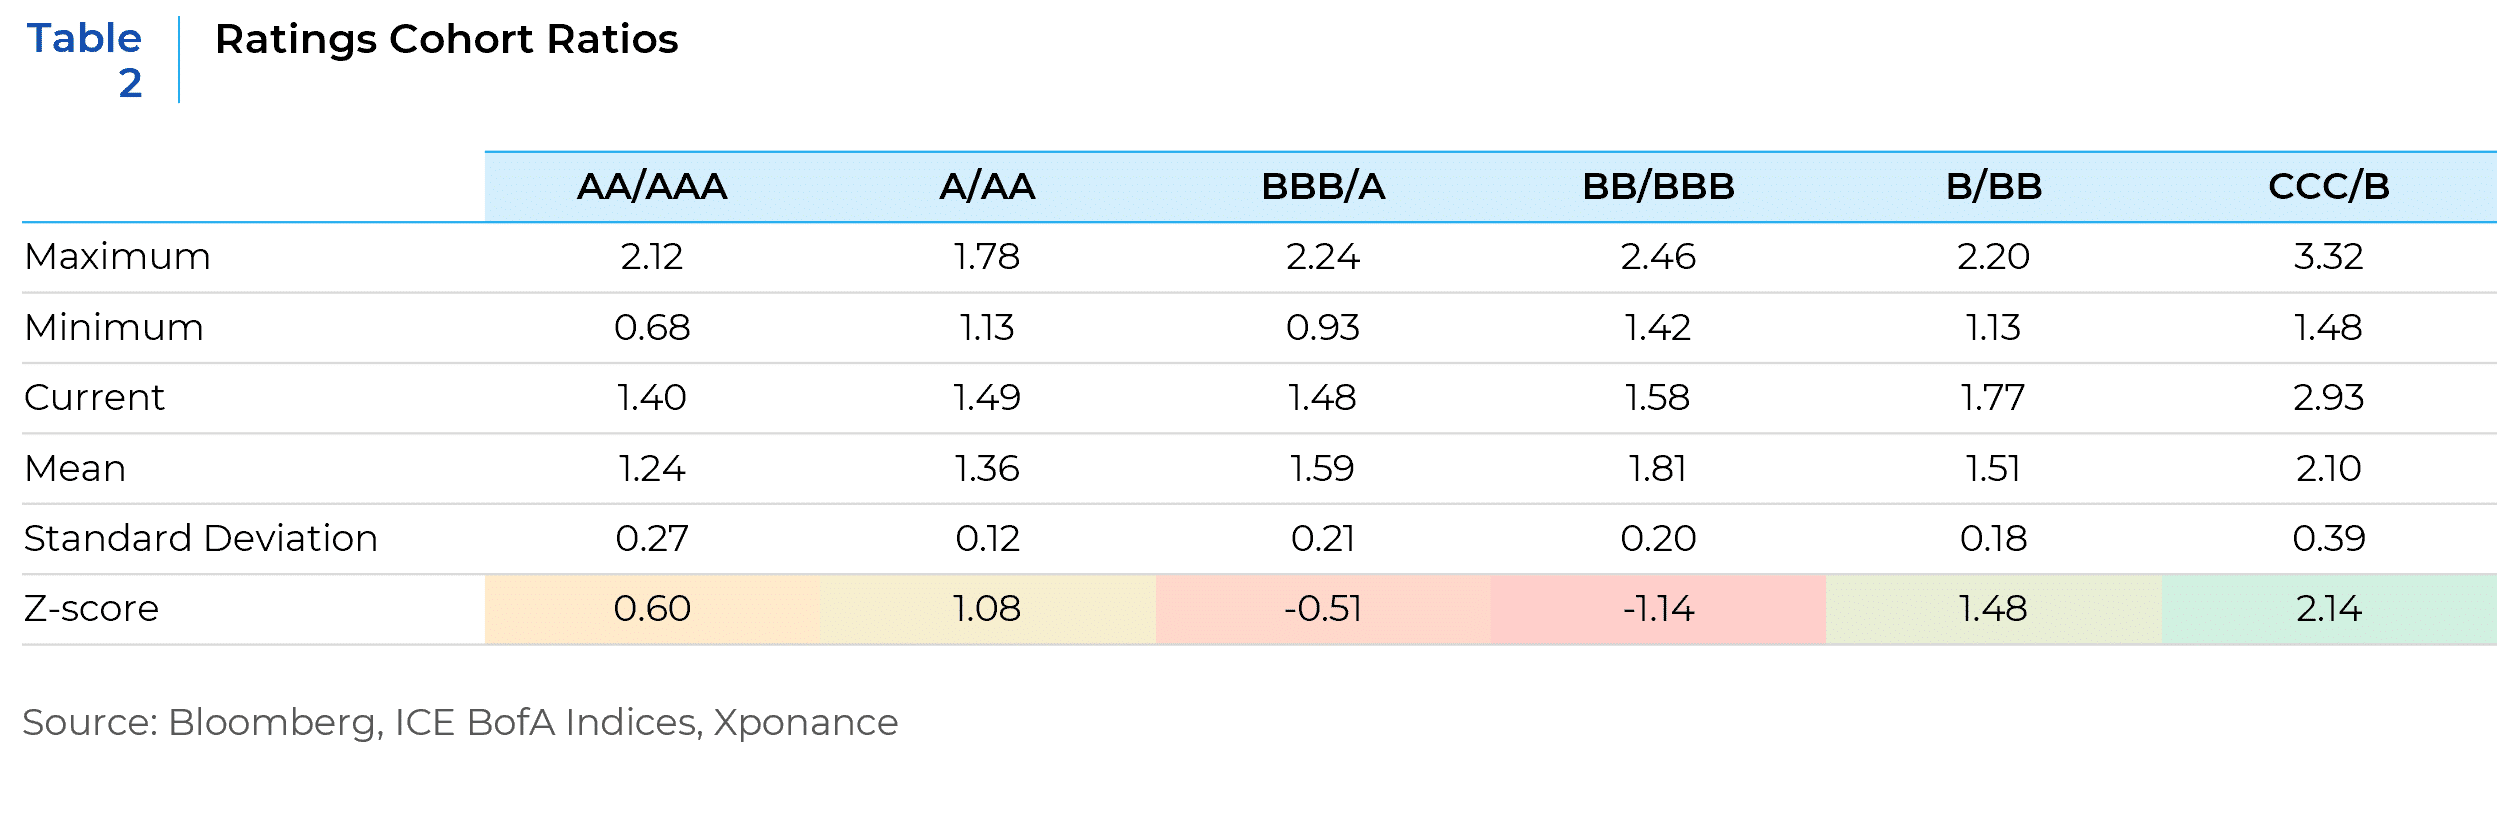
We assess market sentiment and relative value by comparing each ratings cohort to the one directly above it—for example, examining the ratio of triple-B to single-A spreads. While this metric doesn’t serve as a direct proxy for absolute value (i.e., overall spread or yield levels), it offers meaningful insight into historical spread dispersion across credit ratings.
Fundamentally, each step down in credit rating corresponds to a higher probability of credit distress. However, there are important anomalies in the data. Most notably, the scarcity of triple-A and double-A corporate bonds limits the usefulness of their spread ratios in capturing true market dynamics. Today’s corporate index is predominantly composed of single-A and triple-B issuers, making these ratings far more representative of investor risk-reward positioning.
Within high yield, triple-C credits—the lowest tier with roughly a 50% chance of default over five years—appear relatively inexpensive compared to single-Bs. We view this pricing as a warning signal for investment-grade credit, given that triple-C securities are the most volatile slice of the corporate market.
In the crossover space—where triple-B investment-grade bonds overlap with double-B high-yield securities—relative valuations also appear stretched. This suggests that high-yield investors are favoring the highest-quality names in their universe, likely as a defensive posture ahead of potential market turbulence.
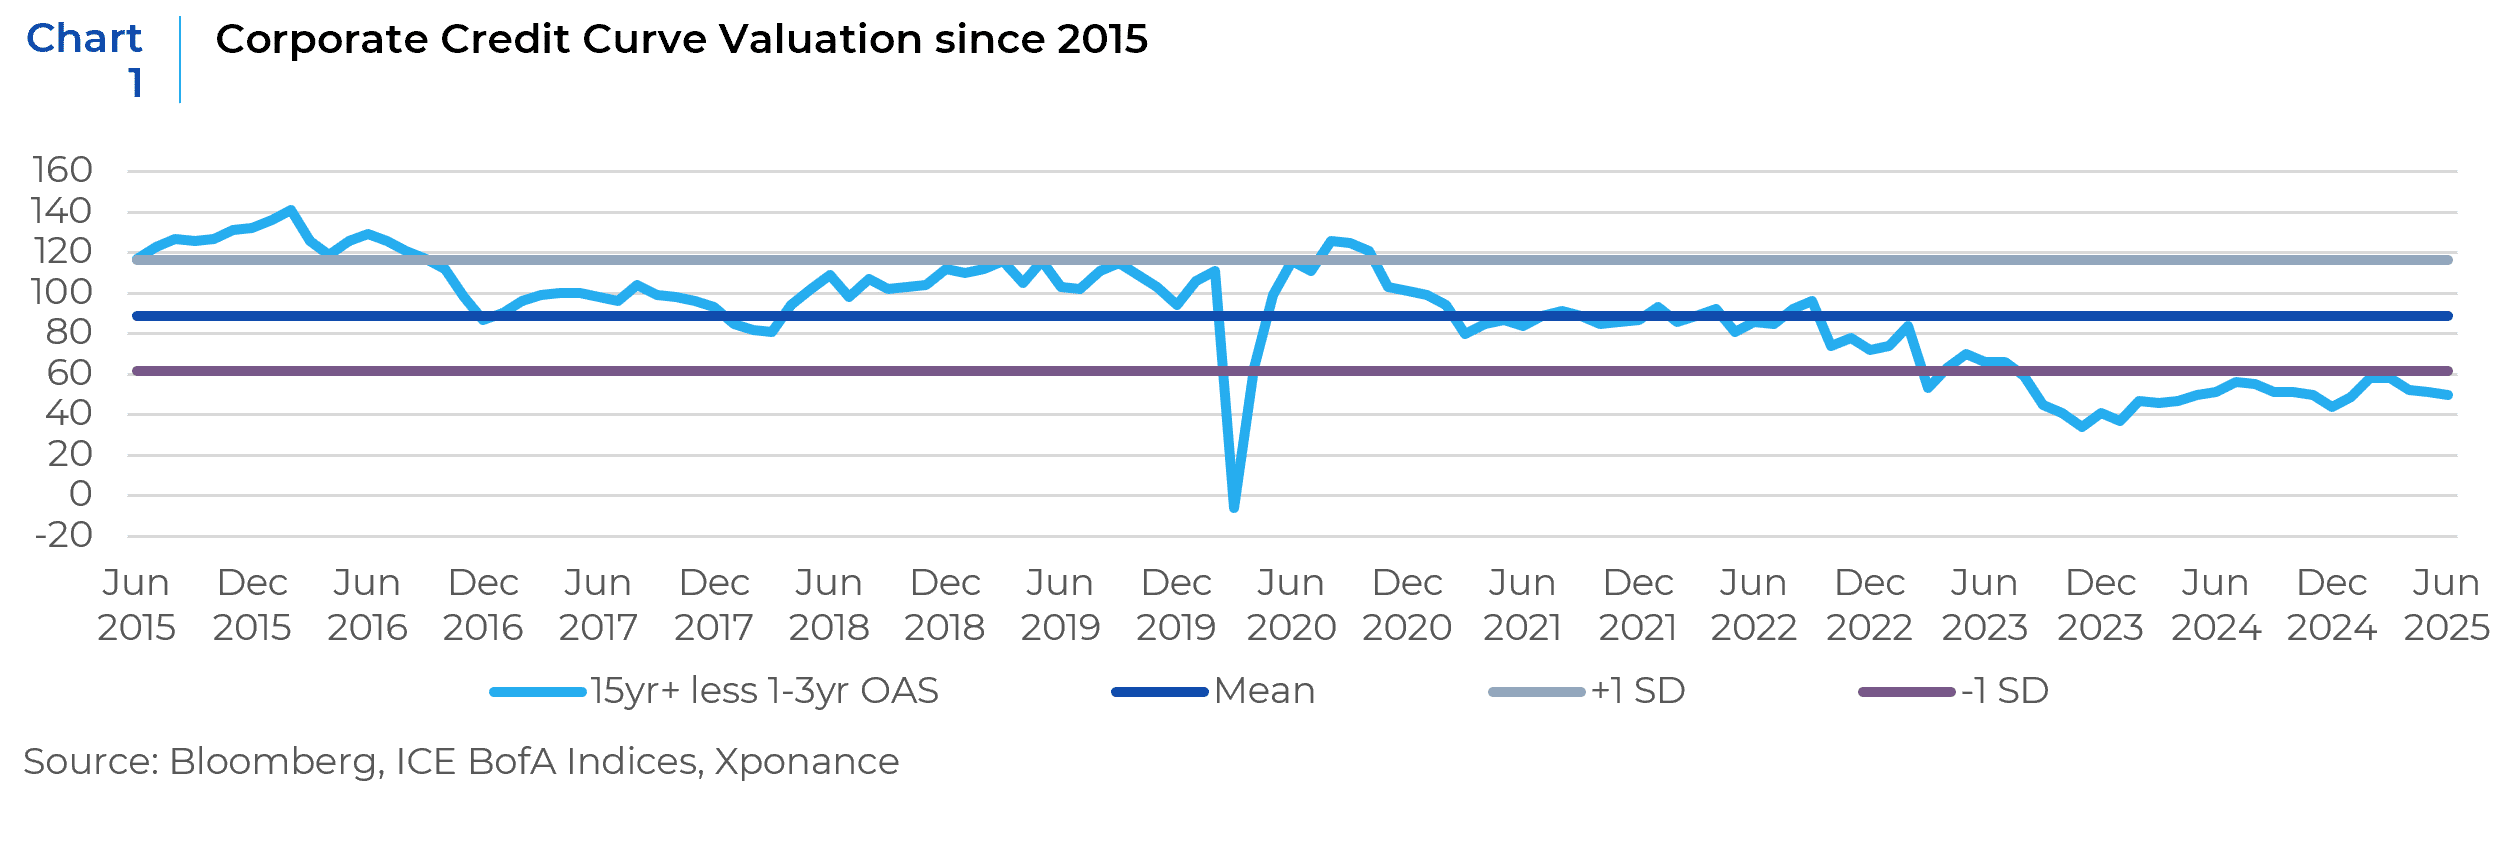
We’ll explore the U.S. Treasury term premium in more detail below, but its reemergence in the Treasury market—though absent in corporate bonds—highlights a noteworthy disconnect within the fixed income universe. To evaluate the relative value of credit curves, we use an index-level comparison using short-duration (1–3 year) and long-duration (15+ year) indices across both the broad corporate market and its ratings cohorts. We last discussed this metric in our 3Q24 review and outlook, and the conclusions remain the same. These curves remain historically flat, providing very little compensation for taking on all the aspects of longer-term credit risk. At current levels, we anticipate a high likelihood of negative excess returns for long credit.
Interest rate markets and the term premium
Interest rate markets in developed economies have repriced the term premium—a shift not seen since the introduction of the Zero Interest Rate Policy (ZIRP) more than a decade ago. Although some market participants consider this development anomalous, the current behavior of rates more closely resembles the pre-quantitative easing era, before zero-bound monetary policies dominated. At Xponance, we view this repricing as reflective of deteriorating debt dynamics across developed markets. In our view, a less open global trade environment has helped usher in a new regime—markedly different from the disinflationary period that followed the Global Financial Crisis (GFC). To illustrate this transition, we present model-implied term premium data for the United States and note that most other developed economies have seen a similar increase in the term-premium.
Several forces contributed to suppressing the term premium in fixed income markets over the past two decades. In addition to widespread quantitative easing and prolonged ZIRP in both the U.S. and other developed nations, the fiscal austerity measures adopted in the immediate aftermath of the GFC helped depress growth and inflation. This policy mix established what many came to view as the new normal for developed markets. Readers may recall the fleeting prominence of Modern Monetary Theory (MMT), which posited that sovereign governments issuing their own currencies could spend freely without needing to balance budgets or raise taxes. MMT was largely enabled by persistently low interest rates, but has since lost momentum as more orthodox economic frameworks have reasserted themselves in today’s non-zero rate environment. Similarly, the idea that developing economies—particularly China—could export disinflation appears to have been a temporary phase rather than a lasting paradigm shift.
To measure term premium in U.S. fixed income markets, we employ the Adrian, Crump, and Moench (ACM) Model, which decomposes Treasury yields into two components: the expected trajectory of short-term rates and the term premium itself. The long-term historical record of the ACM Model strongly supports our thesis, and similar patterns have emerged across other developed markets, where long-term rate behavior increasingly diverges from movements in short-term rates.
Federal Reserve Policy Rates and the Taylor Rule
Our final analysis for the quarter examines how restrictive current monetary policy is—an issue debated in the financial press, among policymakers, and reflected in ongoing shifts in market expectations for the next move in the Fed Funds rate. To anchor this discussion, we rely on the Taylor Rule, developed by economist John Taylor in 1993. The model links the Federal Funds Target Rate to two key variables: the inflation gap (actual inflation minus the target rate) and the output gap (actual GDP versus potential GDP).
Applying the Taylor Rule to current economic inputs suggests an optimal Fed Funds rate that is slightly below the present level. While the model is highly sensitive to assumptions—particularly the measure of inflation and the estimate of the neutral interest rate—our results are consistent across various parameter choices. This implies that policy is modestly restrictive at current rates, a stance that Chair Powell has acknowledged in both congressional testimony and post-meeting remarks. We would point out, however, that financial conditions do not seem restrictive currently, given the high levels of equity markets and overall exuberance in other alternative asset classes like cryptocurrency.
Although inflation has cooled from its post-pandemic peaks, it remains above the Fed’s 2% target. Moreover, several components of inflation data show persistence or signs of reacceleration. Alternative measures, such as the Atlanta Fed Sticky CPI, reinforce policymakers’ cautious approach. For instance, that metric currently registers at 3.44% (on a trailing three-month annualized basis) and has recently edged upward from post-COVID lows.
On the output gap side, the U.S. economy continues to grow, albeit unevenly. Strength in select sectors contrasts with weakness in others—particularly manufacturing, according to BEA data and regional surveys. Overall, the output gap is modest but positive. Employment trends remain solid, even as wage growth moderates. However, the recent decline in labor force participation—despite a low unemployment rate—raises concerns. This development is generally viewed as unhealthy for labor markets and warrants close monitoring.
Against this backdrop of uncertainty, how should fixed income investors position portfolios? Using our suite of historical relative value tools, we’ve identified several strategies to enhance yield while mitigating downside risk from adverse movements in spreads and interest rates. With sector spreads—and the underlying corporate constituents—currently showing minimal differentiation, investors can construct portfolios that deliver similar yield profiles but with lower downside exposure by selecting securities that historically exhibit lower maximum spread expansion during periods of market stress. These securities resemble low-beta stocks in equity indices: limited upside at current spread levels, but greater resilience during periods of volatility.
Based on our term premium and credit curve analysis, portfolio managers can preserve both yield and duration by focusing on intermediate maturities—the “belly” of the Treasury and corporate curves—while waiting for more favorable entry points in longer-dated instruments (20+ year maturities).
We continue to favor asset-backed securities, which offer attractive yield per unit of duration and maturity, especially compared to similarly rated corporate bonds. Although mortgage-backed securities (MBS) appear relatively attractive on a historical and risk-adjusted basis, their absolute yields remain less compelling compared to other core fixed income alternatives.
Overall, our portfolios have adopted a more defensive stance from a risk budgeting perspective, yet still maintain overweight allocations to both corporate bonds and ABS.
This report is neither an offer to sell nor a solicitation to invest in any product offered by Xponance® and should not be considered as investment advice. This report was prepared for clients and prospective clients of Xponance® and is intended to be used solely by such clients and prospective clients for educational and illustrative purposes. The information contained herein is proprietary to Xponance® and may not be duplicated or used for any purpose other than the educational purpose for which it has been provided. Any unauthorized use, duplication or disclosure of this report is strictly prohibited.
This report is based on information believed to be correct but is subject to revision. Although the information provided herein has been obtained from sources which Xponance® believes to be reliable, Xponance® does not guarantee its accuracy, and such information may be incomplete or condensed. Additional information is available from Xponance® upon request. All performance and other projections are historical and do not guarantee future performance. No assurance can be given that any particular investment objective or strategy will be achieved at a given time and actual investment results may vary over any given time.