
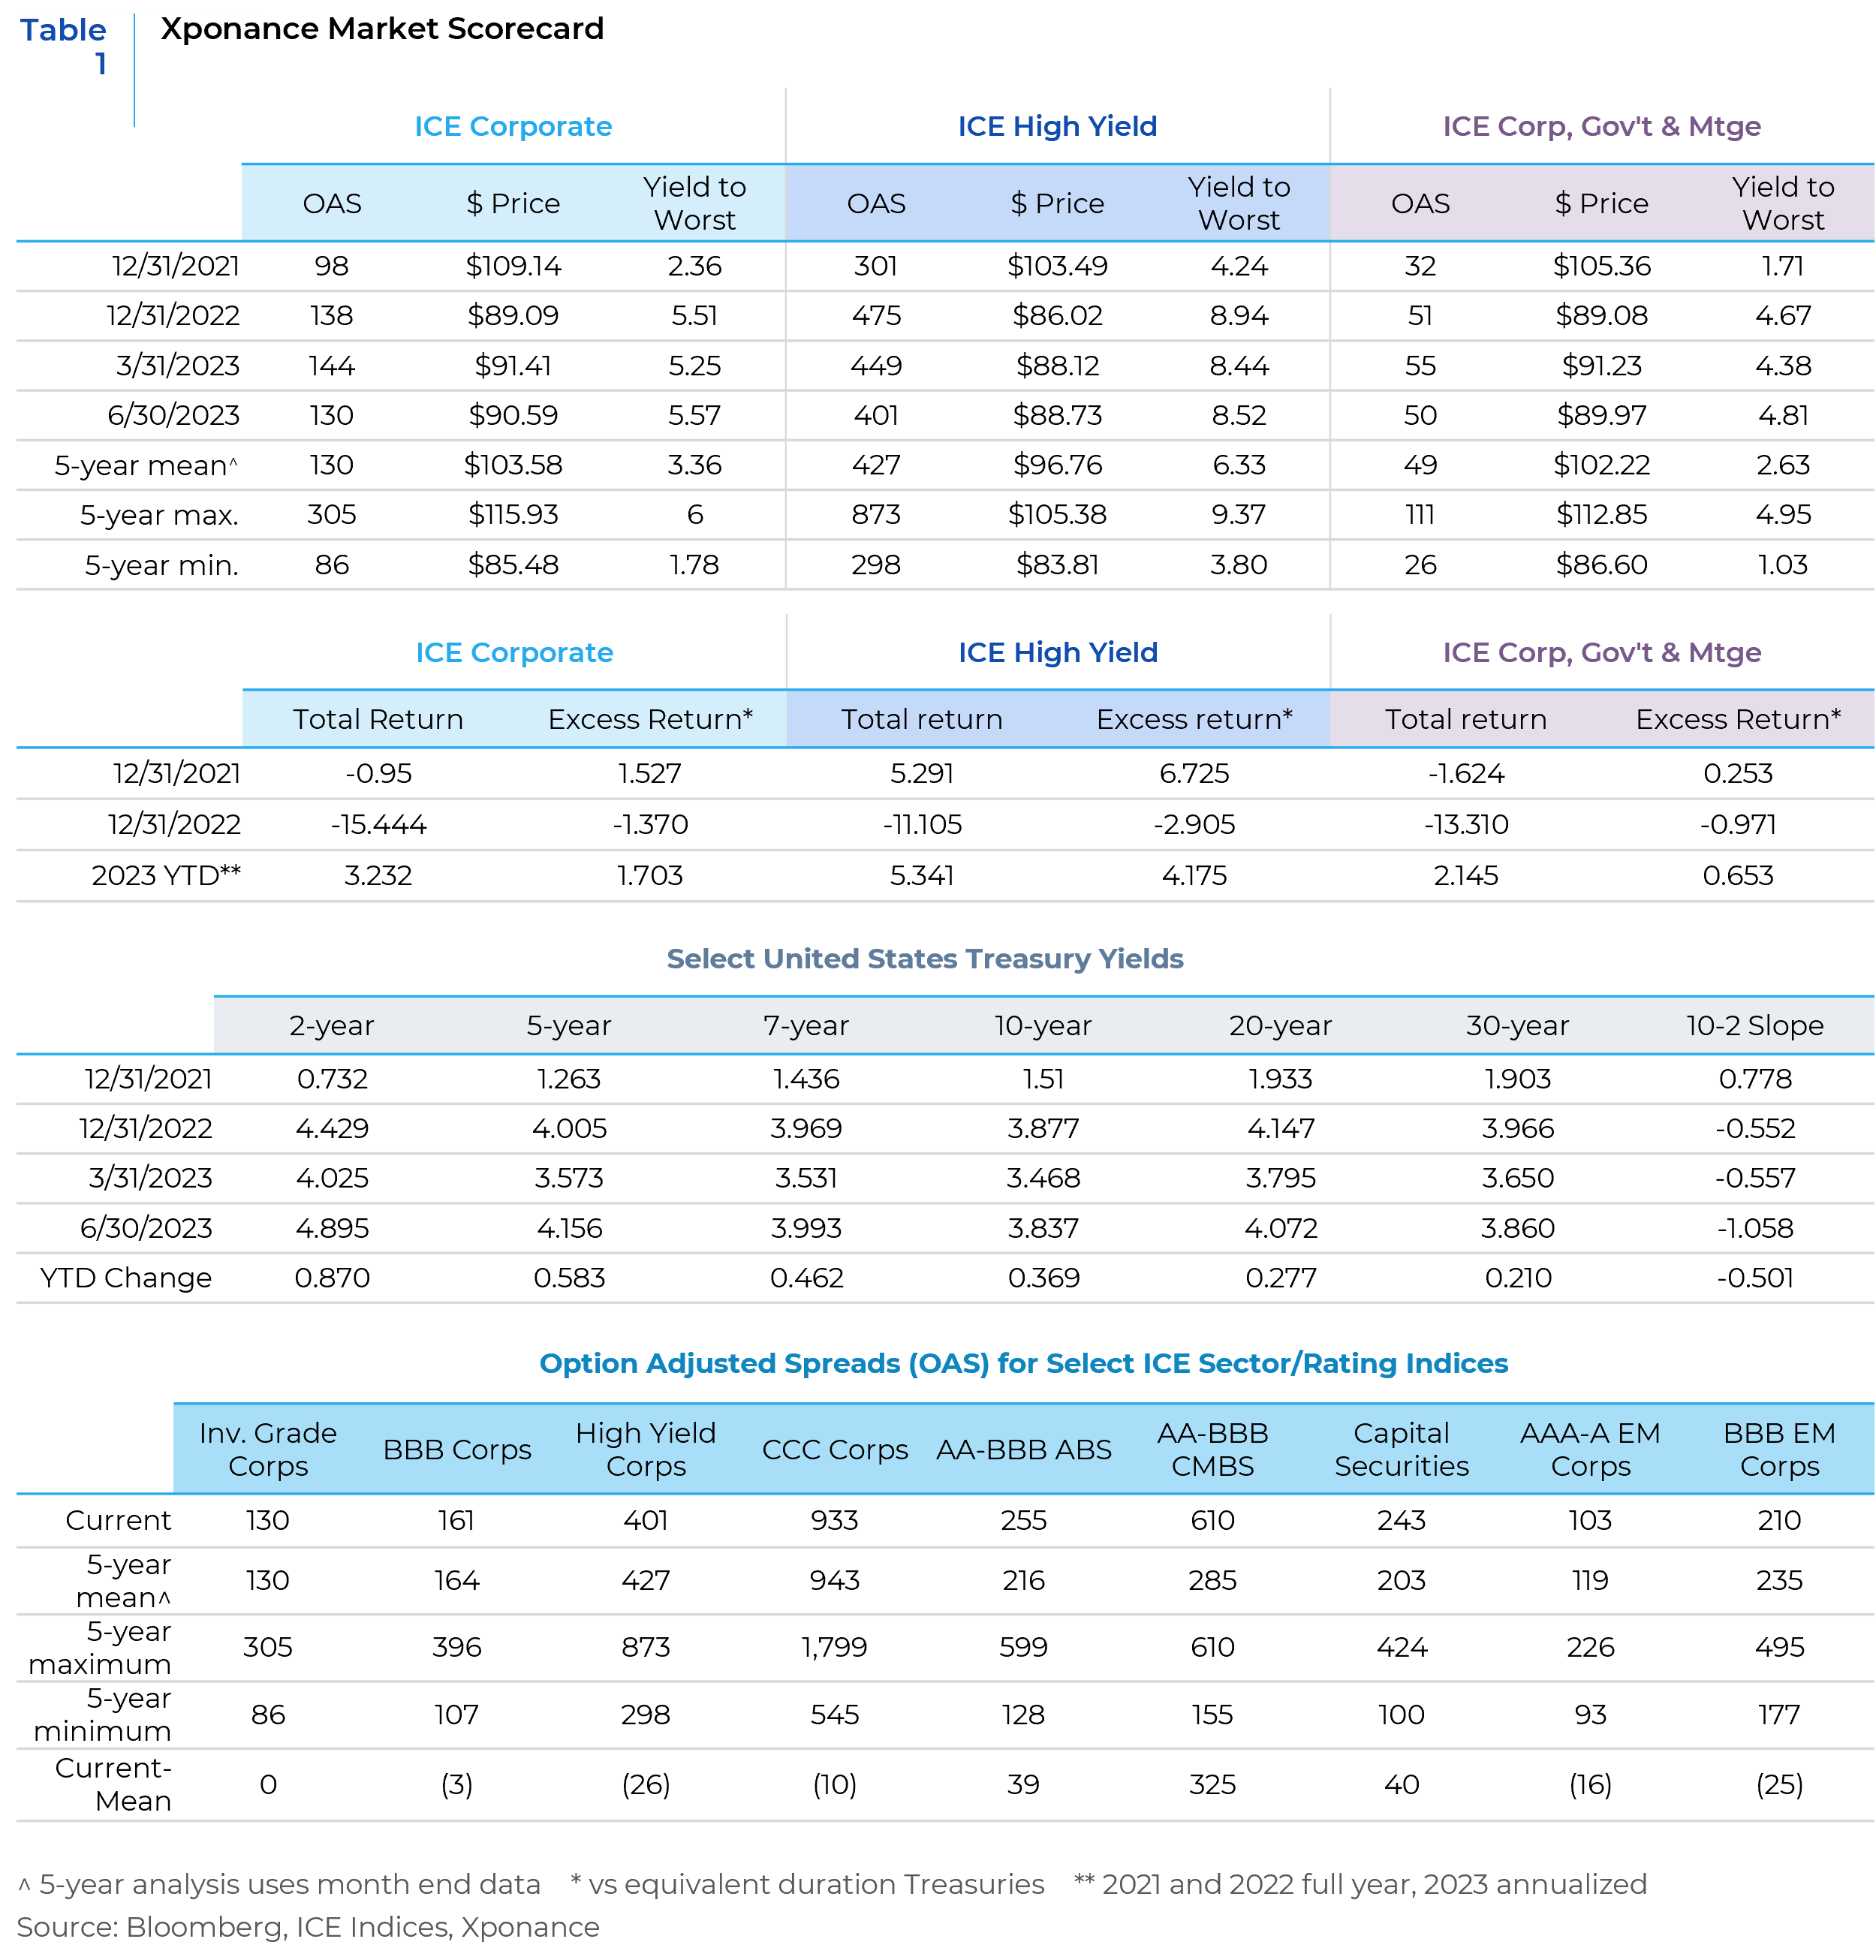
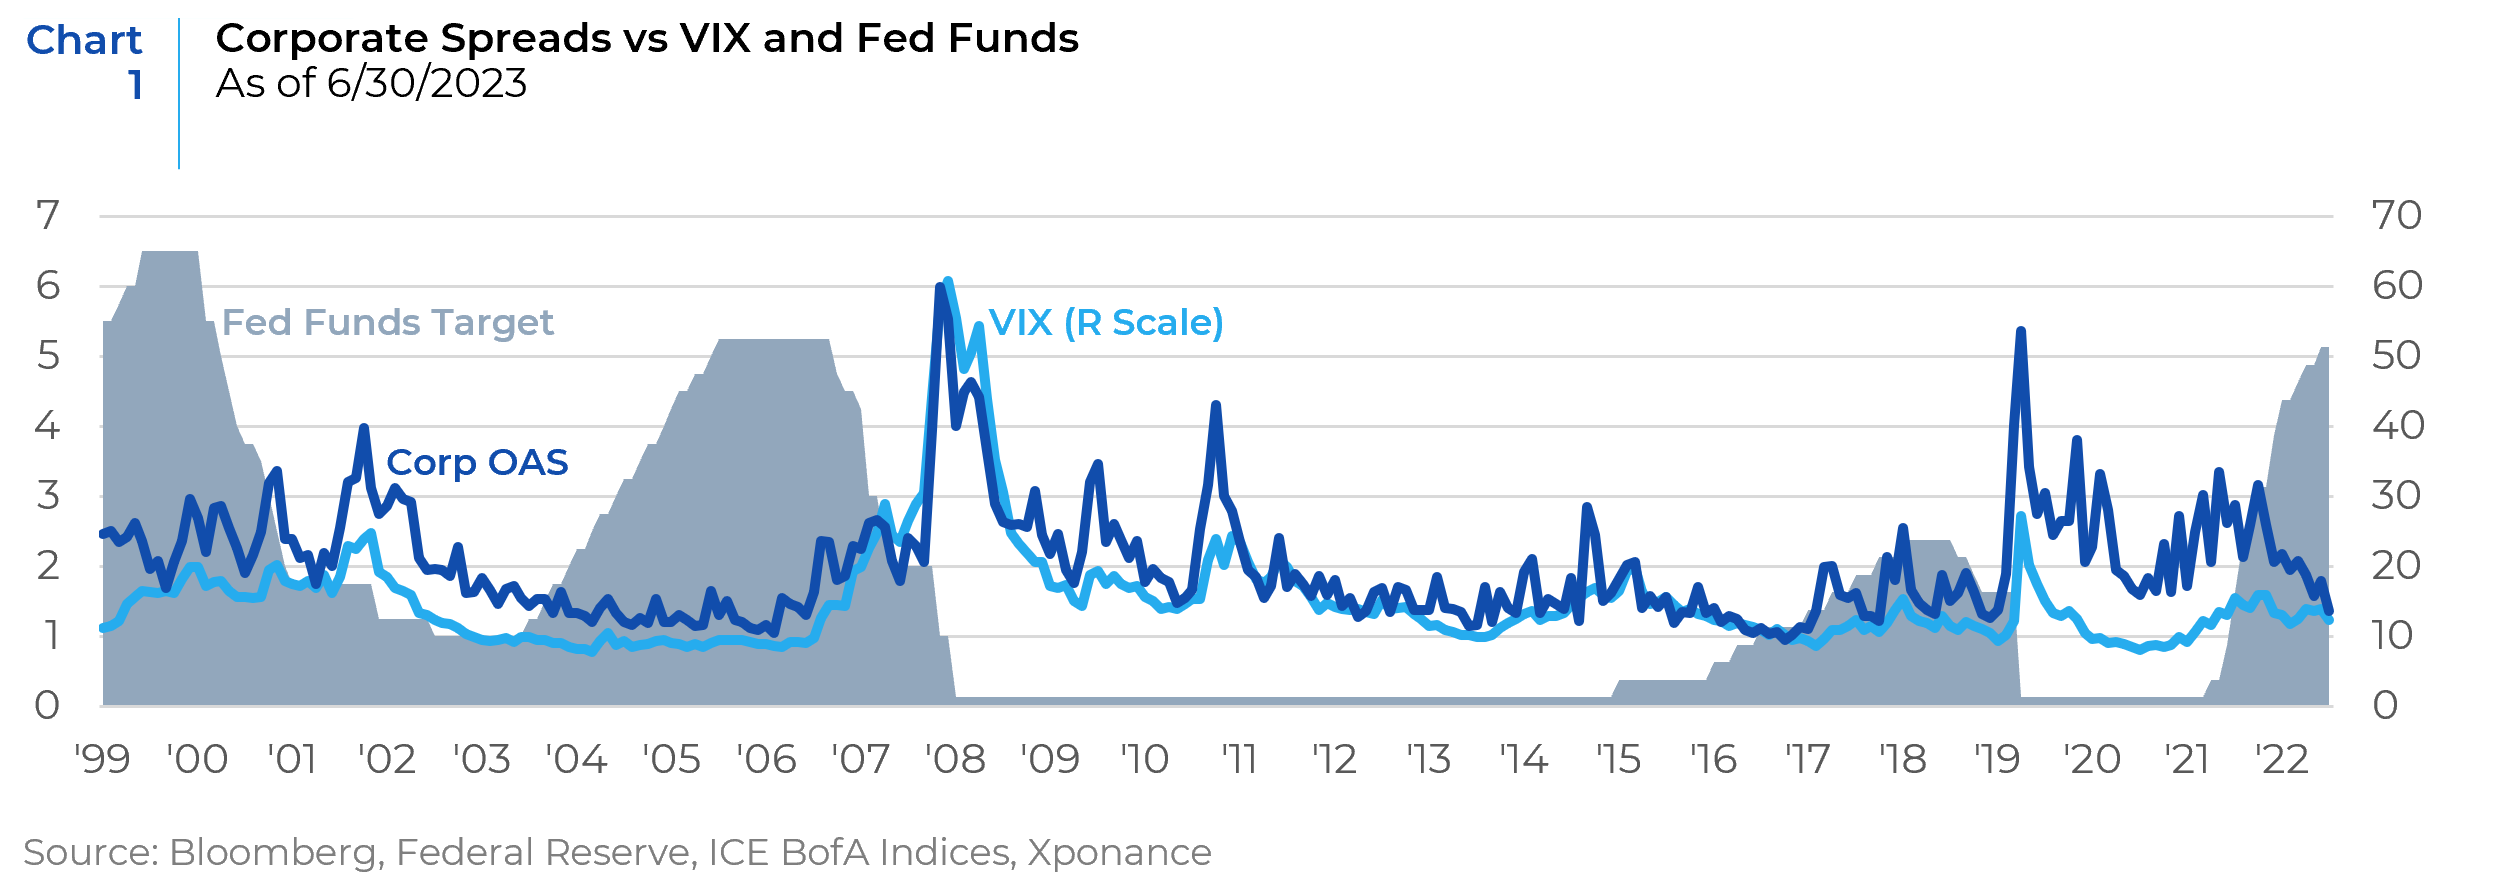
Given how orderly markets have been thus far in 2023, we remain wary about the outlook for fixed income risk assets over the remainder of the year from a spread perspective. As noted above, volatility has subsided as we near the end of the monetary tightening campaign. We do not believe policy will immediately pivot to an easing stance after the final increase in the Fed Funds rate, but risk markets do seem to be pricing in a “no landing” scenario for the economy. When we parse interest rate sensitive economic data, (i.e., auto loans, credit card rates, mortgage rates), there is little reason to believe that this tightening cycle’s sharp increases in interest rates will not filter through to the real economy. As such, the “no landing scenario,” is unlikely, making the conflicting signals from the Treasury market and risk markets untenable. The relationships between equity markets, credit markets, the yield curve, the fed funds rate, etc. are the result of historical experience as markets react to reduced economic activity (see chart, below). We expect these relationships to normalize as the economic cycle plays out.
Besides the drop in volatility giving an all-clear signal to markets, another primary explanation for these anomalous relationships is the yield available in the marketplace and the various technical factors this produces. We have written in the past about yield and spread break-evens, which measure the amount of increase in yield (whether from rates or spreads) that a given fixed income security can withstand before negative price return outweighs the yield (creating negative total return). Given the current rate regime, break-evens are relatively attractive. And, while spreads are at best fair value, the average coupon available for a par bond is currently much higher than the average coupon available for the market as a whole (and as measured by the major investment grade indices). This factor has produced positive sentiment for current coupon spread product and has put a floor under new issue pricing in both corporate and securitized markets. The fact that so many bonds are trading with exceptionally low dollar prices (given meagre coupons) has contributed to pockets of negative sentiment that contrasts with the overall desire for yield. This condition has led to a bifurcated market for deeply discounted versus par bonds or even premium bonds. Extremely low coupon (i.e., sub 1%) callable US Agency paper, for example, has become extremely illiquid. Clearly, directionality of rates and not yield level is the most significant determinant of total return. The composition of the underlying yield, however, has never been as important as it is today for a range of reasons.
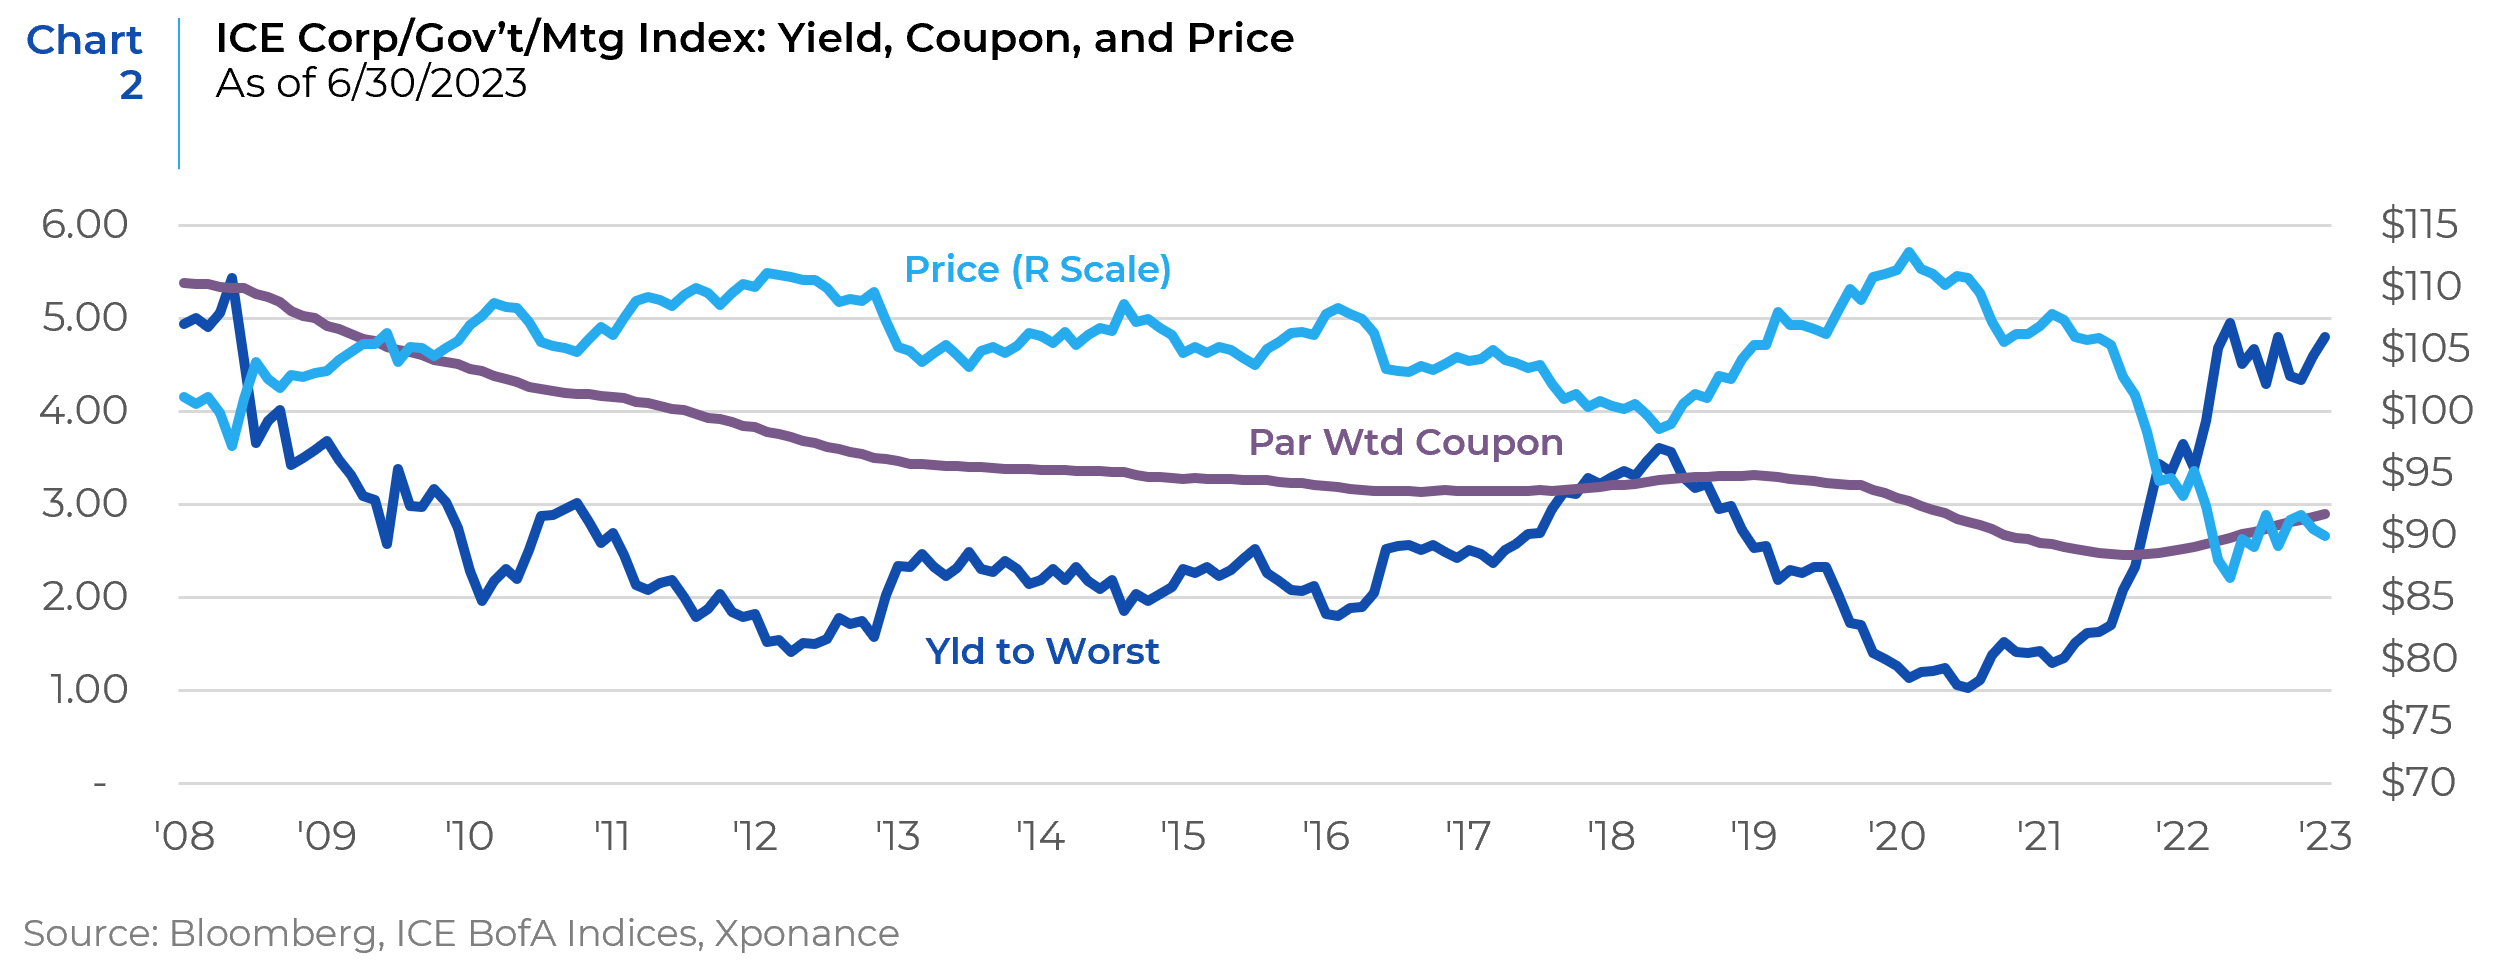
Since rates have been generally falling over the past three plus decades, investment grade bond indices have had an underlying coupon greater than the yield on the index (with the corresponding dollar price above $100). Now, however, that paradigm has been turned on its head. With the yield much higher than the coupon, most of the yield on the index (and thus most tradeable bonds in the marketplace) comes from accretion rather than income. This dynamic has major real-world implications for return streams. While we can think of that accretion as straight-line accounting occurring equally over the remaining years until maturity, the actual market value change (“pull-to-par” in the jargon) does not occur until the bond is approaching maturity (all else equal). By extension, the deeply discounted bond will not realize its yield until nearing maturity (since the semi-annual income will only be a small portion of the overall yield and the accretion happens in the last couple of years). While this seems obvious from a bond math perspective, it has never been so stark, as the coupon range for the constituents of the indices has been closely distributed on either side of $100 for most bonds. This phenomenon also contributes to increased portfolio volatility and tracking error since rate moves will have an outsized impact on total returns. It is worth noting that the dollar price history is much different for high yield, as these instruments and indices have traded at meaningful discounts during every historical period of economic dislocation given the default component of high yield spreads coupled with lower correlation to interest rates.
If we dig deeper into the discounted bond phenomenon, there are a range of trading strategies one can employ to capitalize on the phenomenon in investment grade markets. These exist across the high-grade fixed income sector landscape. Consider, for example, the agency MBS (Mortgage-Backed Securities) market. For many years, a primary trading strategy was to try to buy prepayment protection as cheaply as possible, or by finding diverse ways to achieve prepayment protection than the market anticipated. Now, the exact opposite is true. Since MBS pays a portion of principal monthly, investors can buy discounted bonds with the intention of receiving faster prepayments than the market anticipates. This gets around the problem of the “pull-to-par” only happening in the final couple of years of a bond’s life. For high grade paper with a potential “regulatory” call (i.e., bank paper with changing capital treatment, like some hybrid securities) there is the potential to buy discounted paper where the option is out of the money on an economic basis, but the need to call the paper for regulatory reasons can result in an outsized yield-to call. In corporate or other credit markets, there are opportunities in pairing high coupon trades with lower coupon trades to achieve a dollar price barbell. One can, for example, buy a high beta (but still investment grade) security at a deep discount (which protects against downside price action.) This can be combined with a higher dollar price/high coupon instrument for a lower beta issuer. In this way, we can create a higher yield and income trade while maintaining a convexity advantage at the pair or portfolio level. By deploying this strategy through a fundamental lens, we have been given a rare opportunity (for investment grade bonds) to express a view not only through relative spread levels but through dollar prices as well. In the case of high yield bonds, we can give ourselves greater protection by buying slightly discounted bonds that still have solid coupon income as compared to the broader markets.
While we think the second half of the year could see a return to volatility as economic data continues to moderate, we also see more opportunity in fixed income from a total return perspective than we have seen in quite some time. Excess returns will likely be volatile as market conditions change, the yield curve re-steepens, and certain asset classes continue to exhibit idiosyncratic returns. Nonetheless, as we have noted, attractive yields should serve to keep returns in positive territory for the investment grade space. We are more cautious about high yield returns given greater economic sensitivity and lower correlation with interest rates.
This report is neither an offer to sell nor a solicitation to invest in any product offered by Xponance® and should not be considered as investment advice. This report was prepared for clients and prospective clients of Xponance® and is intended to be used solely by such clients and prospects for educational and illustrative purposes. The information contained herein is proprietary to Xponance® and may not be duplicated or used for any purpose other than the educational purpose for which it has been provided. Any unauthorized use, duplication or disclosure of this report is strictly prohibited.
This report is based on information believed to be correct, but is subject to revision. Although the information provided herein has been obtained from sources which Xponance® believes to be reliable, Xponance® does not guarantee its accuracy, and such information may be incomplete or condensed. Additional information is available from Xponance® upon request. All performance and other projections are historical and do not guarantee future performance. No assurance can be given that any particular investment objective or strategy will be achieved at a given time and actual investment results may vary over any given time.