
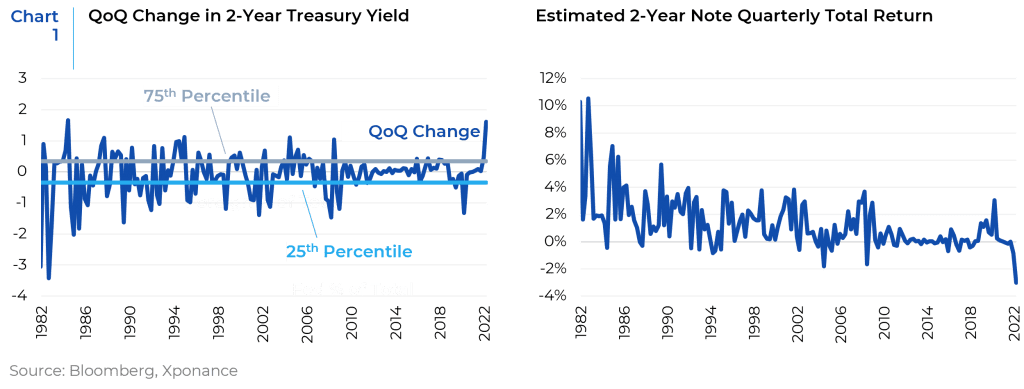
As we close what has been among the most tumultuous quarters in fixed income history, we are struck by the fact that we are about to discuss interest rate moves and total returns of historic magnitude. Unfortunately, the past two years have led us to utter similar statements rather often. Last quarter, we also noted that an inflection point was upon us. But, while interest rate markets had begun to digest the task the Federal Open Market Committee (FOMC) has ahead of it, the rest of 1Q22 was a blur of interest rate and spread premia volatility. For the front-end of the yield curve (using the 2-year Treasury note as a proxy) the upward movement in rates was the largest quarterly movement since 1984. More importantly however, given the extremely low starting yield as compared to the double-digit yields on offer back in 1984, 1Q22 was the worst quarter for total return on the 2-year note in the post-Volcker era. For the broader Treasury market, 1Q22 was the worst for total return going back to 1980. The investment grade corporate market also experienced dismal returns, largely due to a very long duration profile relative to many other indices (and as compared to historical measures). High yield corporates held in relatively well given both shorter duration and higher starting yields which provided reasonable protection against the relentless rise in interest rates.
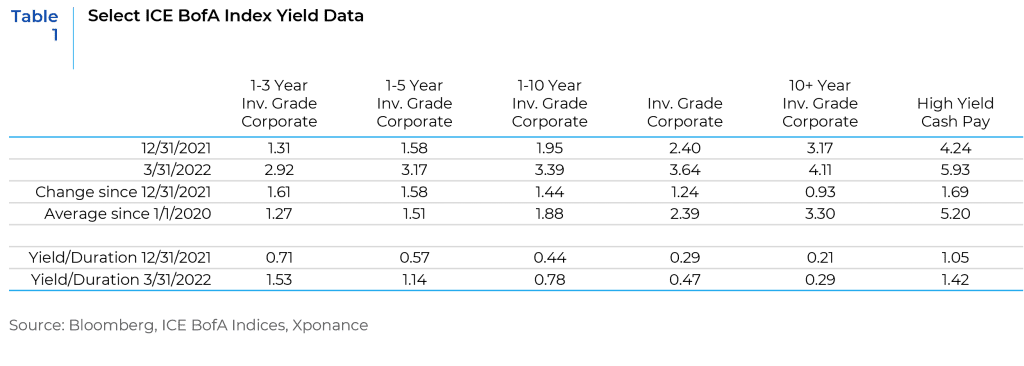
Against that return backdrop, relative value among broad bond market sectors has also changed significantly. Credit spreads among the major sectors widened precipitously over the quarter, with mid-March marking the highest level for many of the subsectors since the initial pandemic induced sell-off for spread products in 2Q20. From a trading perspective, many tactical opportunities came and went, but overall carry (especially in short corporates) is greatly improved from year-end 2021. We often reference yield per unit of duration as a risk metric, understanding that shorter duration bonds always look more attractive by this measure, but this makes shorter corporates look especially compelling against the current market backdrop.
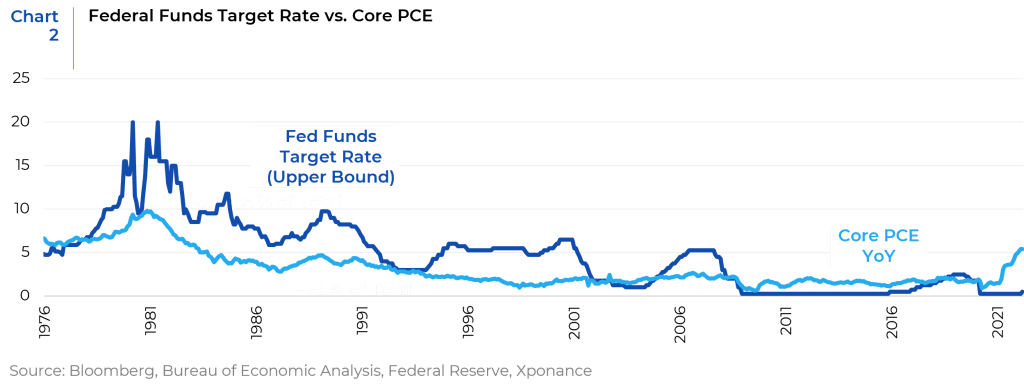
Much has been made of the Fed’s new more hawkish posture and the subsequent change in the shape of the yield curve, and we are concerned that there is little room for maneuver when it comes to negotiating a “soft landing” for the economy. Futures-based measures of forward rates currently expect the Fed Funds rate to exceed 2.50% by 2023, and the May FOMC meeting is currently expected to produce a 50bps increase in the target rate followed by another 50bps in June. As we have noted in previous commentaries, futures-based readings of forward moves in the Fed Funds rate are generally inaccurate as a forecasting tool for all but the upcoming meeting, but rates markets are clearly listening to Fed speakers and the FOMC minutes, while keeping the inflation rate top of mind. In fact, we point to the history of the Fed Funds target rate versus measures of core inflation (in this case the Fed’s preferred measure, core Personal Consumption Expenditures, PCE) going back to 1975 (i.e. prior to Paul Volcker’s two terms as Chairman of the Federal Reserve). The takeaway is that the Fed Funds target rate was virtually always meaningfully higher than the inflation rate, except for the post-Great Financial Crisis (GFC) period when Central Banks felt they needed to fight deflation. Though core PCE (currently 5.4% on a year-over-year basis) is running below core CPI (6.5%, also YoY), either rate is obviously well above the current Fed Funds target range of 0.25% to 0.5%.
Given the complexity of the current inflationary episode, markets seem to be pricing in a potentially recessionary scenario, though yield curve indicators have normalized since the end of the quarter. We attribute this market sentiment to the fact that inflation is much more than a monetary phenomenon in the current environment. Obviously, monetary policy has contributed to the inflationary spike but the other causes are more prevalent (fiscal stimulus in addition to the continuous parade of supply chain and input cost issues). In fact, while market participants and the financial press were busy discussing the inversion of the yield curve (specifically the 2-year versus the 10-year Treasury note) we would note that another popular indicator of recession (the 3-month T-bill versus the 10-year note) remained very steep during this brief period of 2s/10s inversion. Further, Fed Chair Powell has pointed out that the 3-month bill 18 months forward also implies significant steepness, a rationale which he has used to allay recession fears.
After this post-mortem on a terrible quarter for fixed income, where do we stand now? As we noted, the path for short rates (and the resulting shifts upward further out the yield curve) is most obvious in the near-term, but the move we have already seen has provided more attractive investment opportunities for shorter corporate bonds, both in high grade and high yield. And, while floating rate corporate bond issuance has subsided, many have been issued since the end of the pandemic which has provided investable opportunities in this space. And, while SOFR-based bonds do not have the advantage of anticipating rate moves in the way the LIBOR did, they still provide rising income and price stability as the FOMC continues to normalize the rate regime. Obviously, the primary goal of a portfolio manager is to navigate current market conditions while keeping an eye on economic developments. In general, one would envision a more defensive portfolio if recession is becoming more likely, meaning increasing sector allocations to Treasuries, US agencies, agency MBS, highly rated taxable municipals, etc. But these are also the most rate sensitive assets one can own. Over much of the post-GFC period, the market was often looking multiple steps ahead (i.e. good economic news resulted in a risk-off tone for fear that the FOMC would remove accommodative policy). Now, though the expected series of rate increases will likely eventually lead to that same risk off tone (meaning a rate rally and spread widening event), the current playbook is to remain in assets that provide a cushion against Treasury moves. For example, as discussed above, short and intermediate-term corporates now have much greater yield protection against interest rate movements than they have for quite some time. In this way, the portfolio can maintain a yield advantage without being as exposed to either interest rate movements or another spread widening event. So, while the quarter was painful, valuations across fixed income sectors are now much more reasonable than they have been in over three years. Every cloud has a silver lining!
This report is neither an offer to sell nor a solicitation to invest in any product offered by Xponance® and should not be considered as investment advice. This report was prepared for clients and prospective clients of Xponance® and is intended to be used solely by such clients and prospects for educational and illustrative purposes. The information contained herein is proprietary to Xponance® and may not be duplicated or used for any purpose other than the educational purpose for which it has been provided. Any unauthorized use, duplication or disclosure of this report is strictly prohibited.
This report is based on information believed to be correct, but is subject to revision. Although the information provided herein has been obtained from sources which Xponance® believes to be reliable, Xponance® does not guarantee its accuracy, and such information may be incomplete or condensed. Additional information is available from Xponance® upon request. All performance and other projections are historical and do not guarantee future performance. No assurance can be given that any particular investment objective or strategy will be achieved at a given time and actual investment results may vary over any given time.