
Therefore, we thought it would be a worthwhile starting point to evaluate returns and characteristics for the major fixed income indices as compared to both recent history and the trailing five-year period. The significant amount of interest rate volatility seems old hat at this point, but we also provide a historical perspective to put 1Q23 in context. Further, the change in expectations for the path of interest rates provides an interesting perspective on a bifurcated outcome for further moves by the Federal Open Market Committee (FOMC). When we look at risk premia from a granular perspective and in a relative and comparative context, there are a range of near-term threats that could potentially morph into investment opportunities. Dispersion among sectors within the corporate index, for example, is increasing even with the recovery of many corporate sector spreads between early March and quarter-end. Further, spread differentials for the more esoteric securitized corners of the broad investment grade market also provide a granular perspective surrounding potentially deteriorating fundamentals in these asset classes. Lastly, we attempt to make sense of these developments in the context of the outlook and opportunities for fixed income over the next few quarters.
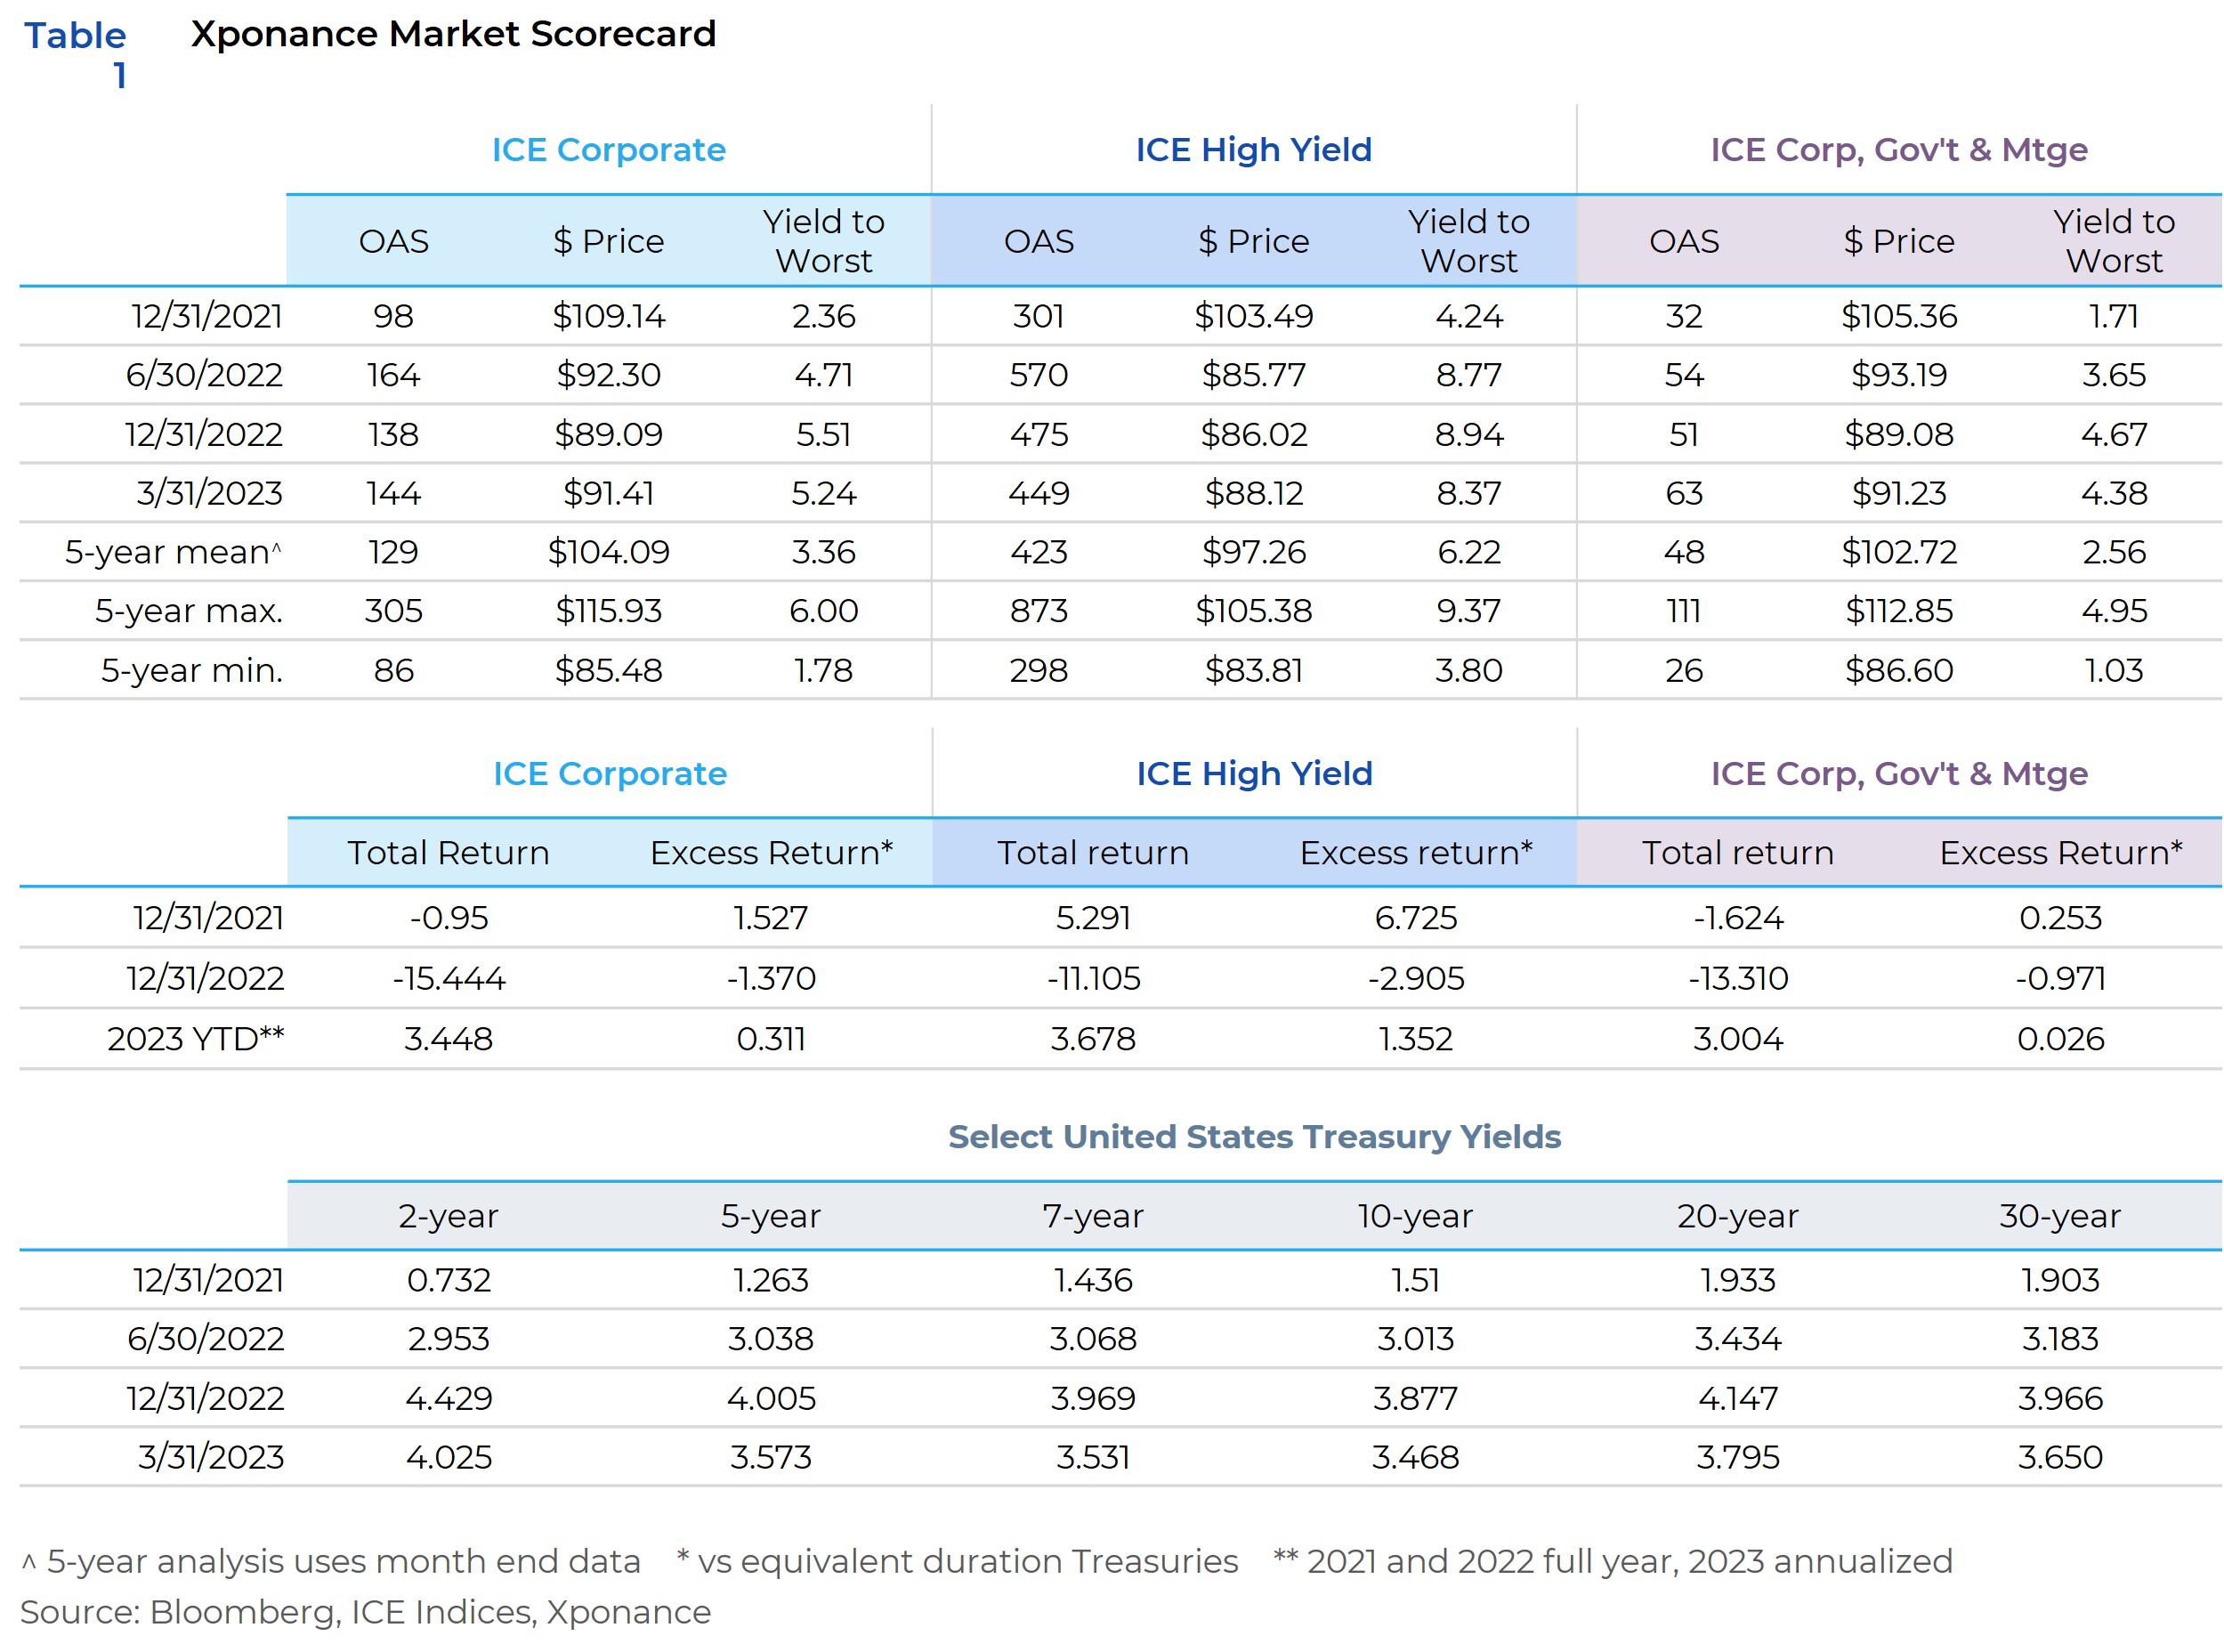
The Xponance Market Scorecard depicts where we are and where we have been in terms of spreads, yields, and returns (see Table 1). As compared to year-end 2022, investment grade spreads widened marginally, while high yield spreads tightened modestly. Given the moderation in interest rates, this dynamic has led yields to fall across most subsectors of the broad bond market. Dollar prices for the major indices (and subcomponents of them) remain deeply discounted but have recovered from the lows reached at the peak in rates last year. Absolute levels of spreads, while slightly cheap to the 5-year average, still look expensive as compared to recessionary periods or the near-term wides reached last summer. Spread and yield break-evens, however, do look relatively attractive as compared to recent history in the sense that a larger cushion against upward moves in either yield or spread is available.
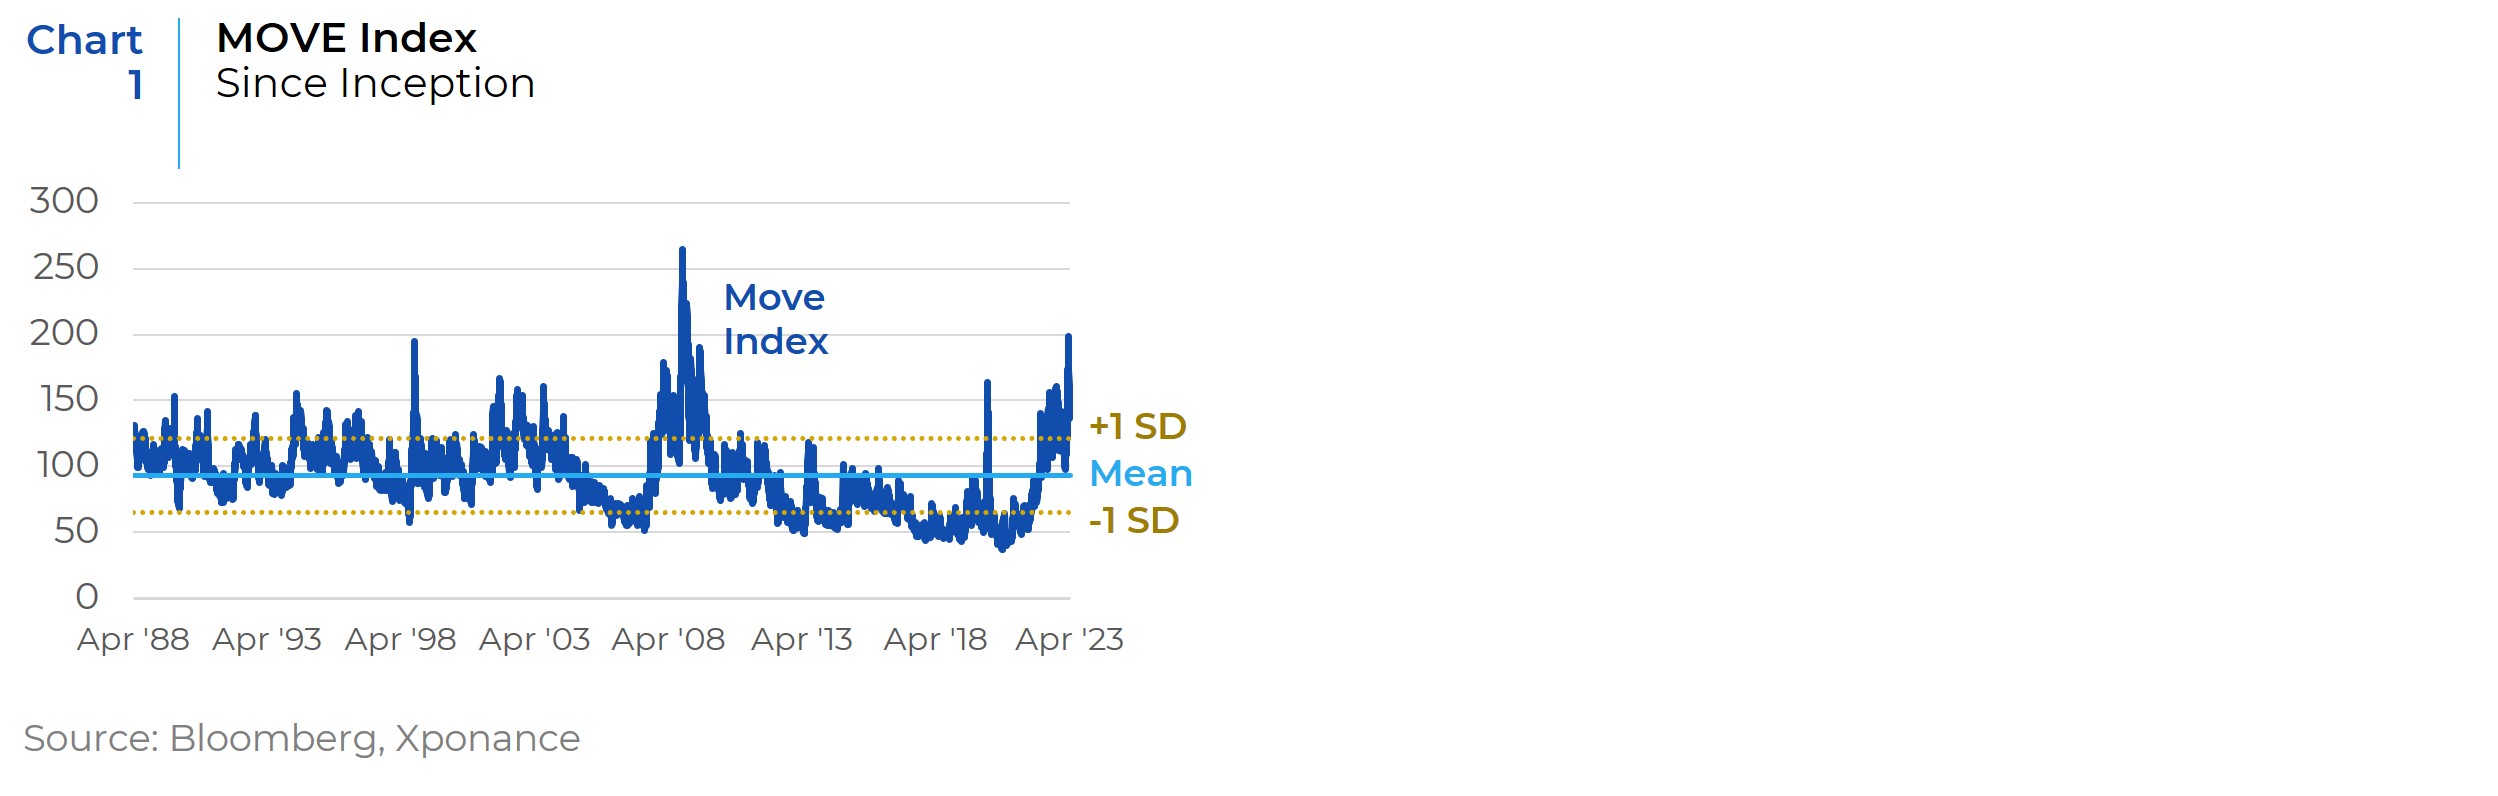
Despite what seems like an orderly move lower in rates coupled with inflation moving down from the high-water mark of mid-2022, interest rate volatility remains extremely elevated by historical standards. The MOVE index remains near levels that were only previously reached during the Global Financial Crisis (GFC) (see Chart 1). The MOVE index measures fear in the bond markets and uncertainty in rates. Typically, it is reasonably correlated to the equity market VIX except during inflection points in the business cycle or atypical scenarios such as the GFC or pandemic. These risk-off scenarios presage risk widening across our sectors. This Move index volatility is particularly acute given its composition of short-dated options across the maturity spectrum in concert with an inverted yield curve which all leads to an impending bifurcated outcome as we approach the Fed terminal rate.
Moreover, and as noted above, there has been a marked change in the market’s outlook for interest rates going forward. Market sentiment about a potential near-term reversal of the FOMC tightening campaign has been a volatile indicator by itself but is currently pricing in potential rate cuts by 3Q23 (and the potential for 50bps of cuts by year-end). Our view is that this is a bifurcated outcome (i.e. either no cuts will occur or a significant amount of easing will), as we believe the Federal Reserve will not begin to cut rates absent a significant decline in economic activity or an unforeseen capital markets crisis. Though base effects should allow inflation to moderate through June (for the July data print), many economists predict a potential pause in disinflation after those two monthly data points.
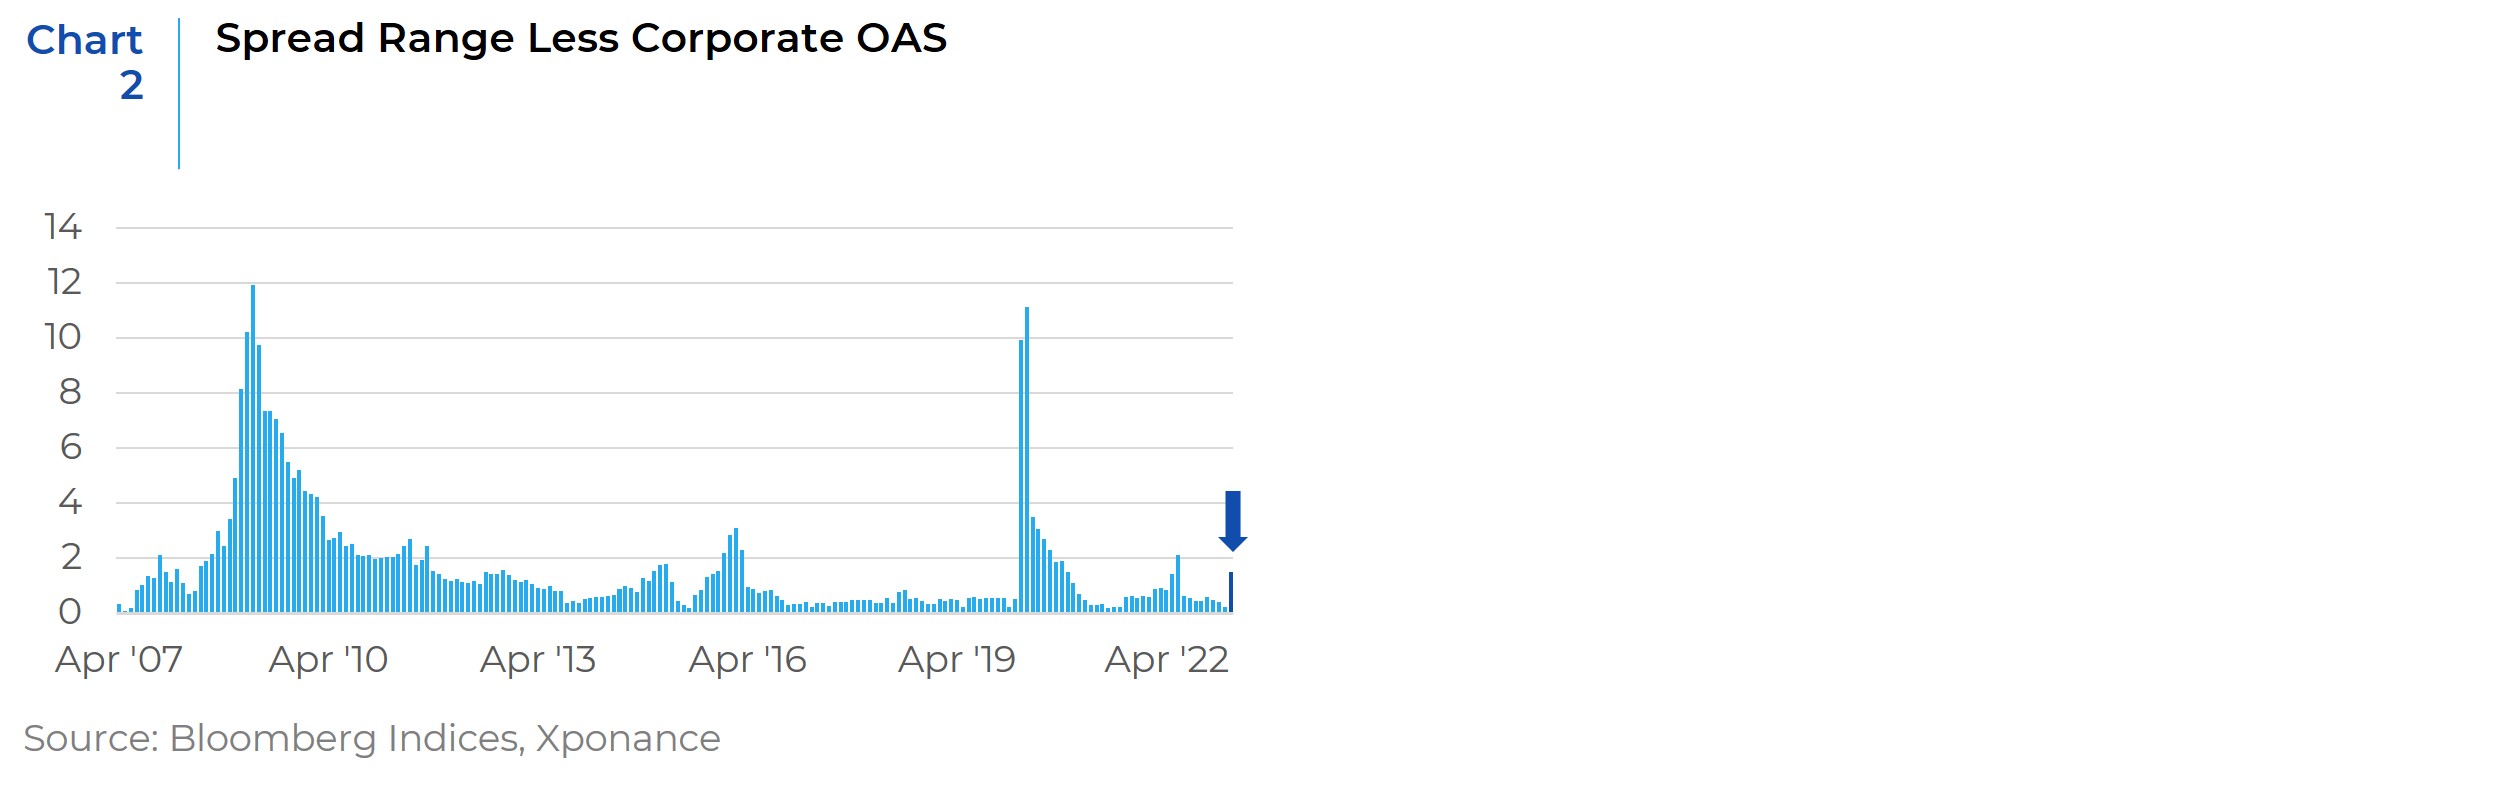
We track a dataset for corporate bond sectors whereby we look at the dispersion of spreads across level 4 subsectors of the corporate market. During much of the business cycle, the range of spreads from the widest subsector to the tightest subsector is typically in line with the overall spread on the corporate index. This is obvious when one thinks of investor behavior (chasing yield during low volatility periods) and the construction of the indices (market value weighted by cusip). Periods of economic and/or market dislocation tend to result in a wider spread range, even when the overall spread levels are still relatively low and well behaved. At the end of March, for example, the OAS on the corporate index is in the middle of the range it has been in since the beginning of 2022, yet index OAS dispersion is at the highest level we have seen since the recent spread wides of mid-2022 (see Chart 2). If we take this analysis back to the GFC, dispersion increased dramatically during March 2023 but remains relatively low by standard statistical measures. It remains to be seen if this most recent dislocation in spread markets is the beginning of a trend or is simply a short-term anomaly related to fear of further bank failures.
When we move beyond simple mathematical measures of dispersion into the stratification of the underlying subsector data we note that those sectors at the high-end of the spread range are those that are most affected by the increase in rates and the potentially changed nature of the economy post-pandemic. The widest spread sectors are in the broad financial subsectors, including insurance and REITS, which is to be expected. Given the index skew towards the largest banks, which have not widened in the most recent panic, the banking sector itself is roughly in line with the broader corporate index. This seems counterintuitive given the focus of the most recent panic. A handful of regional banks do remain very cheap, but this dynamic does not show up in our analysis. On the tight spread end of the spectrum, many typically defensive sectors remain tighter on a spread basis than the corporate index. These include various consumer non-cyclical subsectors like consumer products, food and beverage, etc. Interestingly, however, there are a range of economically sensitive sectors that also look expensive as compared to the broader index (i.e. automotive, manufacturing, and retailers) which is atypical during periods of FOMC rate increases and Treasury yield curve inversion.
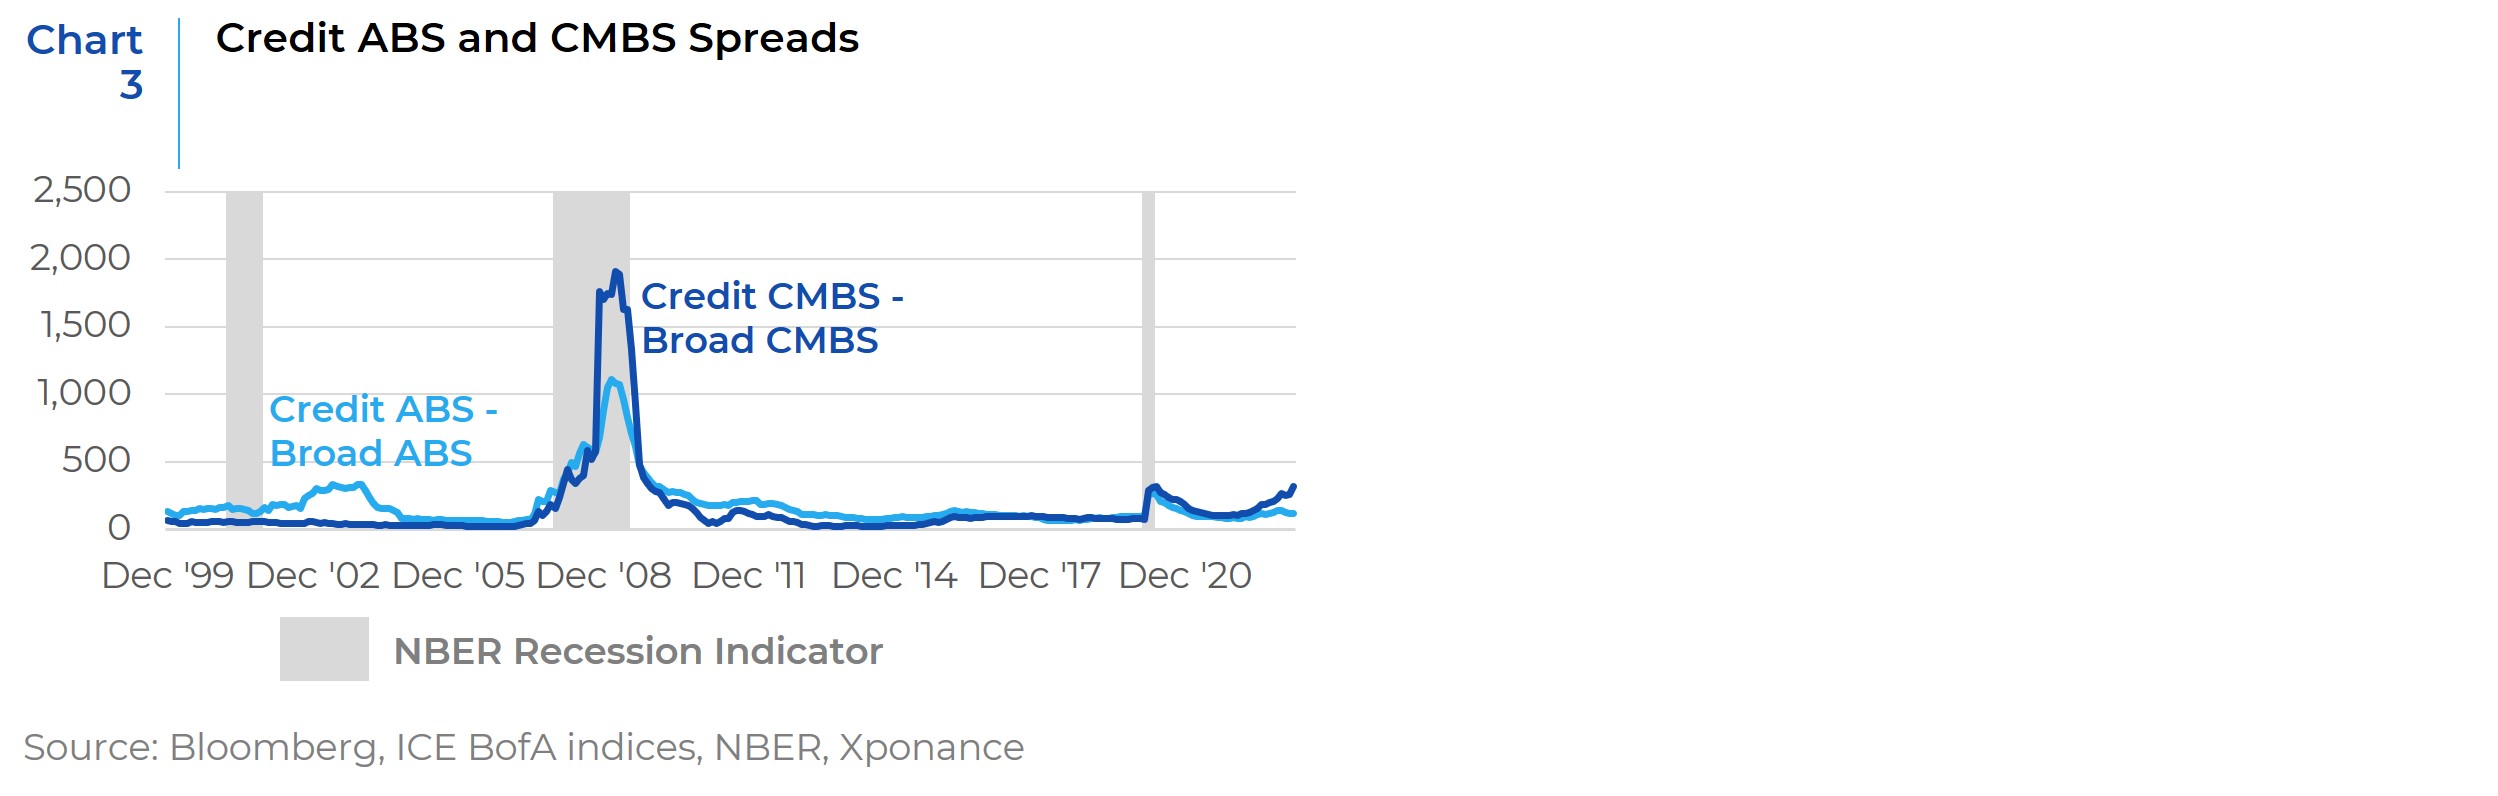
While much of the top-line index data suggest no imminent problems for fixed income risk markets, we analyze the signals generated from risk premia in other spread markets (specifically private label securitized product) beyond the more conventional signals from interest rate and corporate markets. One indicator we track, for example, is spreads for “credit” CMBS (in this analysis, those CMBS rated below AAA) as compared to the overall CMBS index. We also track a similar metric for ABS (see Chart 3). CMBS “credit” tranches are widening as compared to the broader sector benchmark (and have been since 2Q22). The same indicator for ABS widened throughout the second half of 2022 but has recovered since year-end. We are watching these metrics closely as a proxy for a potential risk-off tone in the less liquid spread markets should economic fundamentals deteriorate further. These sectors often represent the “canary in the coal mine” as together they account for around 2% of broad market indices but are part of a nearly $2 trillion investable market.
Admittedly, we at Xponance fixed income have been in the camp that says yield curve inversion is a reliable indicator of recession. But, as we have noted in previous commentaries, that does not necessarily mean we expect a deep or protracted economic downturn. While we are wary of tail risks given the extended period of ultra easy monetary policy coupled with the fiscal largess of the government covid response and pandemic-related changes to the economy, we cannot dispute the resilience of the U.S. economy (the labor market in particular). We began our quarterly review by viewing broad market metrics, and the conclusion remains that fixed income is a significantly more attractive investment opportunity than it was a year ago. From an asset allocation perspective, this factor should remain a tailwind for fixed income at the margin. Volatility has been the rule of the day for the broad fixed income markets, led by interest rate gyrations, but this market condition should wind down in conjunction with the end of the FOMC tightening cycle. More importantly, this should serve to reduce volatility in front-end rates markets but also remove the wild dislocations in short duration spread product. Despite the market’s constant reassessment of timing of the end of the Federal Reserve’s tightening cycle (or the beginning of a new easing cycle), we are still looking at a new phase of monetary policy regardless of timing. While we think the time to add lower-quality, higher-beta or less liquid sectors is not yet upon us, we also see potential near or intermediate term opportunities in the corporate and securitized sectors we discussed above. Individual corporate issuers and subsectors should allow for security selection to win out over broad market over-weights, and alpha opportunities should remain prevalent for nimble investors. We are more circumspect about the opportunities in the private label securitized areas of the market, as trading and valuation in these sectors often remains challenged until well after the more liquid spread sectors (i.e. corporates) have long since recovered.
This report is neither an offer to sell nor a solicitation to invest in any product offered by Xponance® and should not be considered as investment advice. This report was prepared for clients and prospective clients of Xponance® and is intended to be used solely by such clients and prospects for educational and illustrative purposes. The information contained herein is proprietary to Xponance® and may not be duplicated or used for any purpose other than the educational purpose for which it has been provided. Any unauthorized use, duplication or disclosure of this report is strictly prohibited.
This report is based on information believed to be correct, but is subject to revision. Although the information provided herein has been obtained from sources which Xponance® believes to be reliable, Xponance® does not guarantee its accuracy, and such information may be incomplete or condensed. Additional information is available from Xponance® upon request. All performance and other projections are historical and do not guarantee future performance. No assurance can be given that any particular investment objective or strategy will be achieved at a given time and actual investment results may vary over any given time.