
To many, there is good reason to discount the prior pessimism as it appears that the U.S. Federal Reserve and perhaps the European Central Bank (ECB) are both on the verge of declaring victory in bringing inflation down (albeit above the 2 percent target for both), without crushing the economy. But while it does seem probable that we have seen peak policy rates in the U.S. (for now), inflation, especially from wages and housing, remains quite sticky. Should inflation continue to persist above the Fed’s target of 2% (or even much higher), the impact of higher debt costs will increasingly be felt by borrowers globally. In this ‘higher-for-longer’ scenario, where policy rates remain above at least 3.5% for multiple years, we look at where the most risk and/or pain will be felt by the ongoing costs of leverage, and the implications for allocators.
While we would not be surprised to see some moderation in U.S. policy rates in 2024, and we accept that any reduction in rates from present levels should benefit risk assets in the short run, we are less sanguine that the market has yet to fully digest the implications of higher medium to long-term rates. Here we are mindful to look at the risks from two different vectors. First, the risk to earnings given debt costs that are 2-3x larger today than they were in 2021. Second, the risk to valuations given the opportunity cost of equity (public and private) allocations vis a vis fixed income and other areas of credit with higher available yields.
Sticky Rents + Sticky Wages = Sticky Inflation
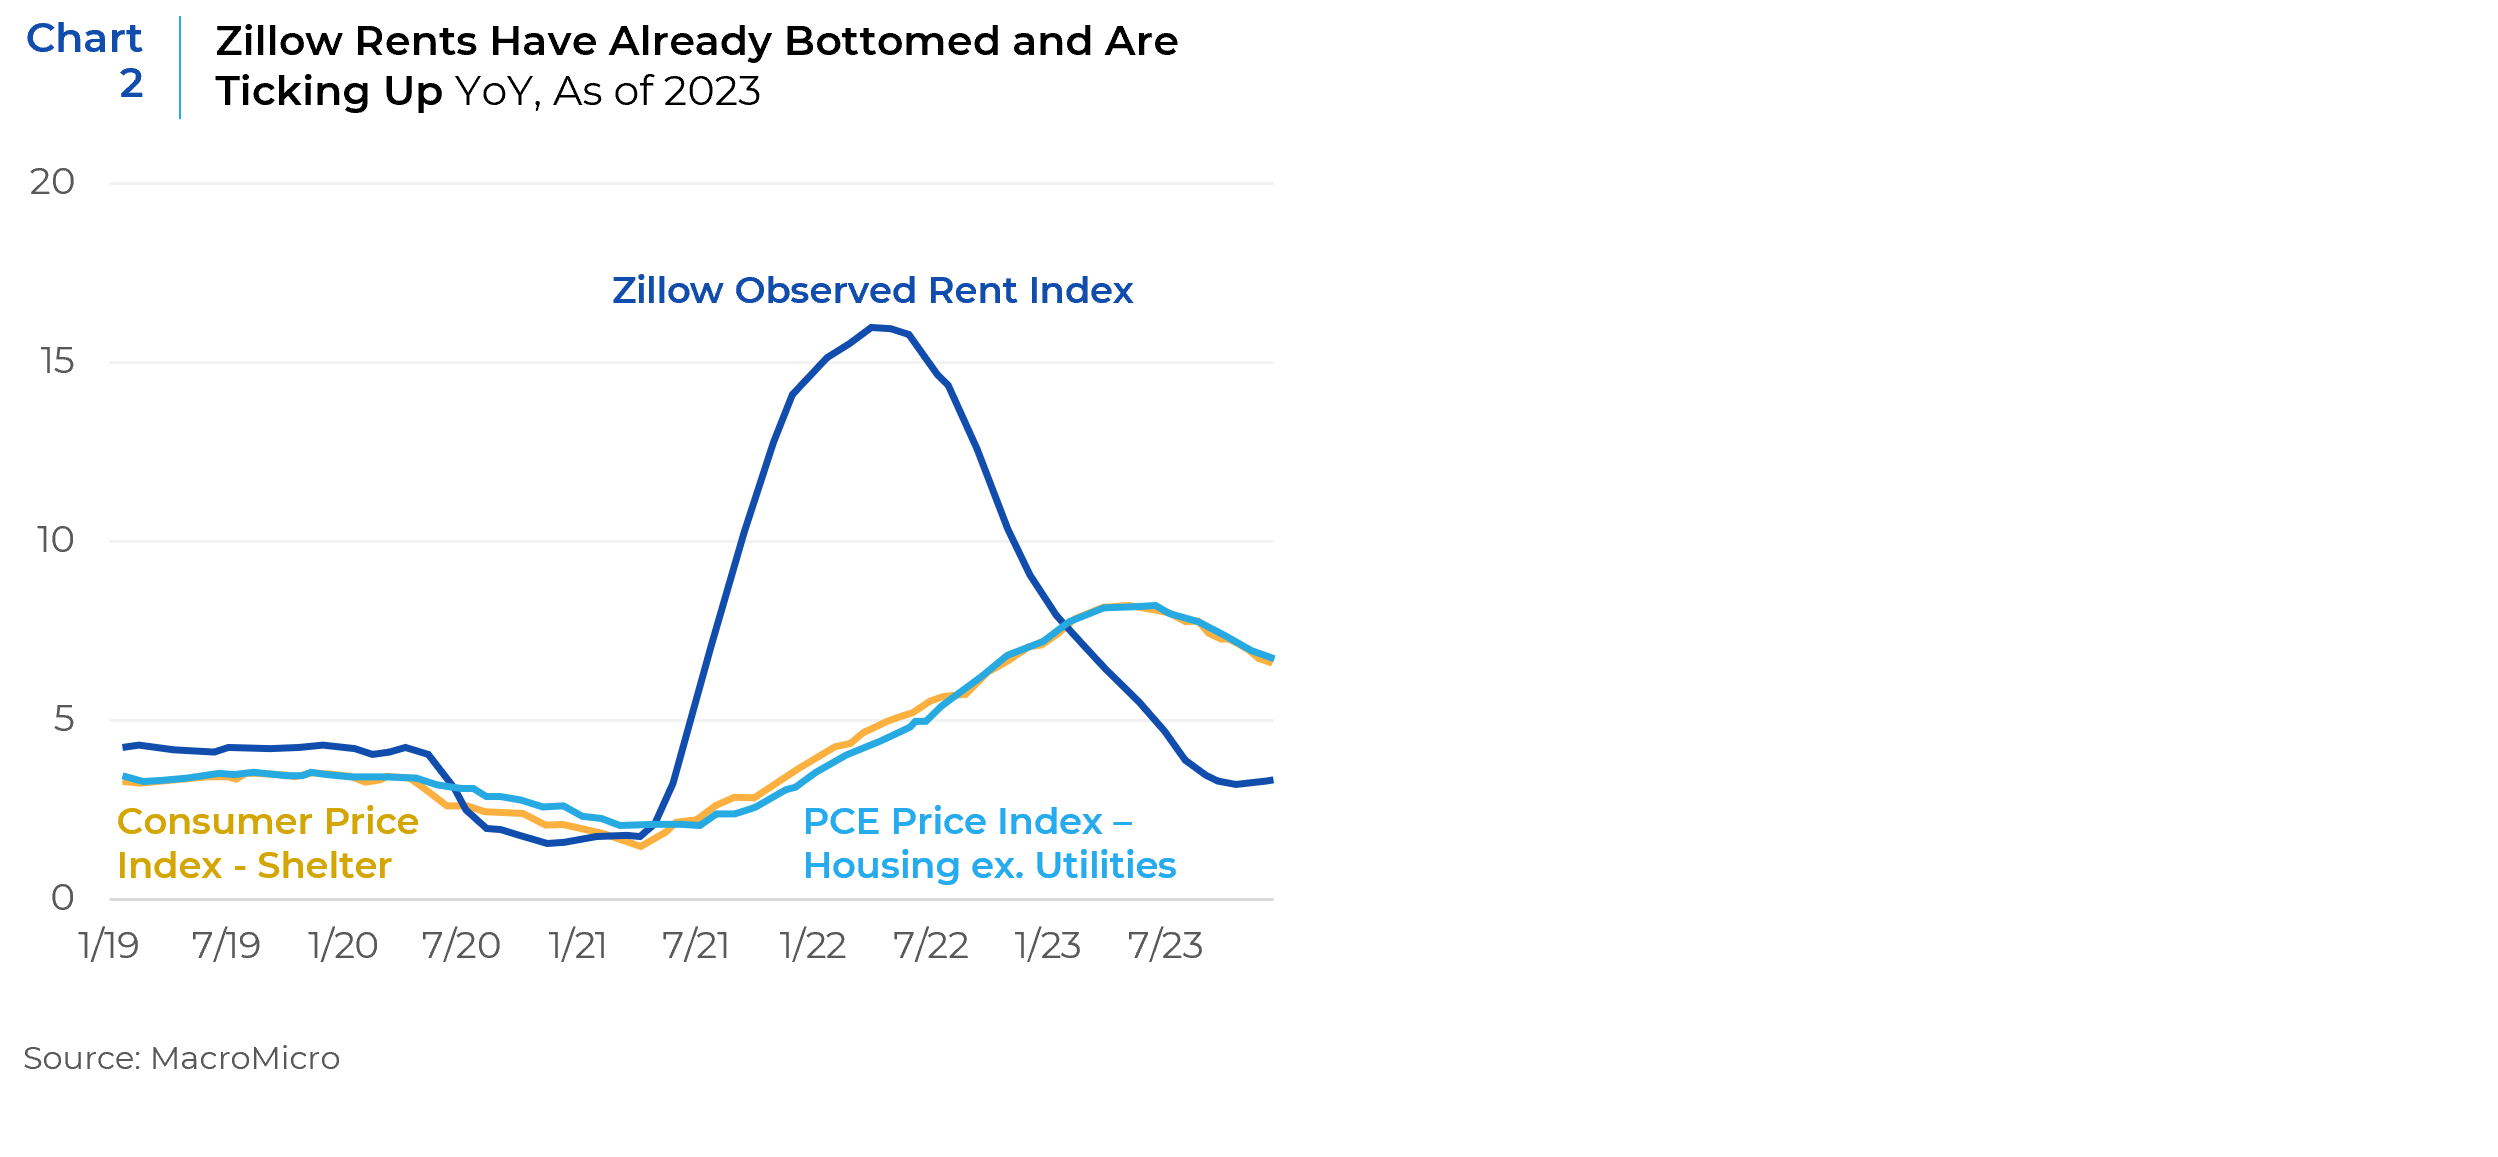
By far, the biggest single component of the PCE price index that is used primarily by the Federal Reserve (“Fed”) to judge inflation, is housing costs (about one third of the index). While the PCE’s housing components are still falling, the Zillow Rent Index, which boasts more real time observations and is widely looked at as a likely leading indicator (at least directionally) for the PCE measure has recently plateaued and even begun to rise again. Since settling into a multi-year low of +3.21% yoy in September 2023, it has since reversed and is up +3.7% from the September lows (Chart 2).
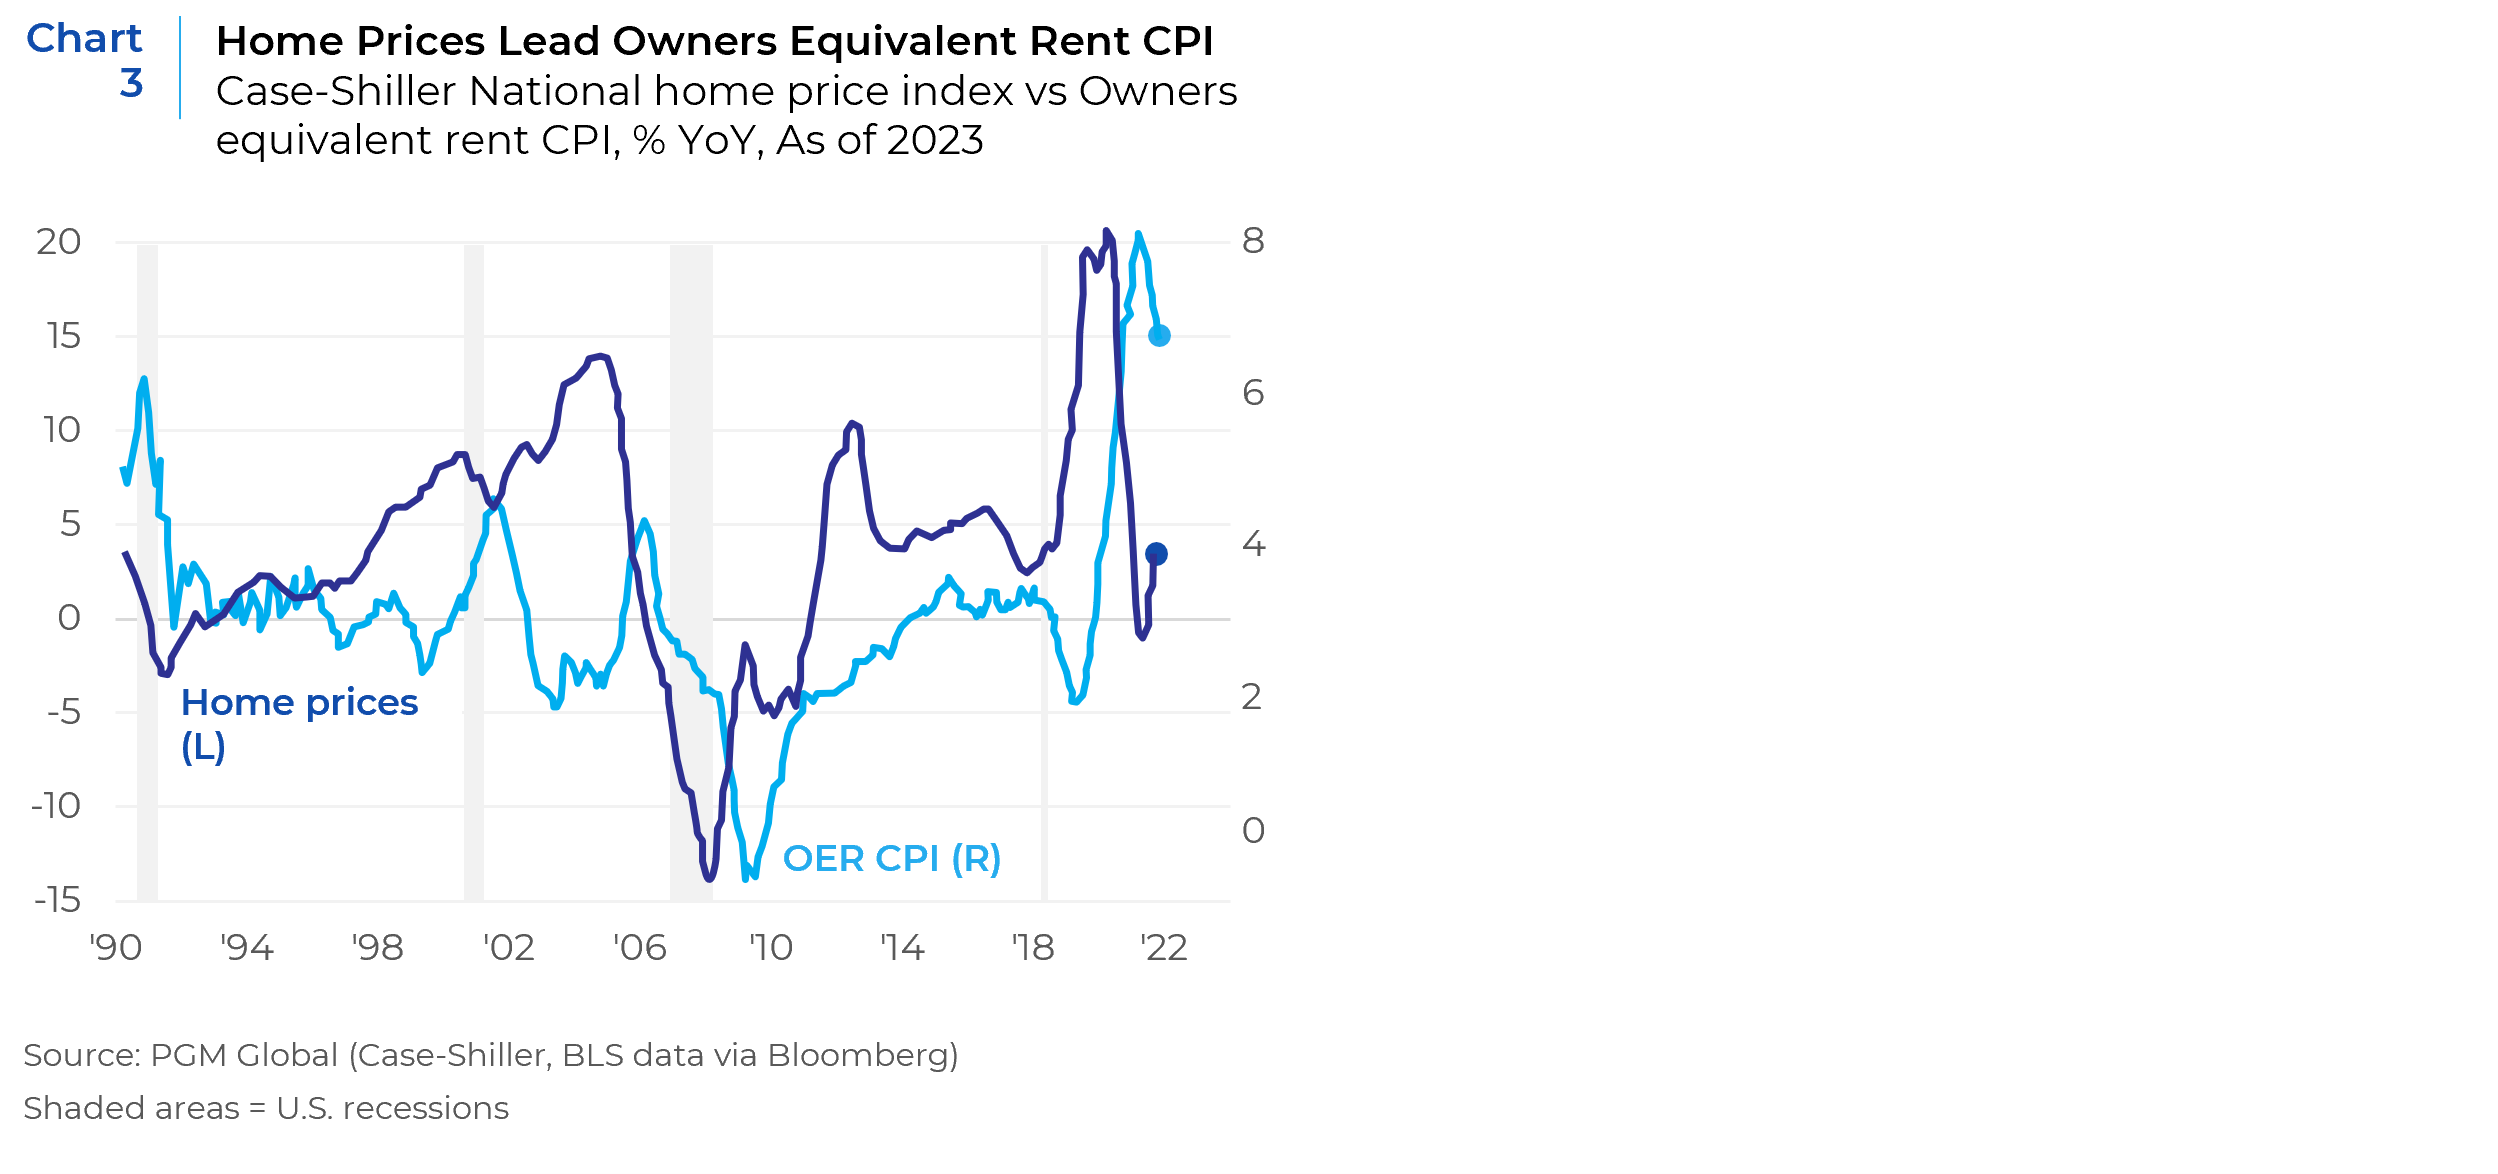
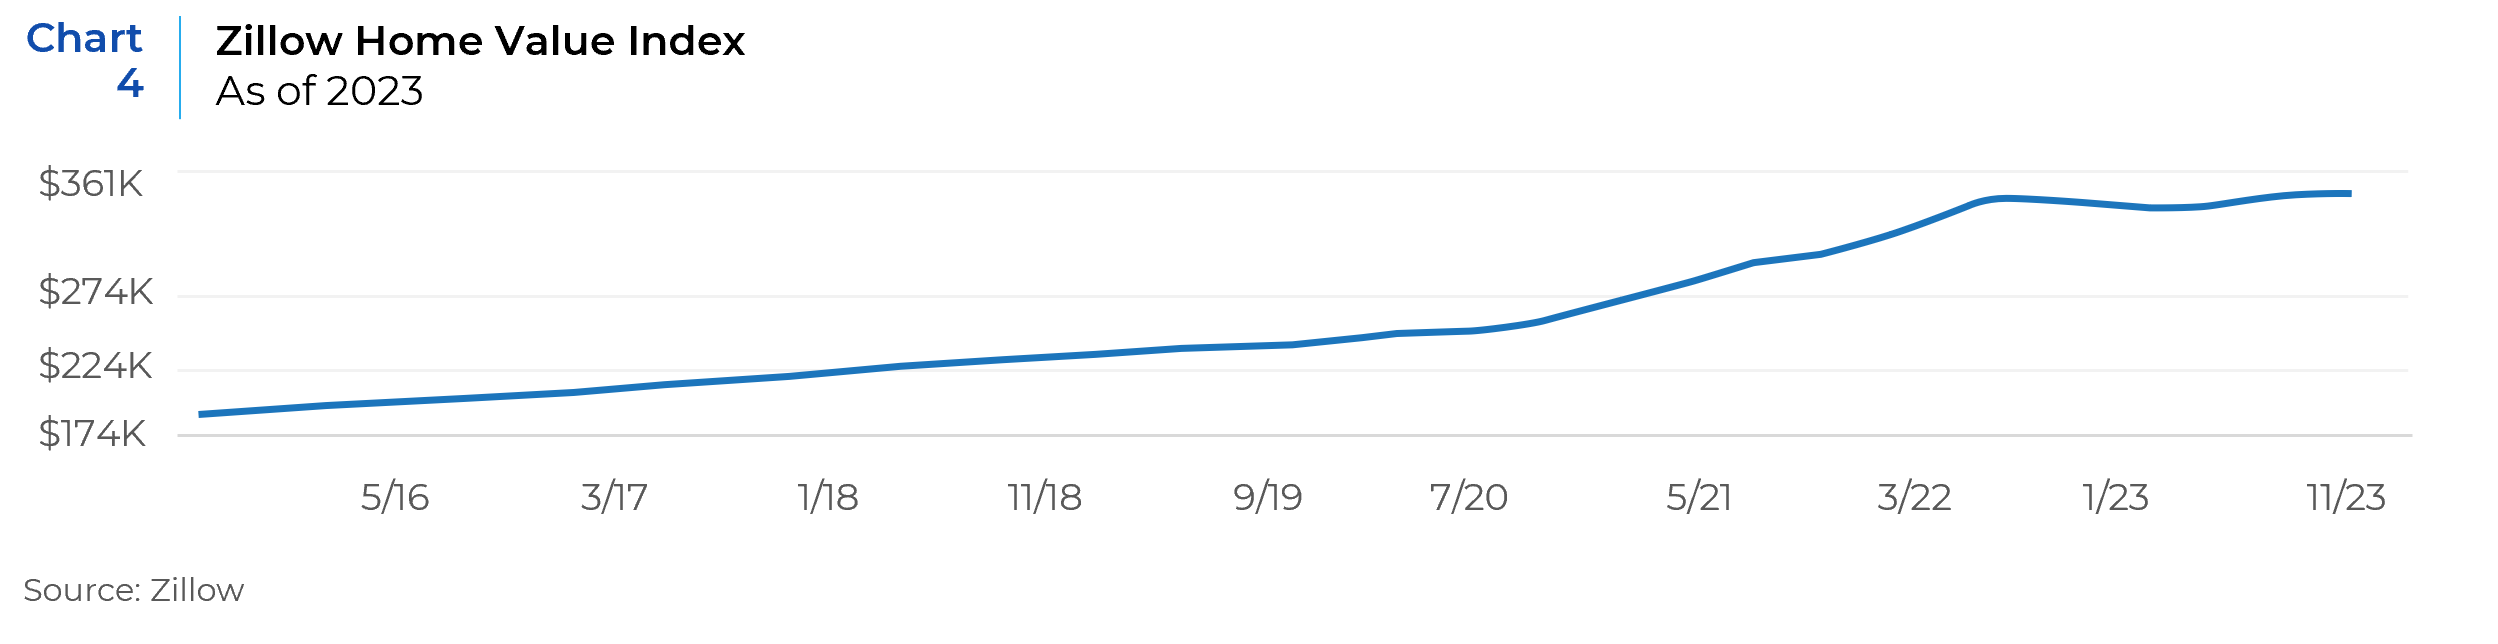
Home prices, which also tend to be a leading indicator of rents, after falling from a peak of over 8% and plummeting down to 0% have recently begun climbing again and are now at +3.9% in the Case-Shiller index (Chart 3) and +2% in the Zillow home price index (Chart 4).
This strength in the housing market has been buoyed by a historic upturn in household formation (Chart 5) that appears based on long duration changes in demographics and consumer preferences (especially an increased desire for Baby Boomers to “age-in-place”) that does not look likely to change in the coming 3-5 years, at least.

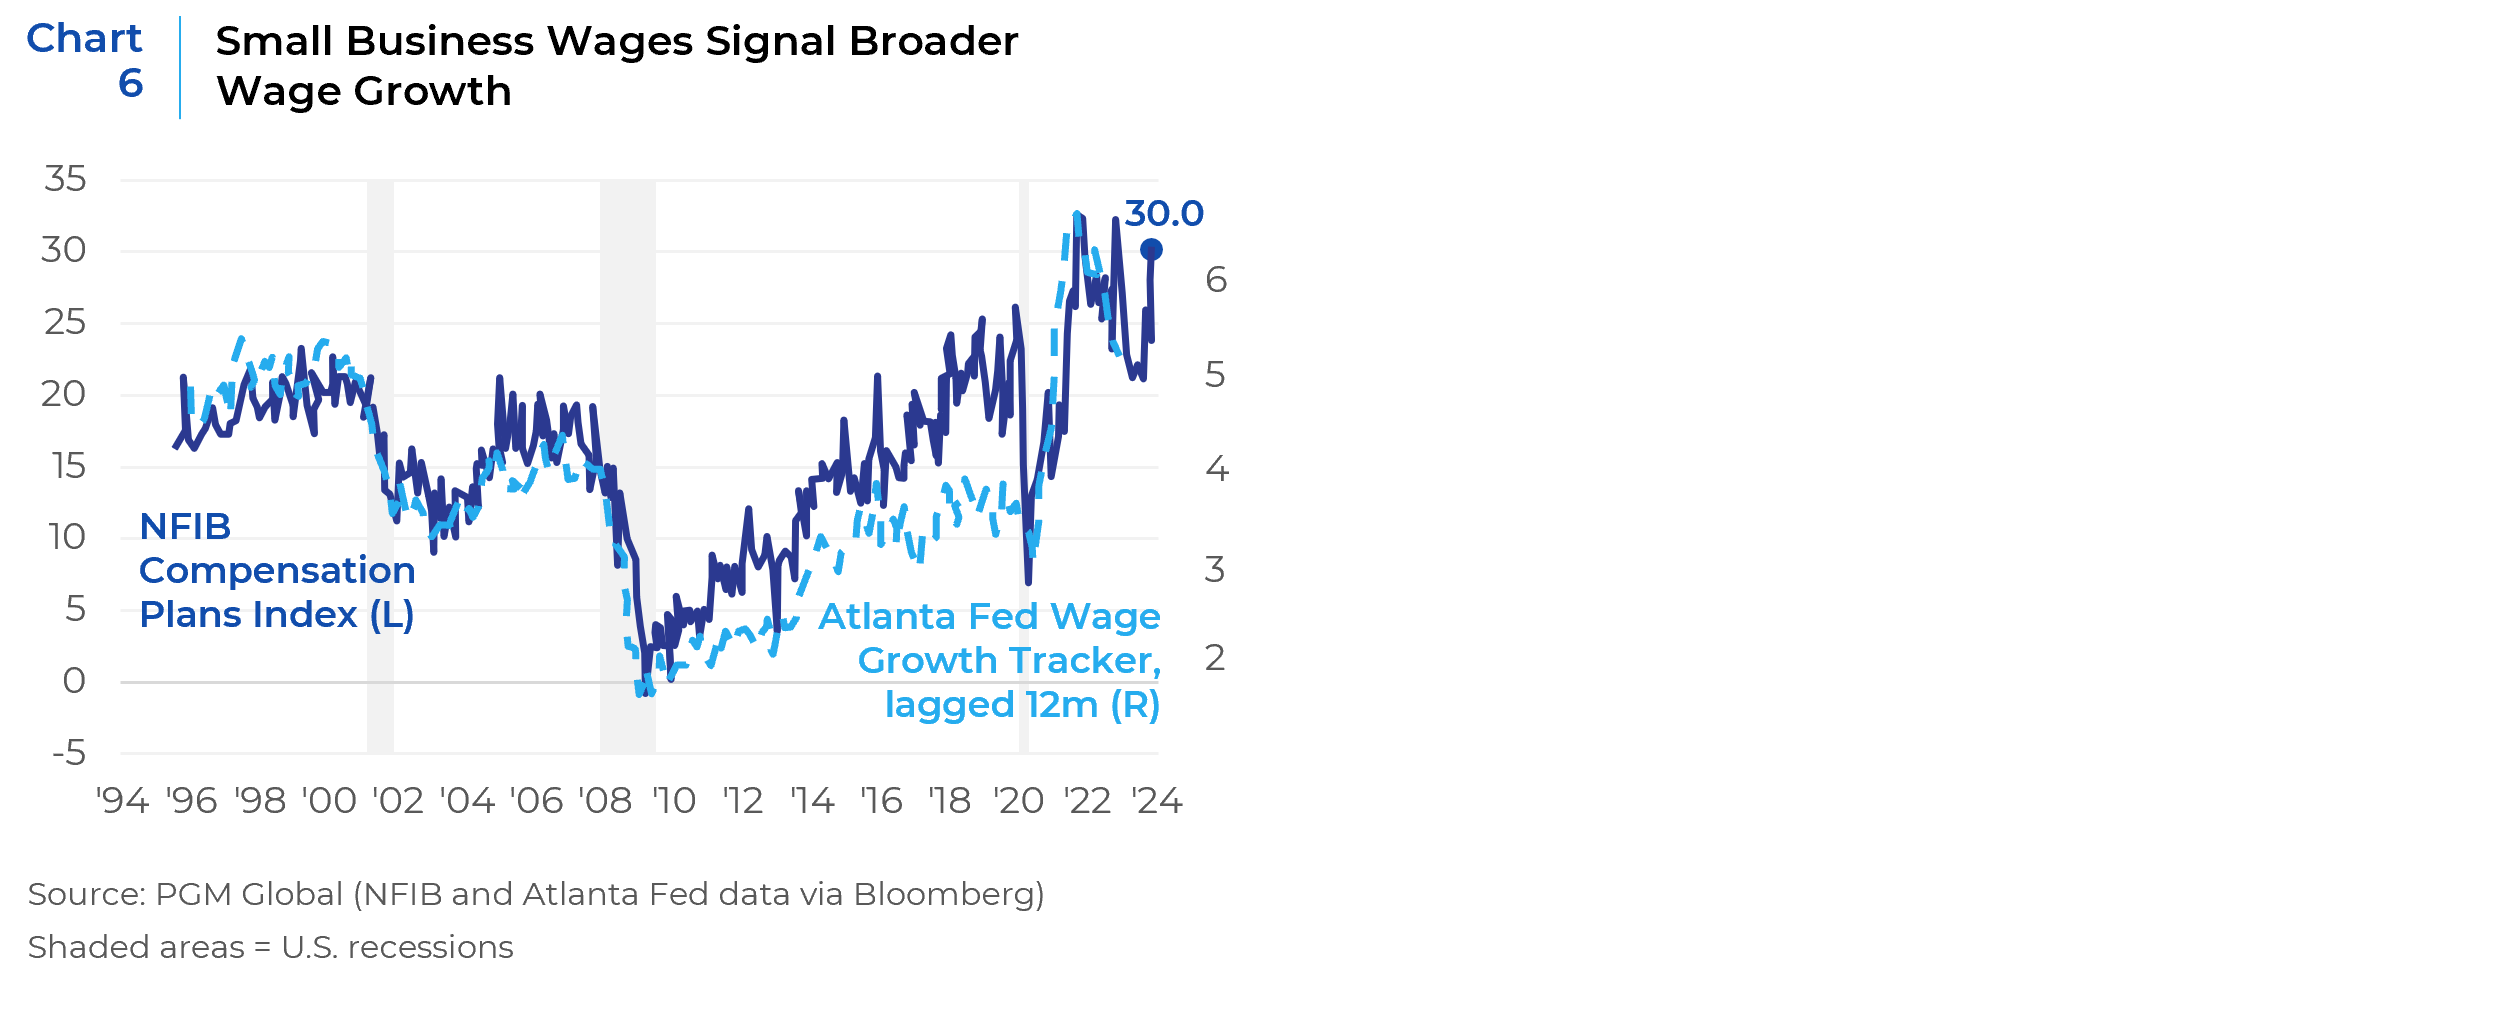
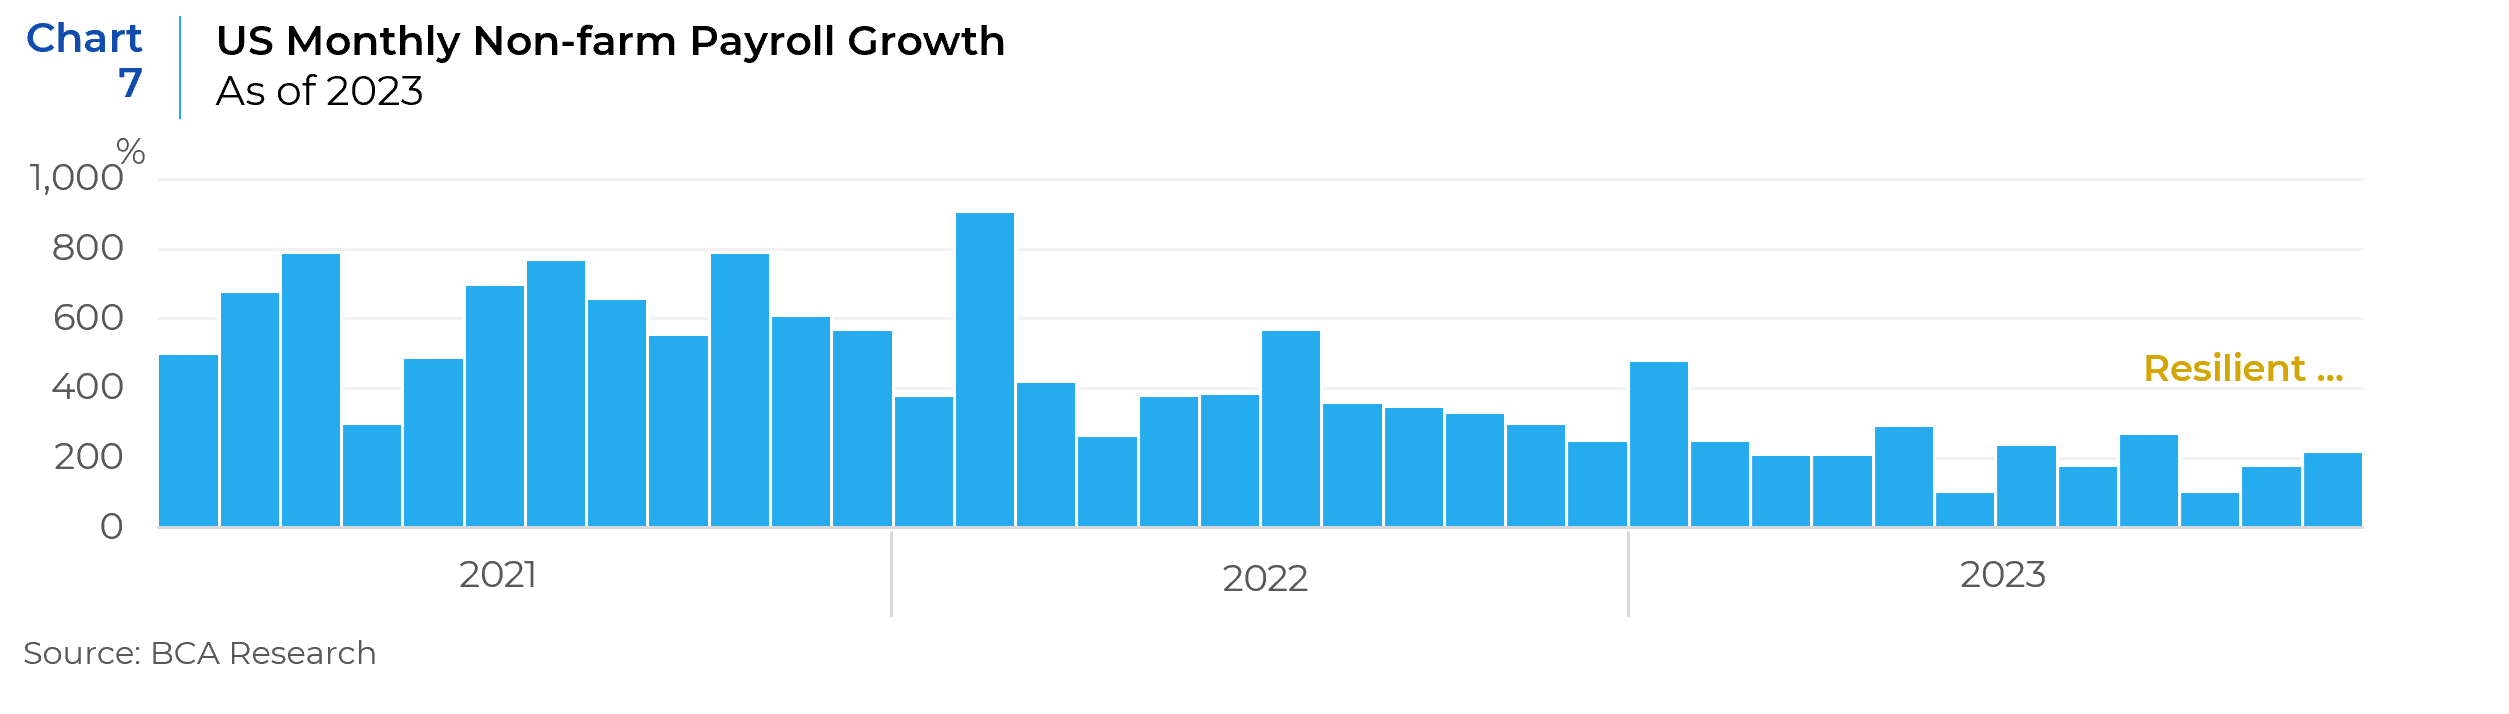
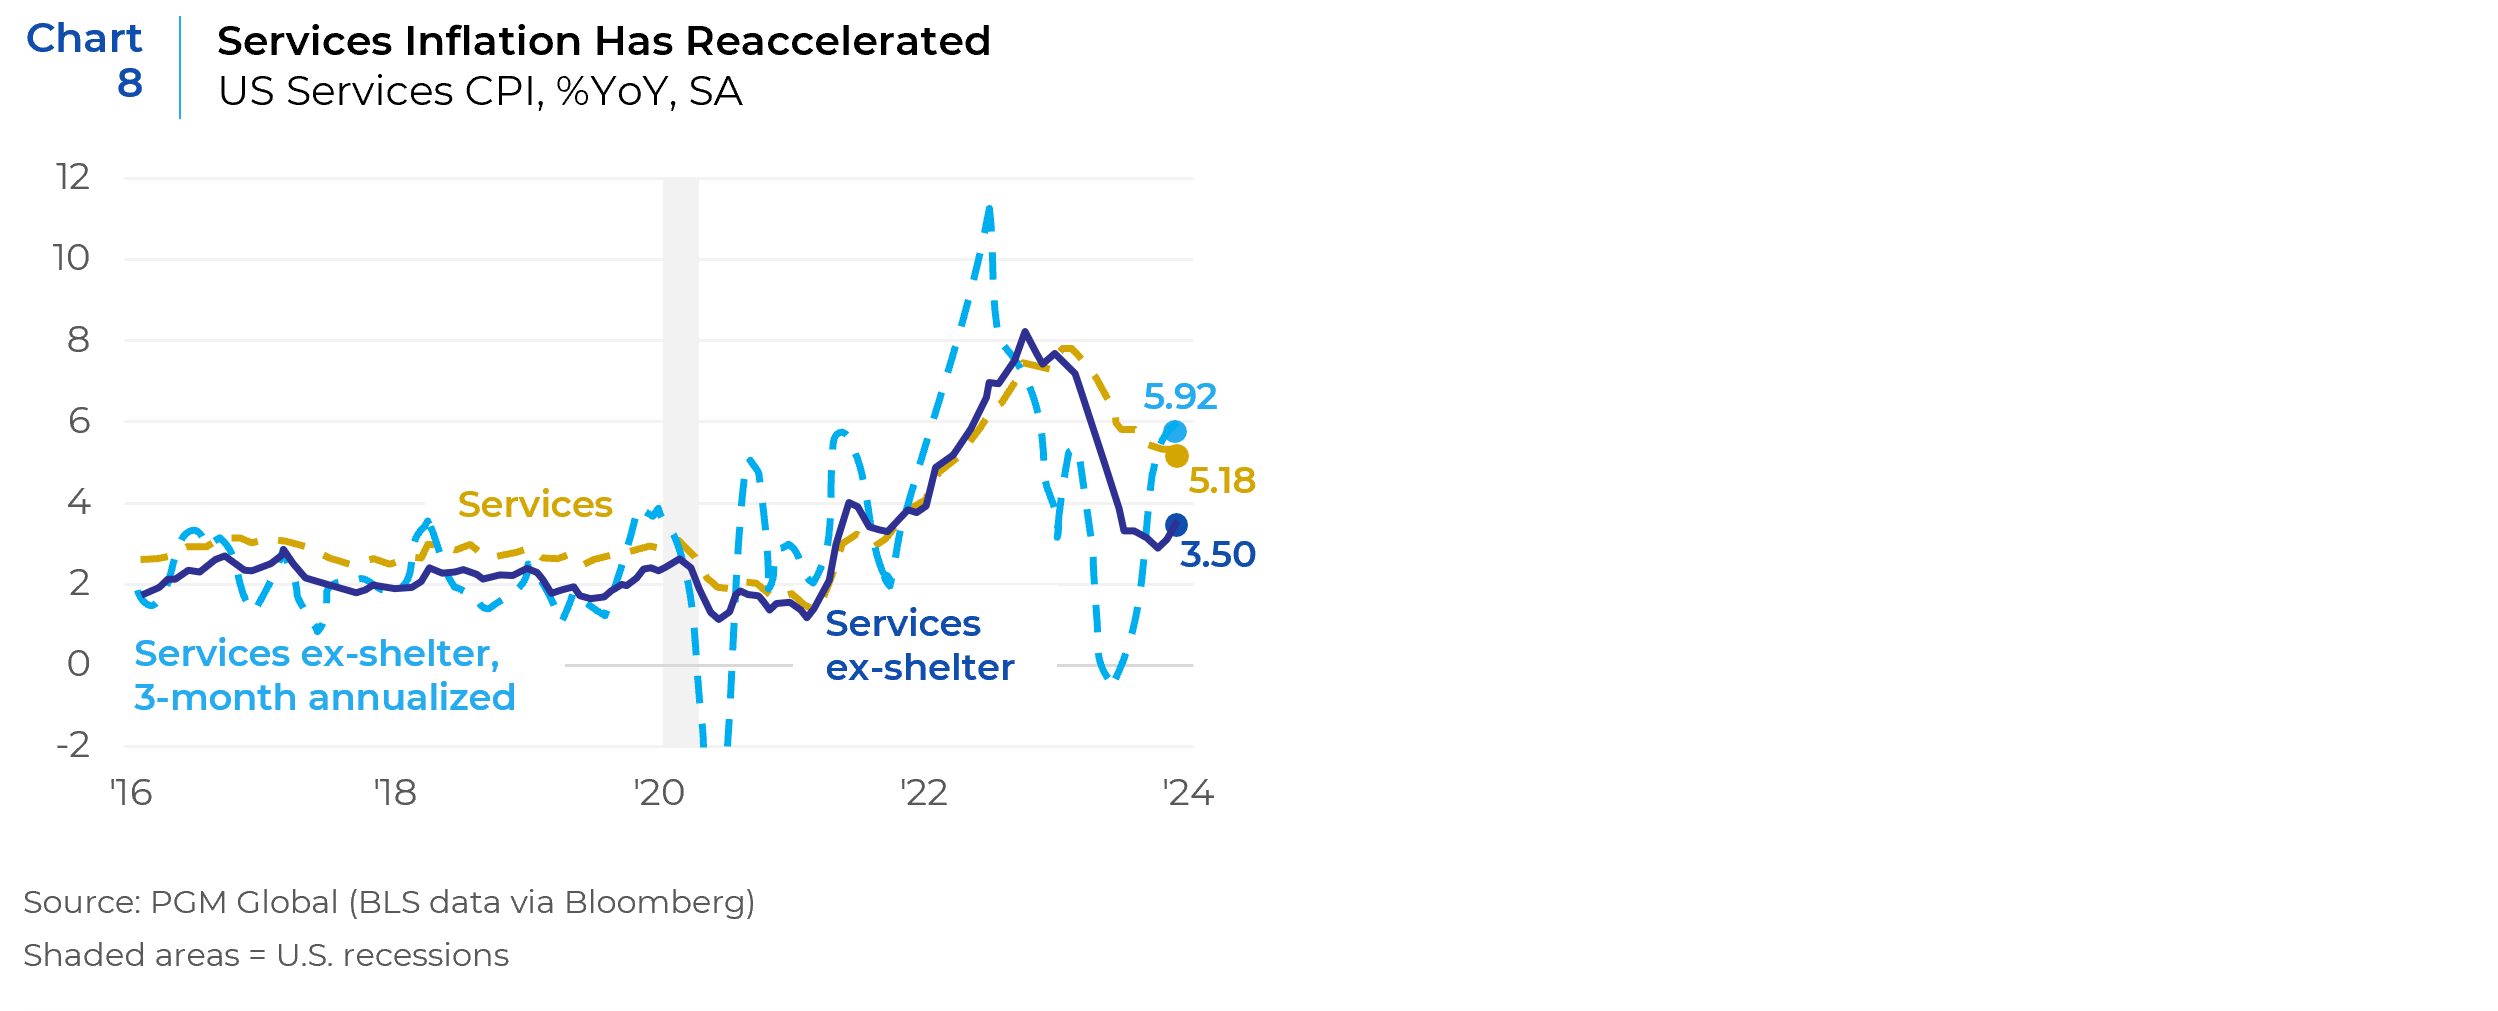
Meanwhile wages have also shown strong signs of strength (Chart 6) amid a recent rebound in job creation (Chart 7). This in turn puts pressure on services (Chart 8), which given recent data is annualizing at nearly +6% annualized.
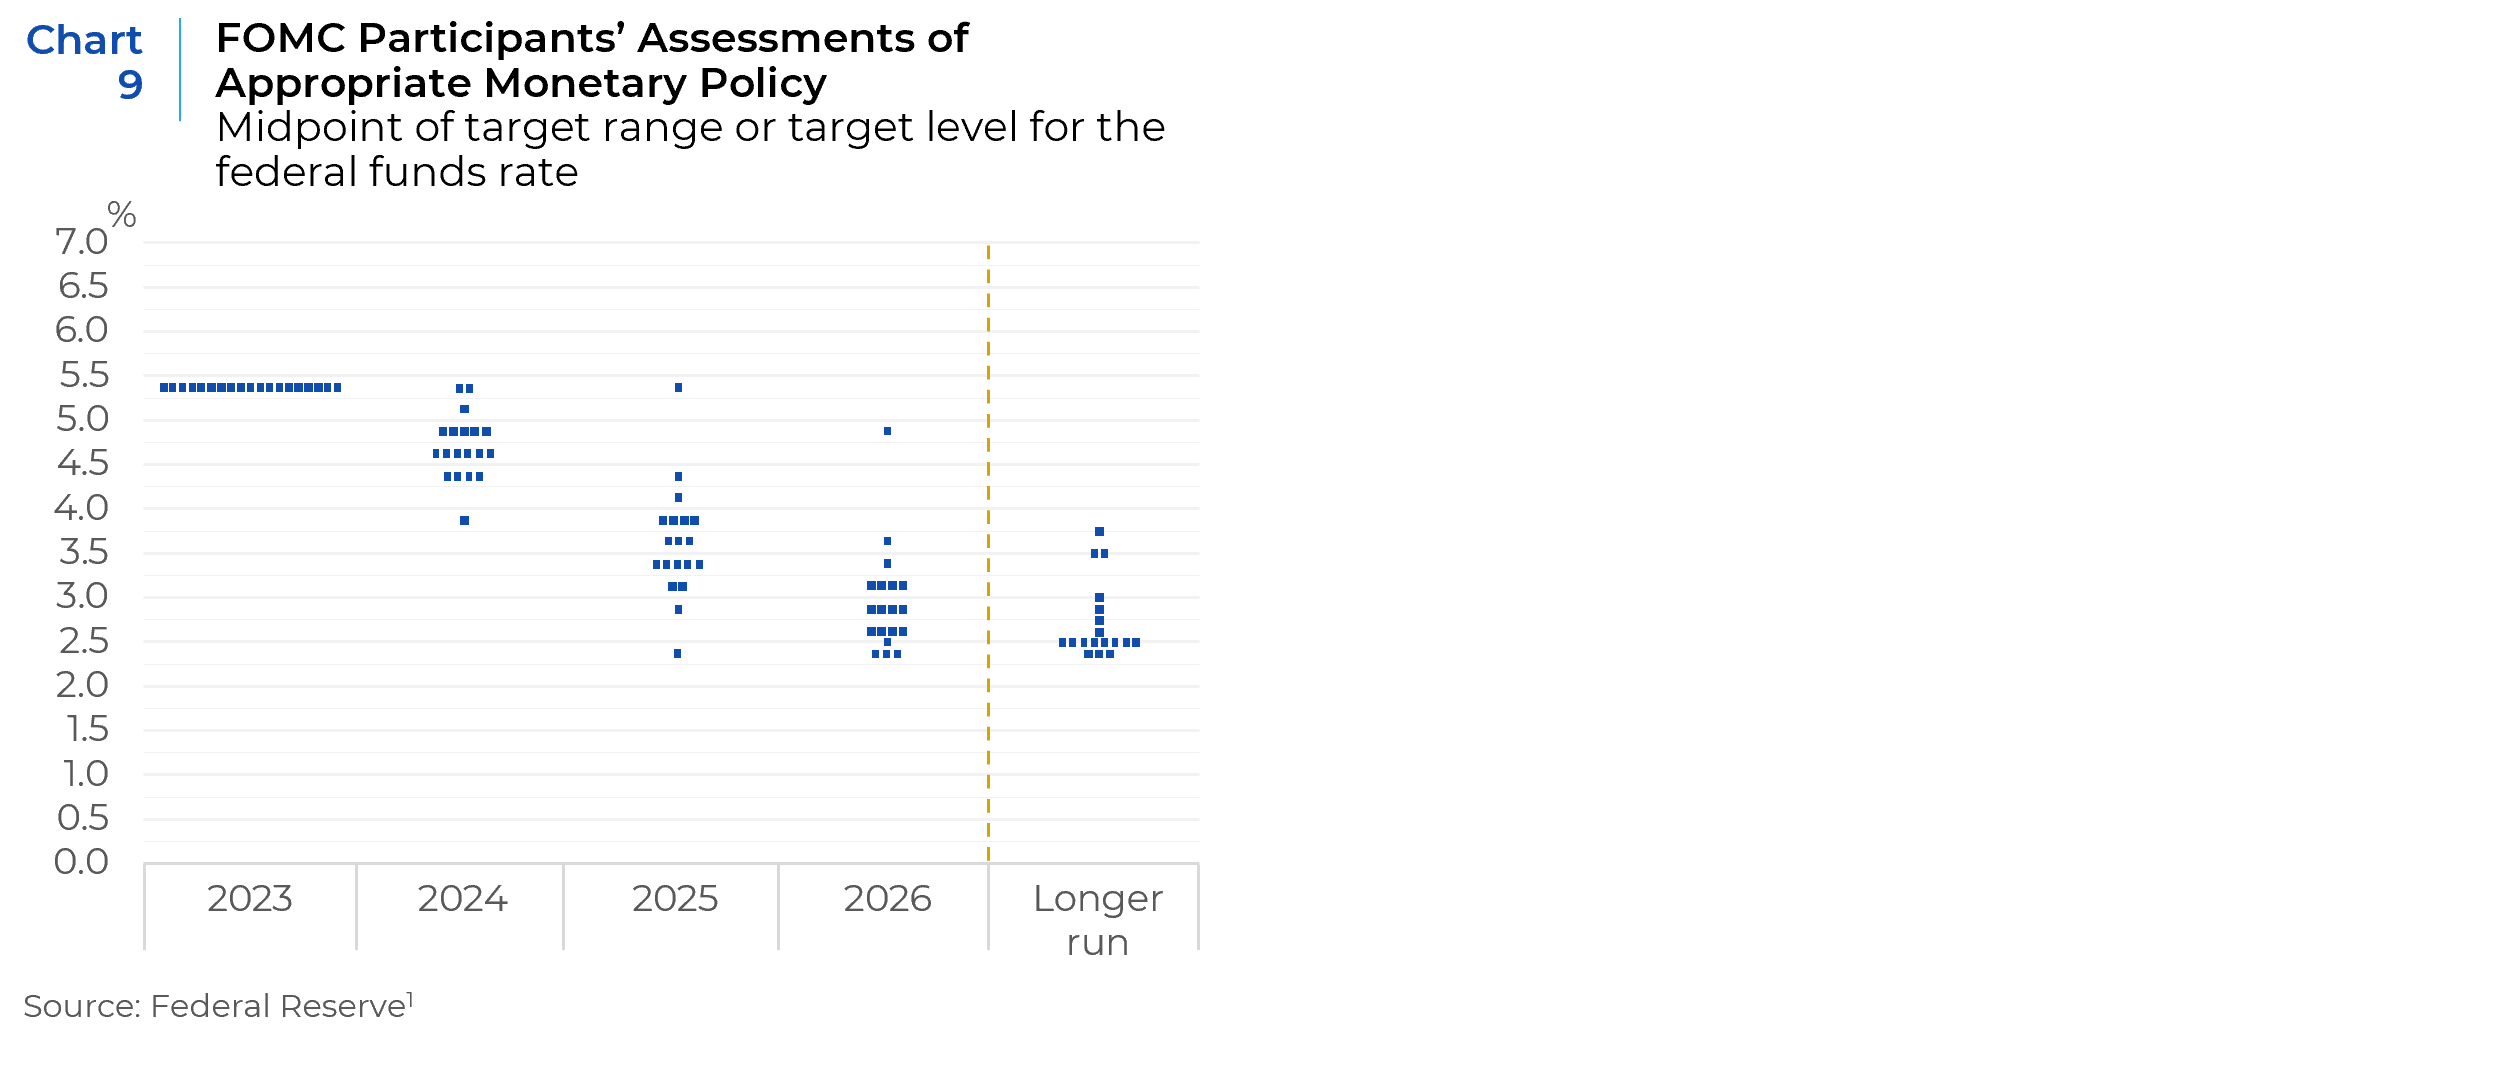
All this leads us to distrust the market expectations for 1.5%+ of rate cuts by the end of 2024 and instead to put more weight on Fed’s own dot plots (Chart 9) that portend policy rates of no less than 3.5% by the end of 2025.
The Burdens of Debt
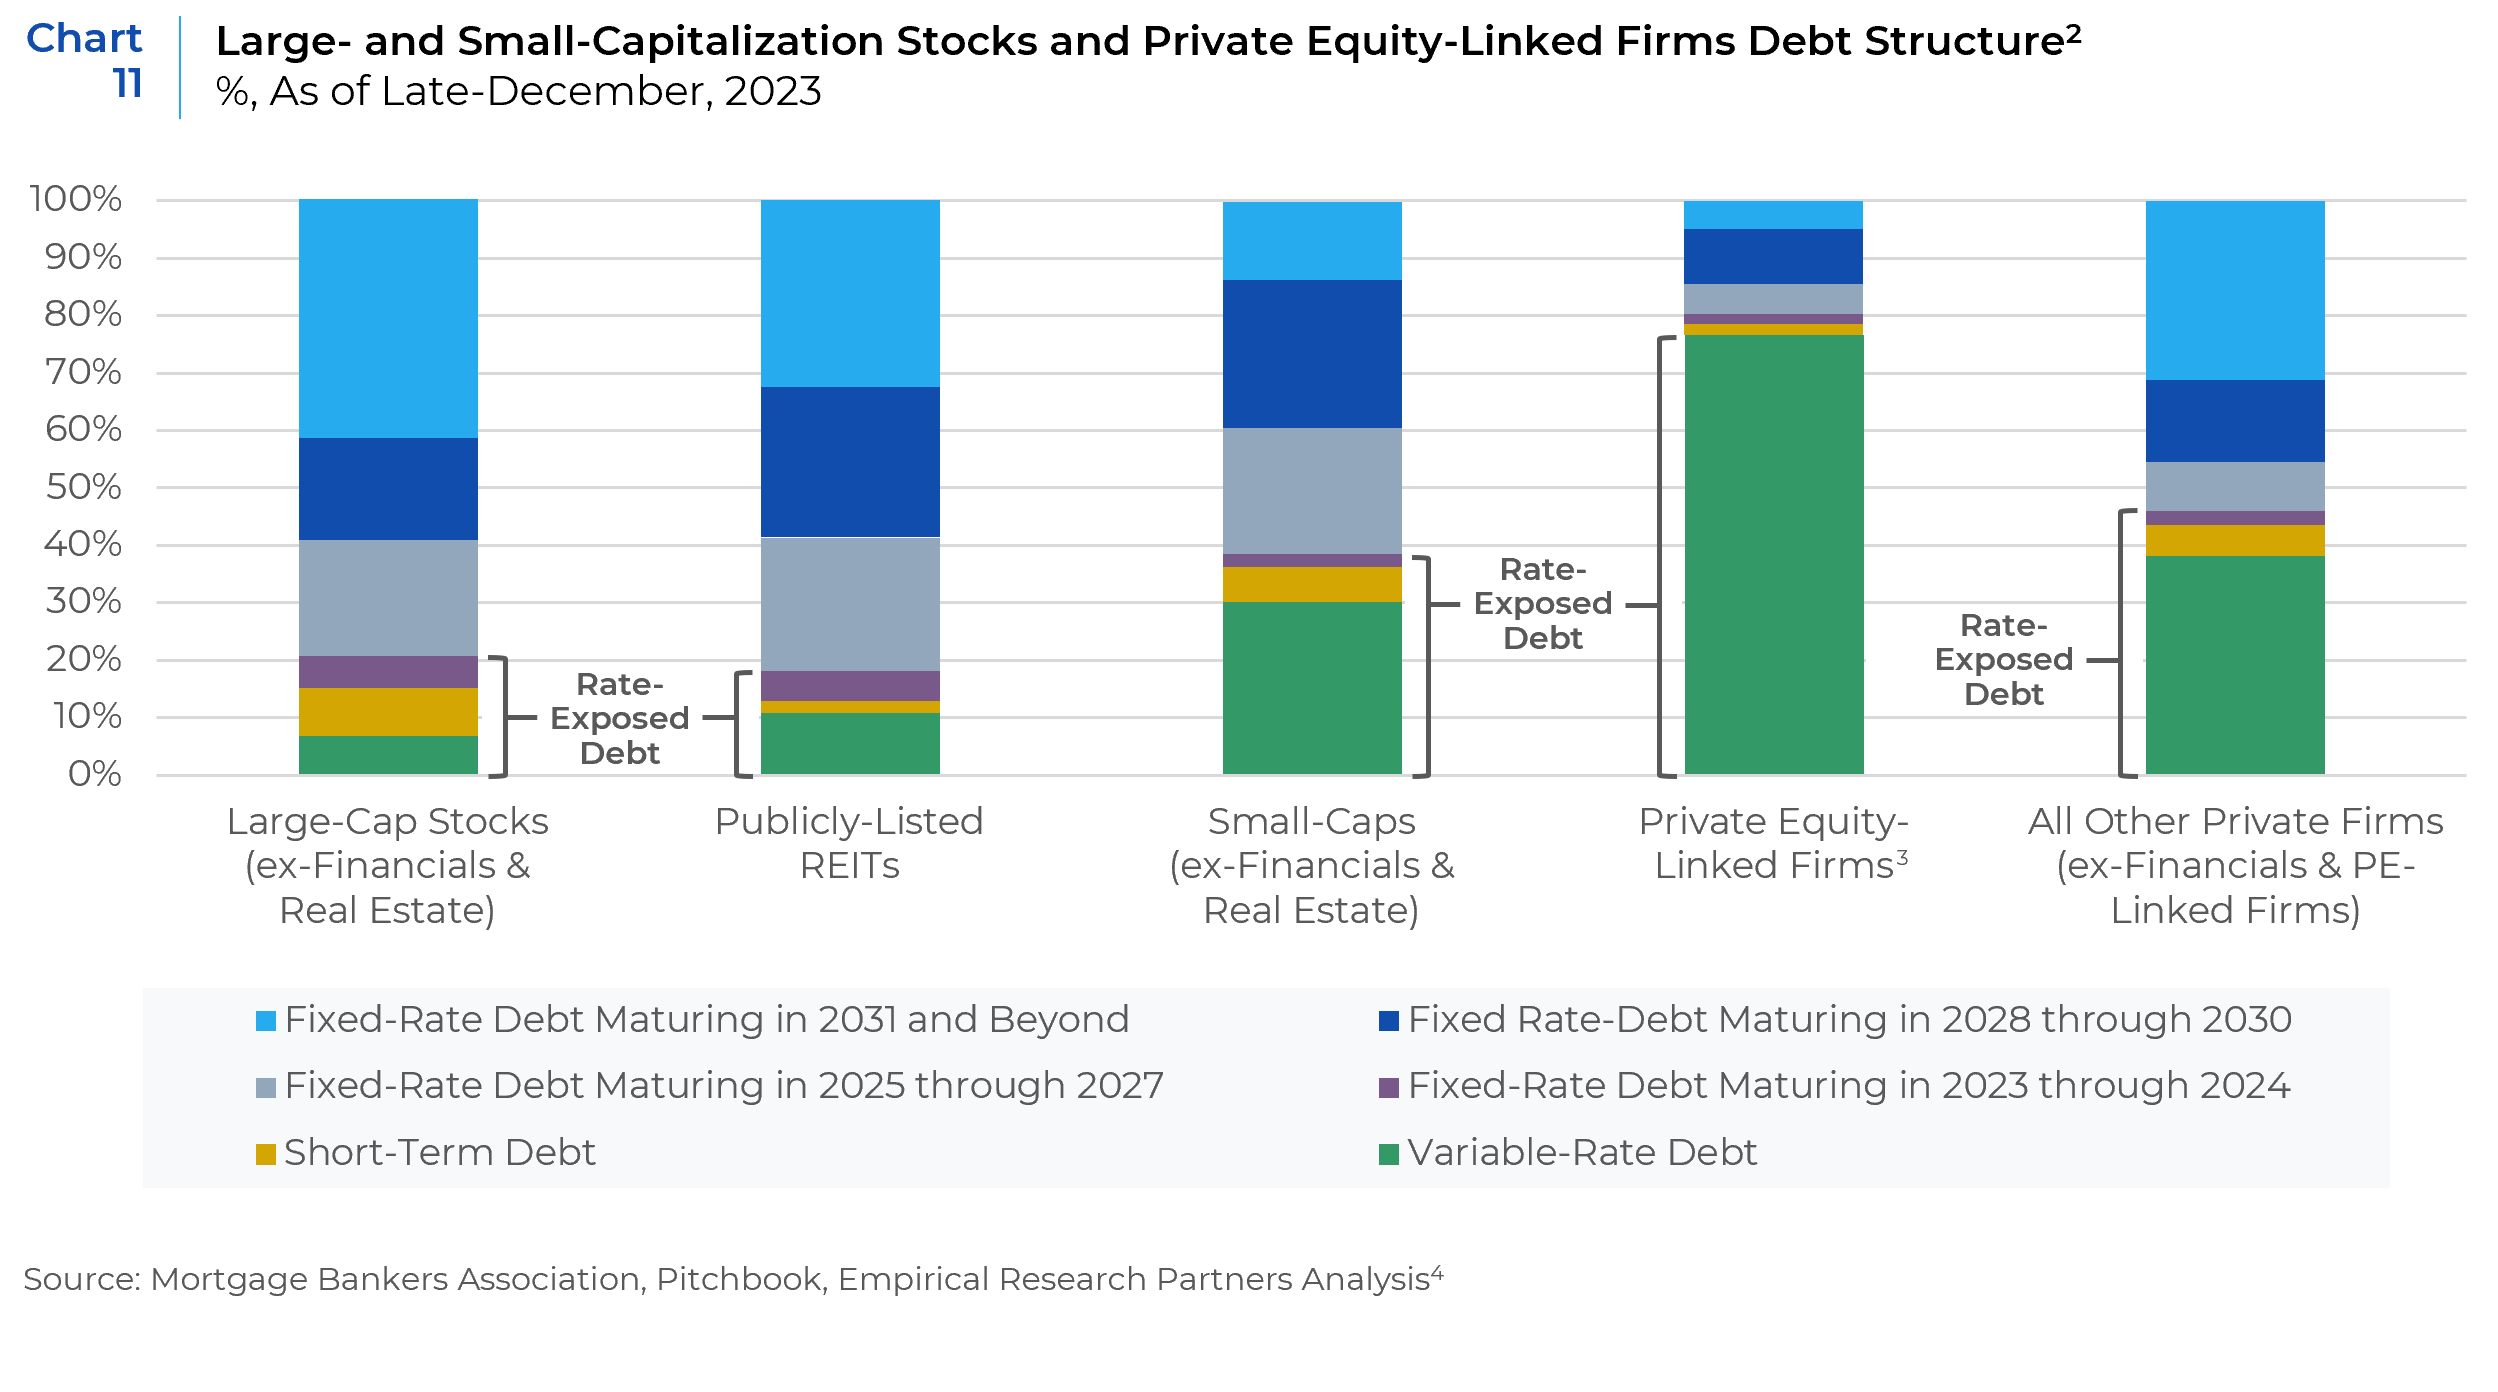
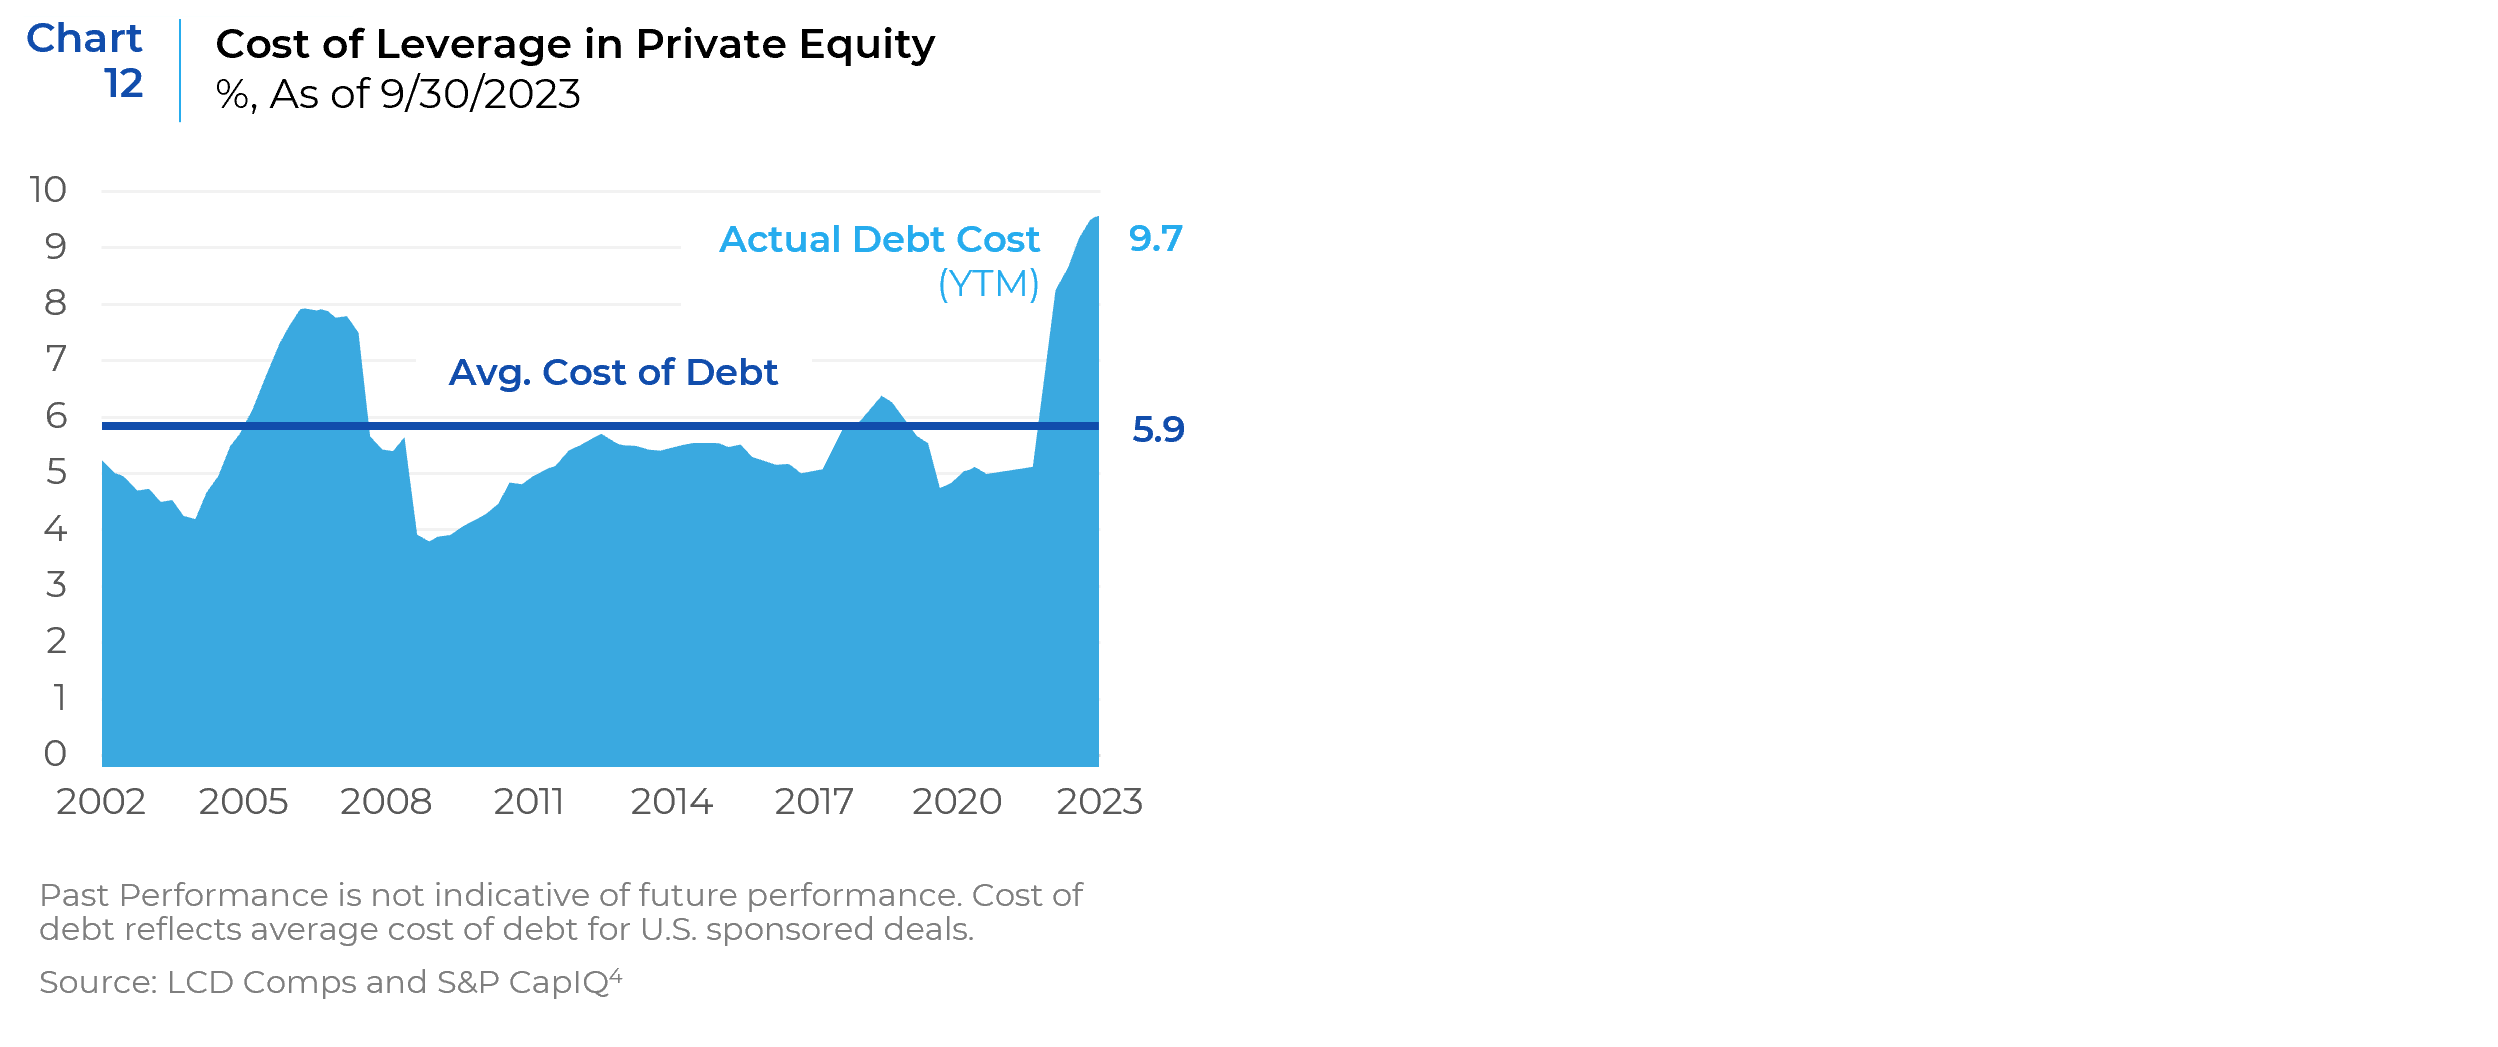
Looking across global markets, we can see that the largest debt burdens are in U.S. small cap and private markets, while Japan and U.S. large caps seem (on average) much more favorably positioned (Chart 10). But even among equally as indebted cohorts, their debt structures are quite different. Private equity linked firms have a large preponderance of their debt in variable-rate debt, while small cap stocks have much higher levels of fixed-rate debt, with nearly half of that debt still yet to mature for another two years or more (Chart 11). This means that pain for private equity-held earnings has mostly already occurred, where debt costs have doubled in just the past two years (Chart 12).

Within U.S. small caps, the bulk of the maturity wall will begin to hit in 2026 (Chart 13), though already the impairment to earnings of higher rates is being felt but will get much worse if rates persist at current levels (Chart 14).


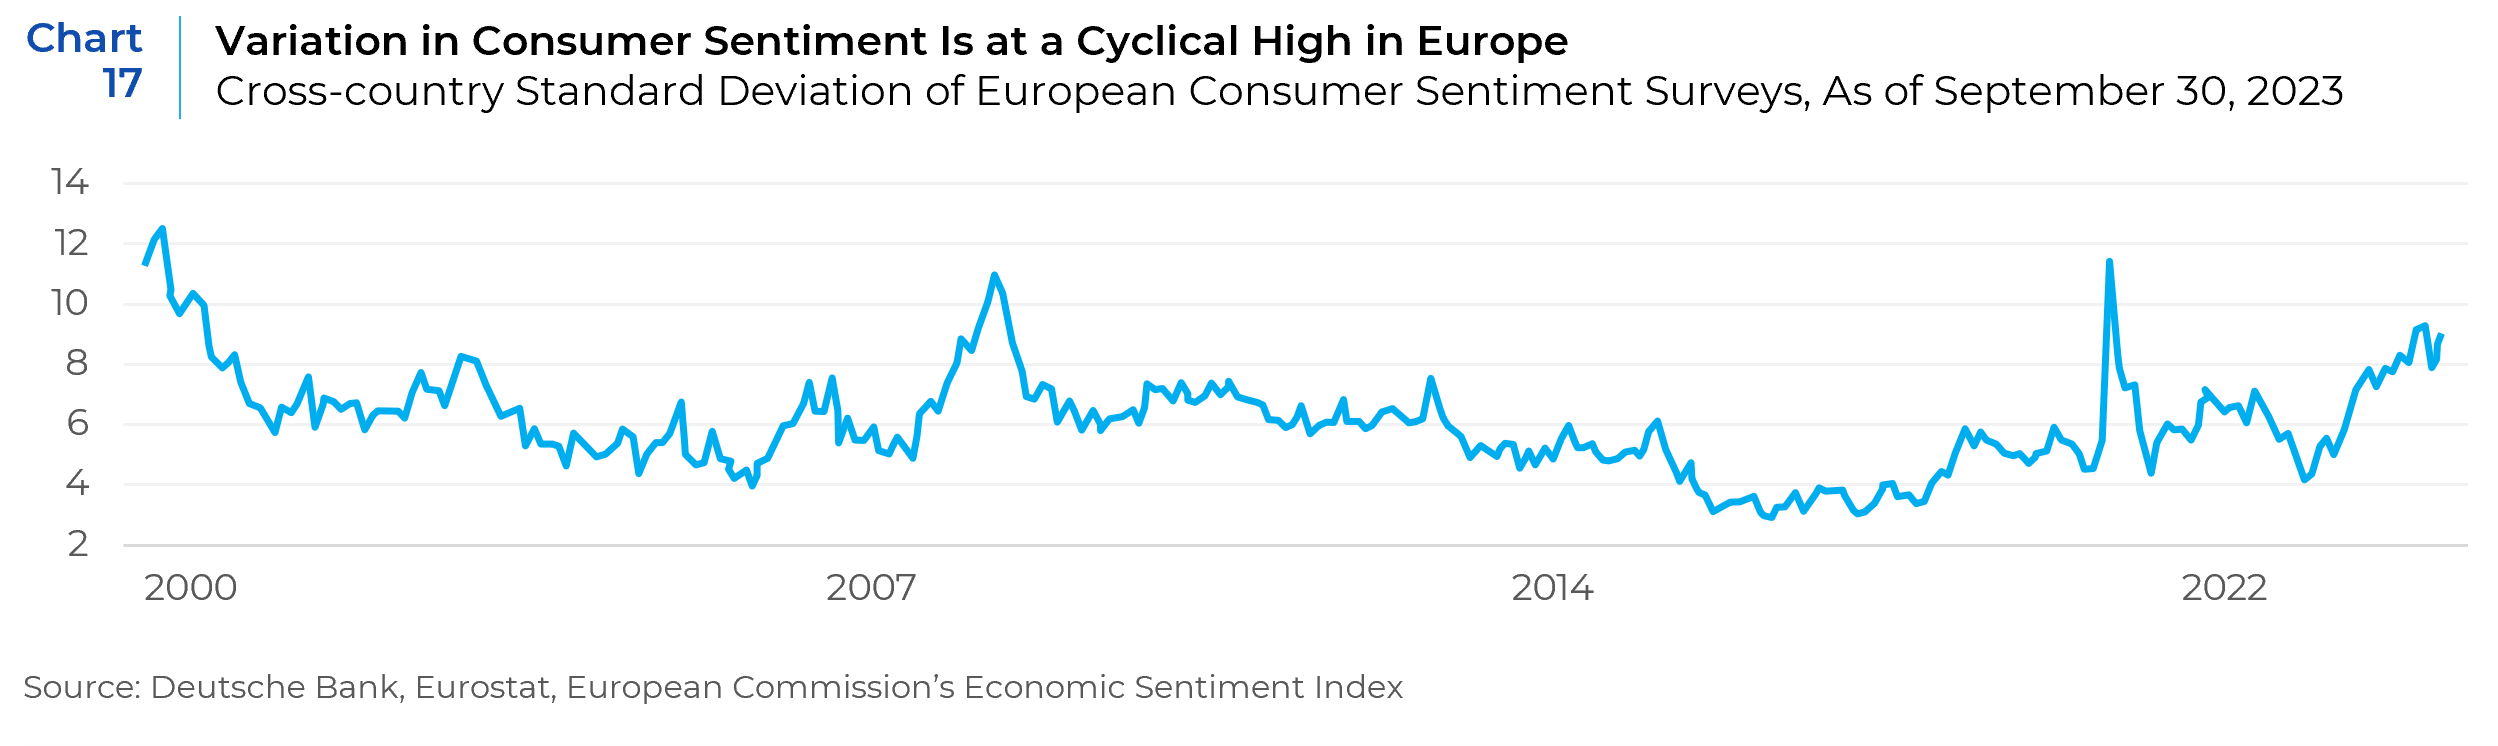
In Europe, small cap stocks face even more imminent maturity walls (see Chart 15), though the disparity with large caps is not so great in the coming years as in the U.S. market. Moreover, European yields largely remain below their American counterpart, thus reducing the relative earnings impact. However, within Europe debt structures vary widely across the continent, with much higher levels of variable rate financing in countries like Spain and Italy (closer to U.S. small cap levels) while French and German companies debt stock is more akin to U.S. large caps in relying on longer-term fixed rate financing (Chart 16). In this way, the earnings impact of higher debt costs is already better reflected in the financials of southern European companies than their northern European counterparts.


This may explain some of the huge uptick in consumer sentiment variation across the Eurozone, which has shot up over the past two years (Chart 17).
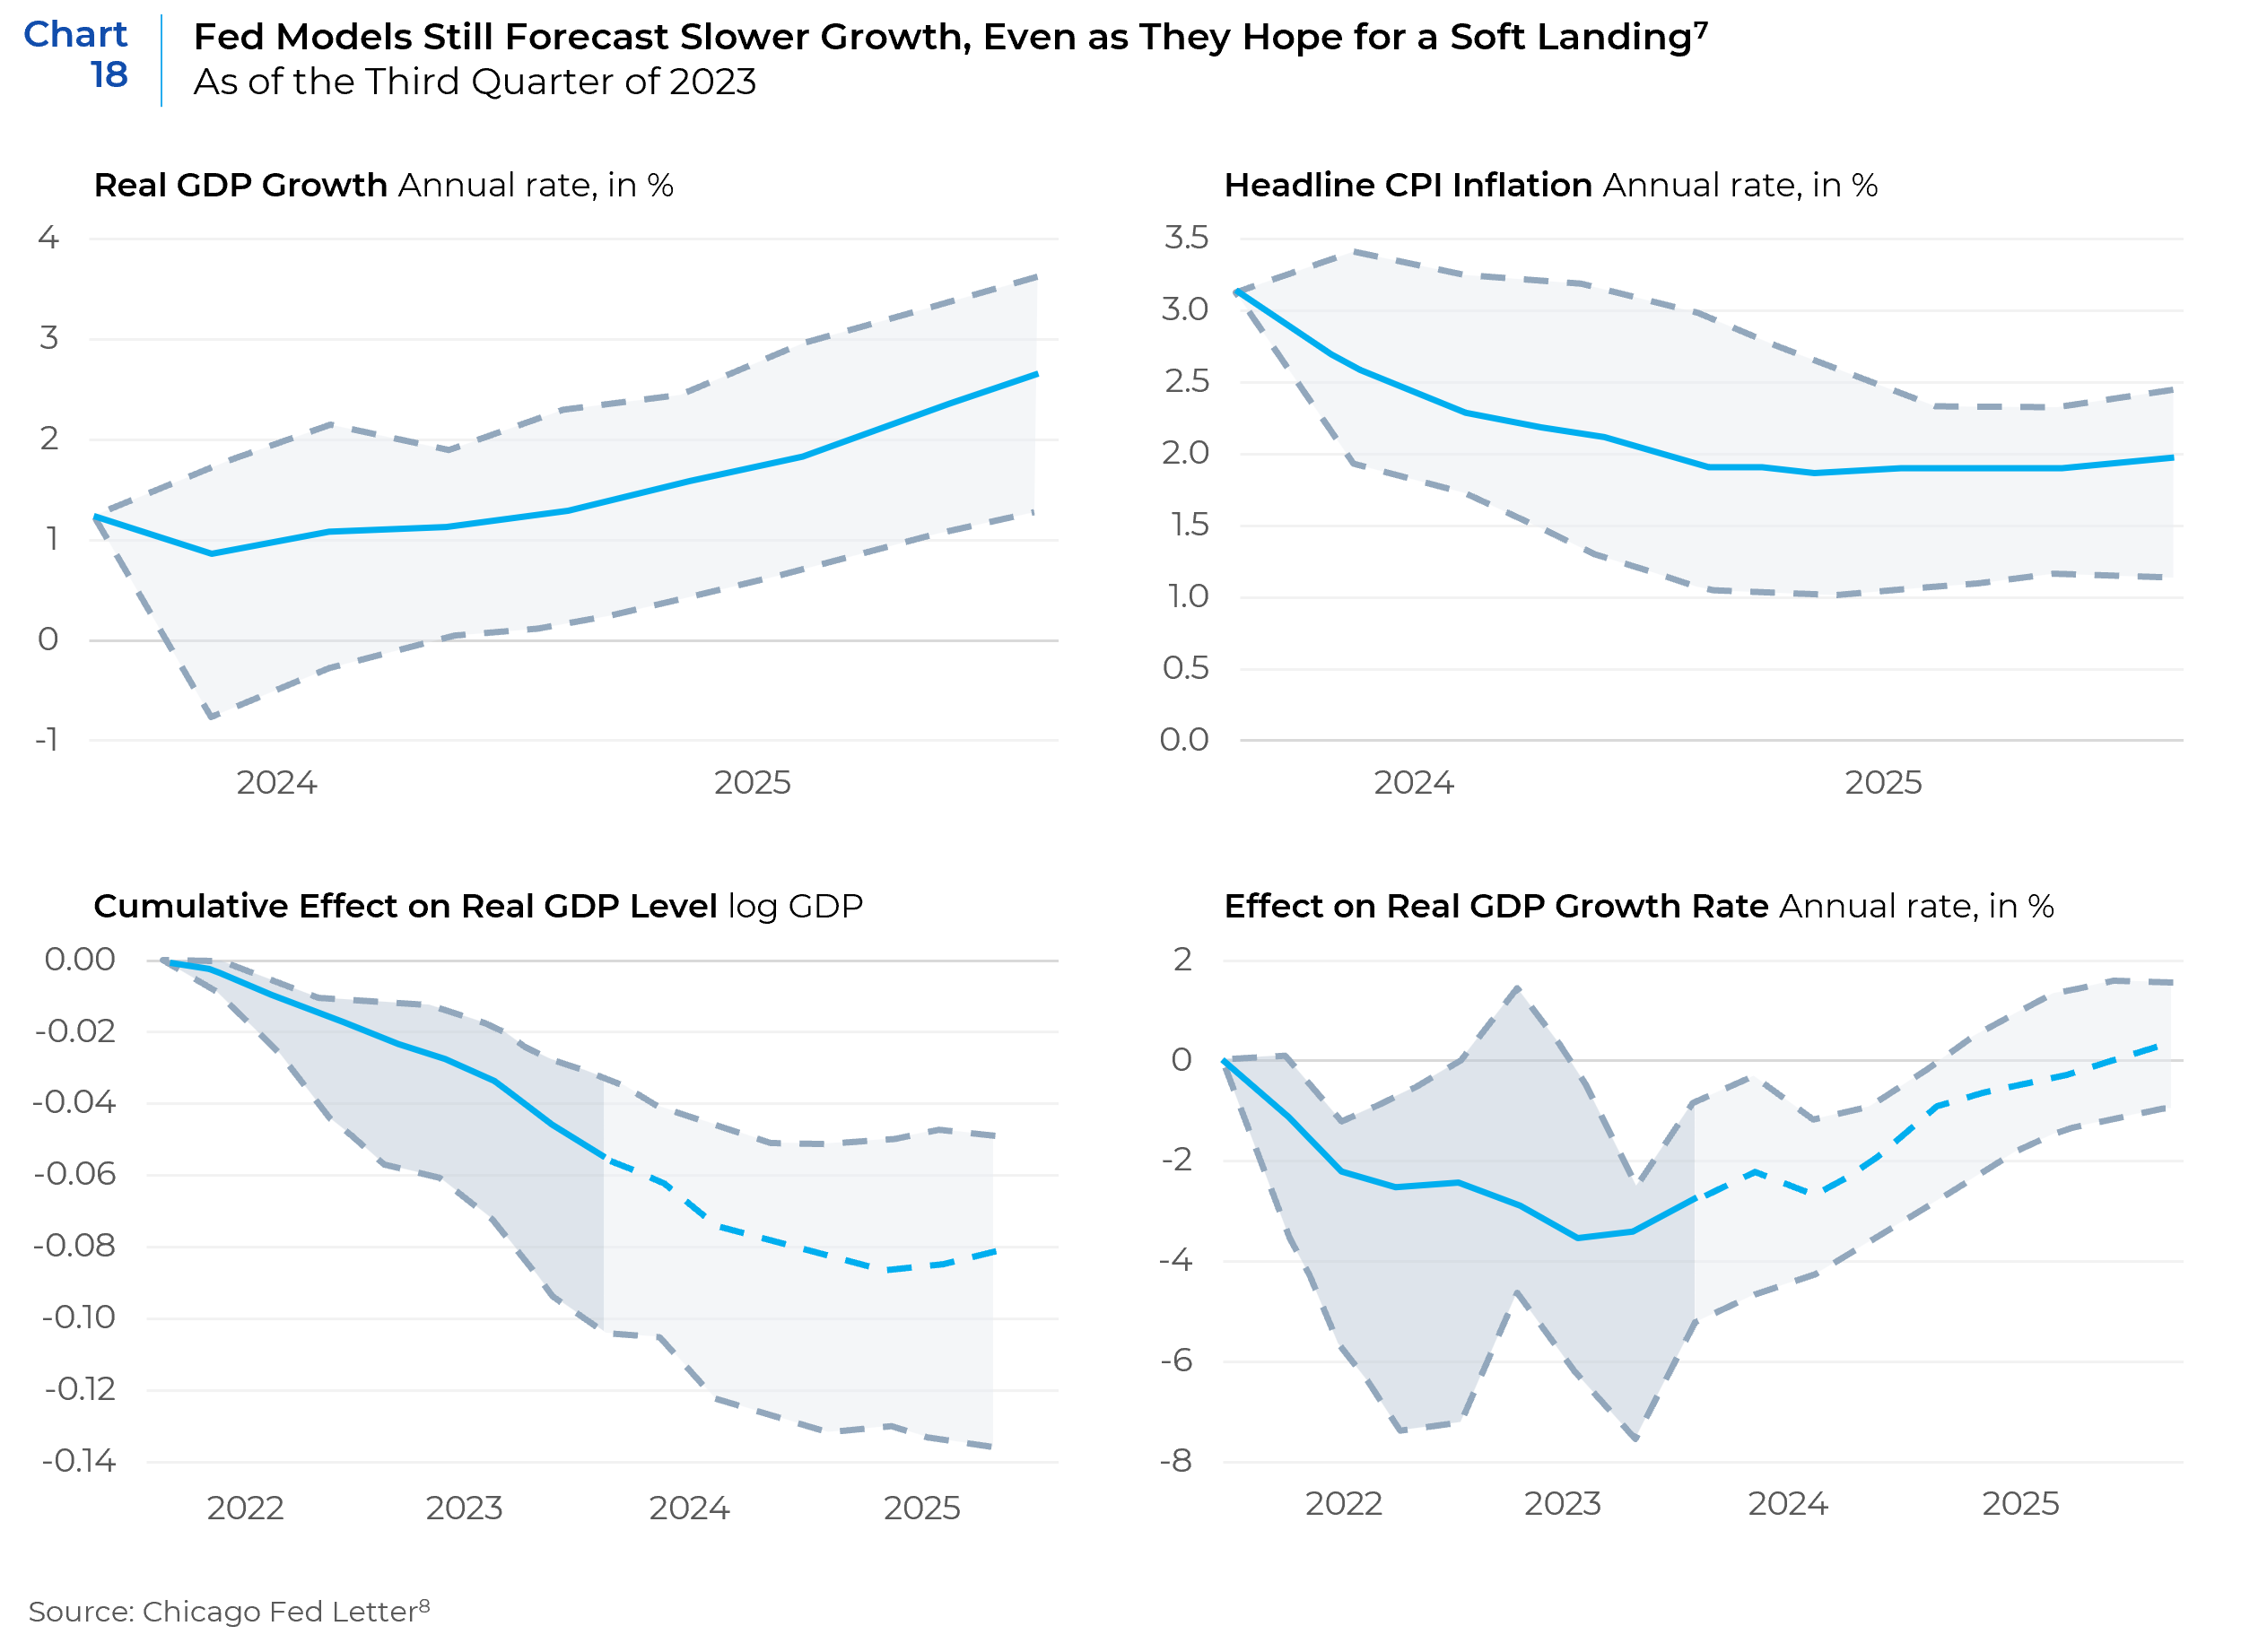
Beyond the drags to profitability is the potential drag on sales emanating from the broader economic lags of higher rates. The Chicago Federal Reserve recently updated its own projections, which forecast a reduction of GDP growth by 3% over what would have been achieved absent the Fed’s policy moves (Chart 18).
Opportunity Costs
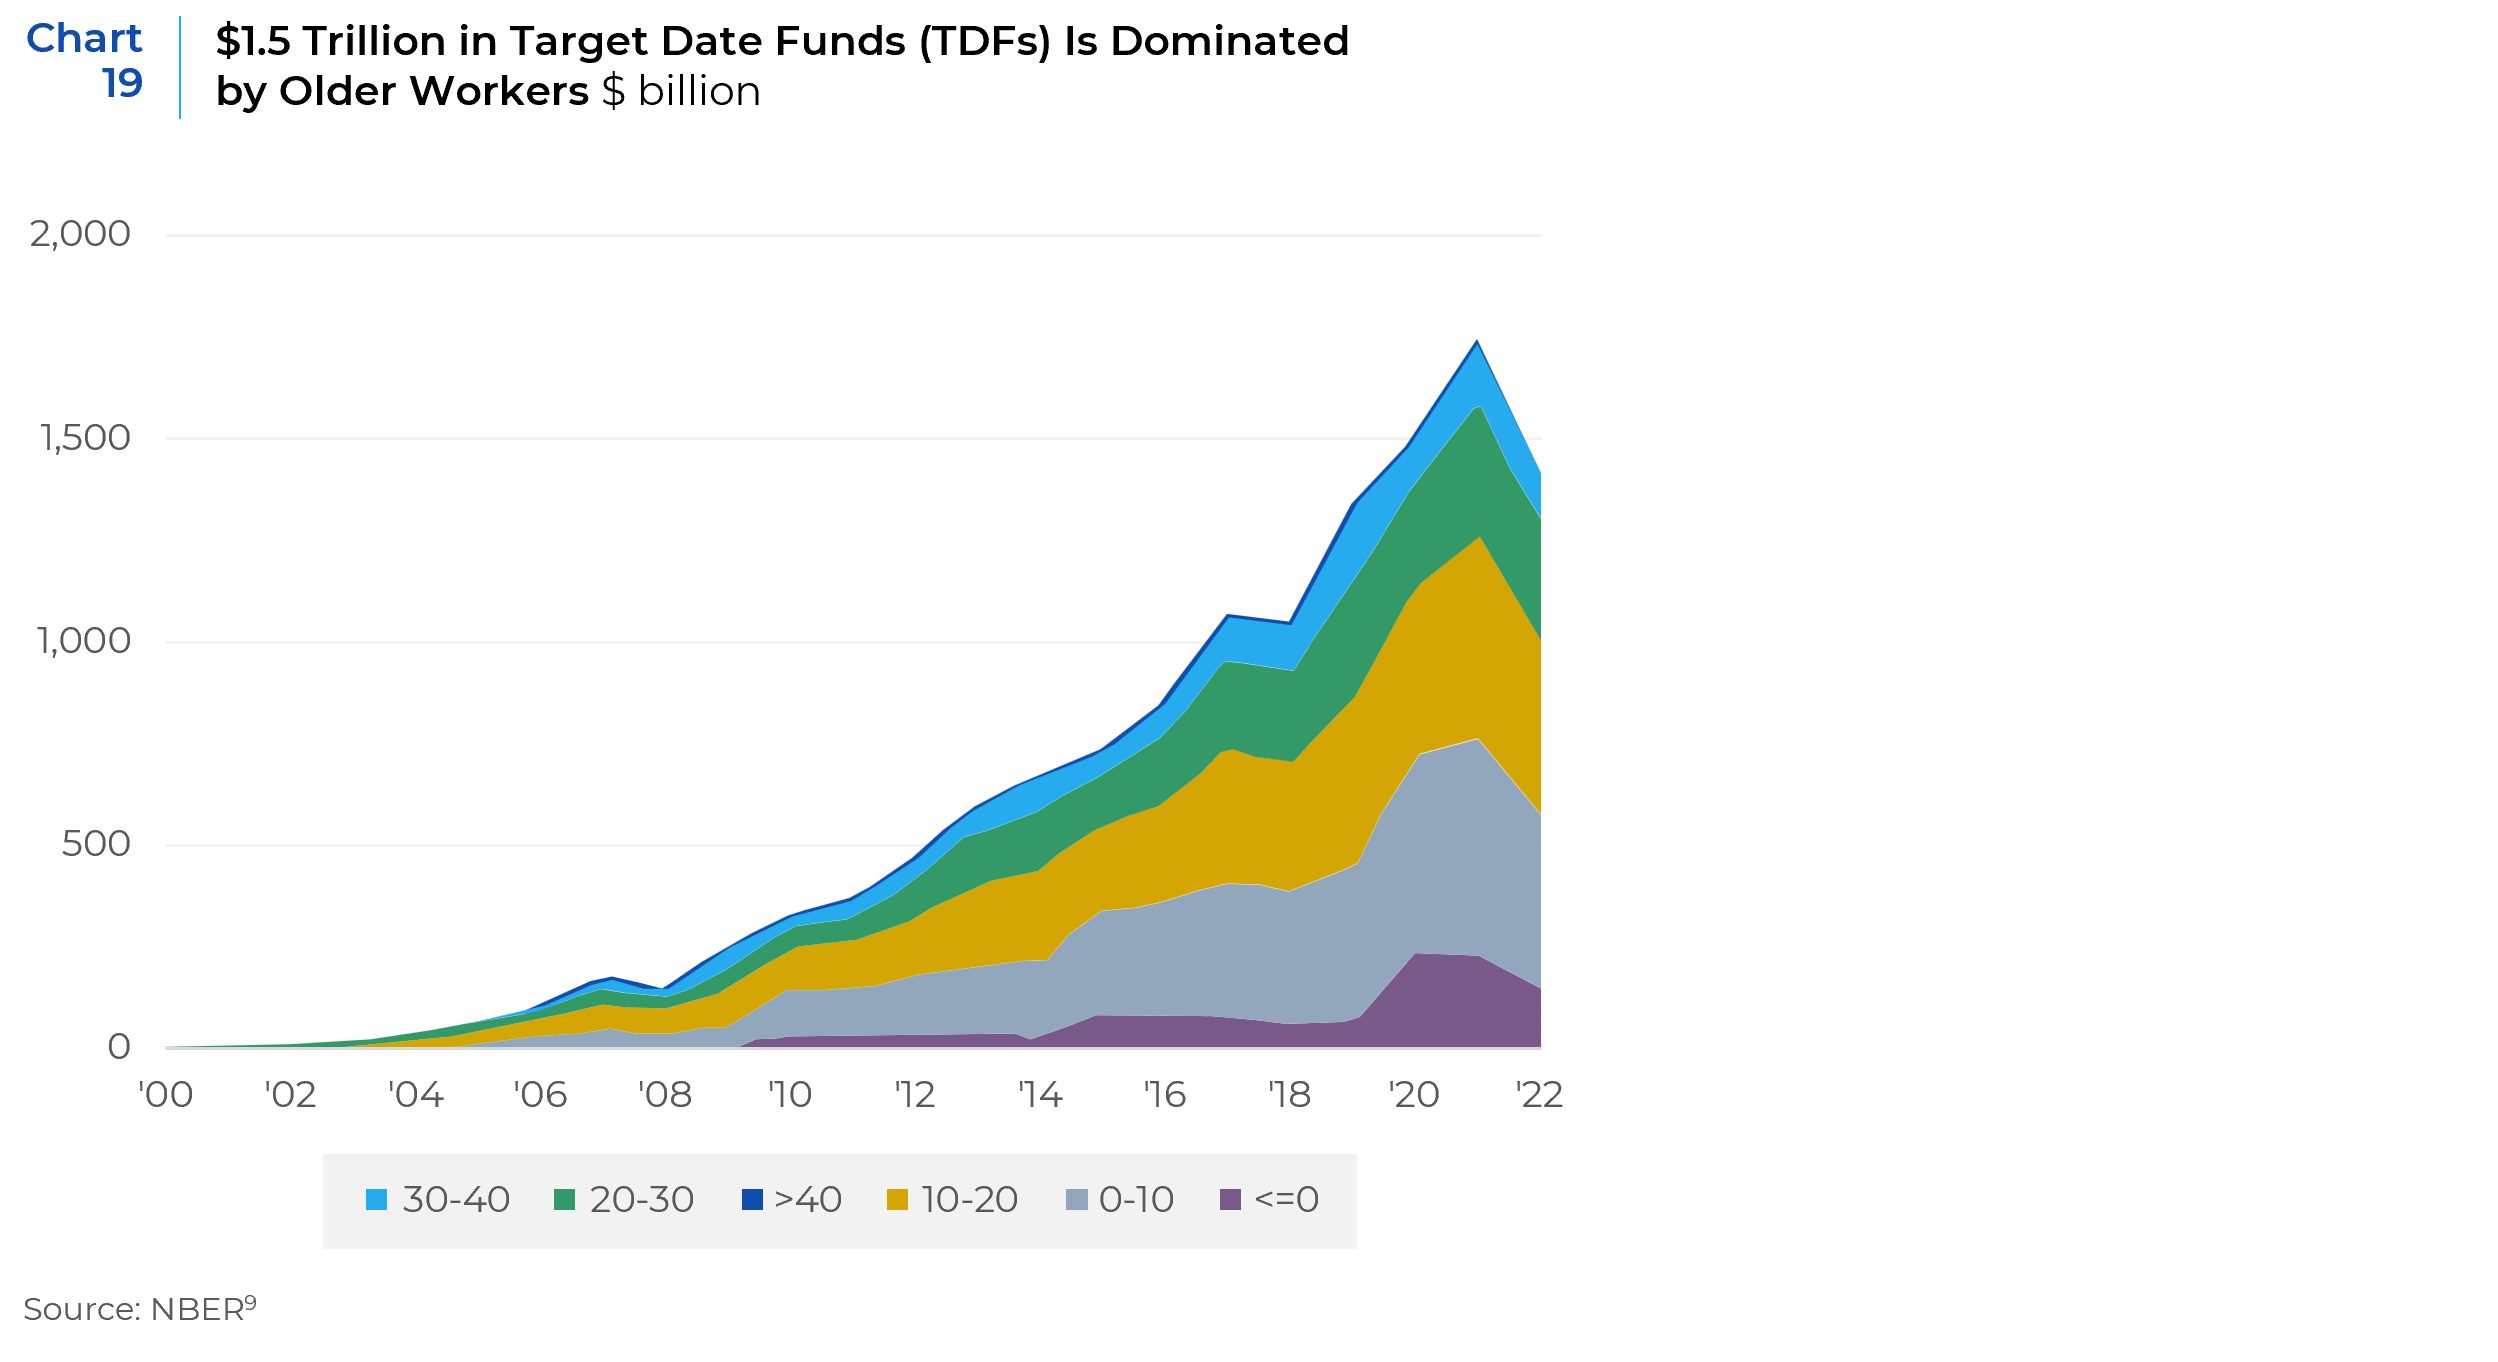
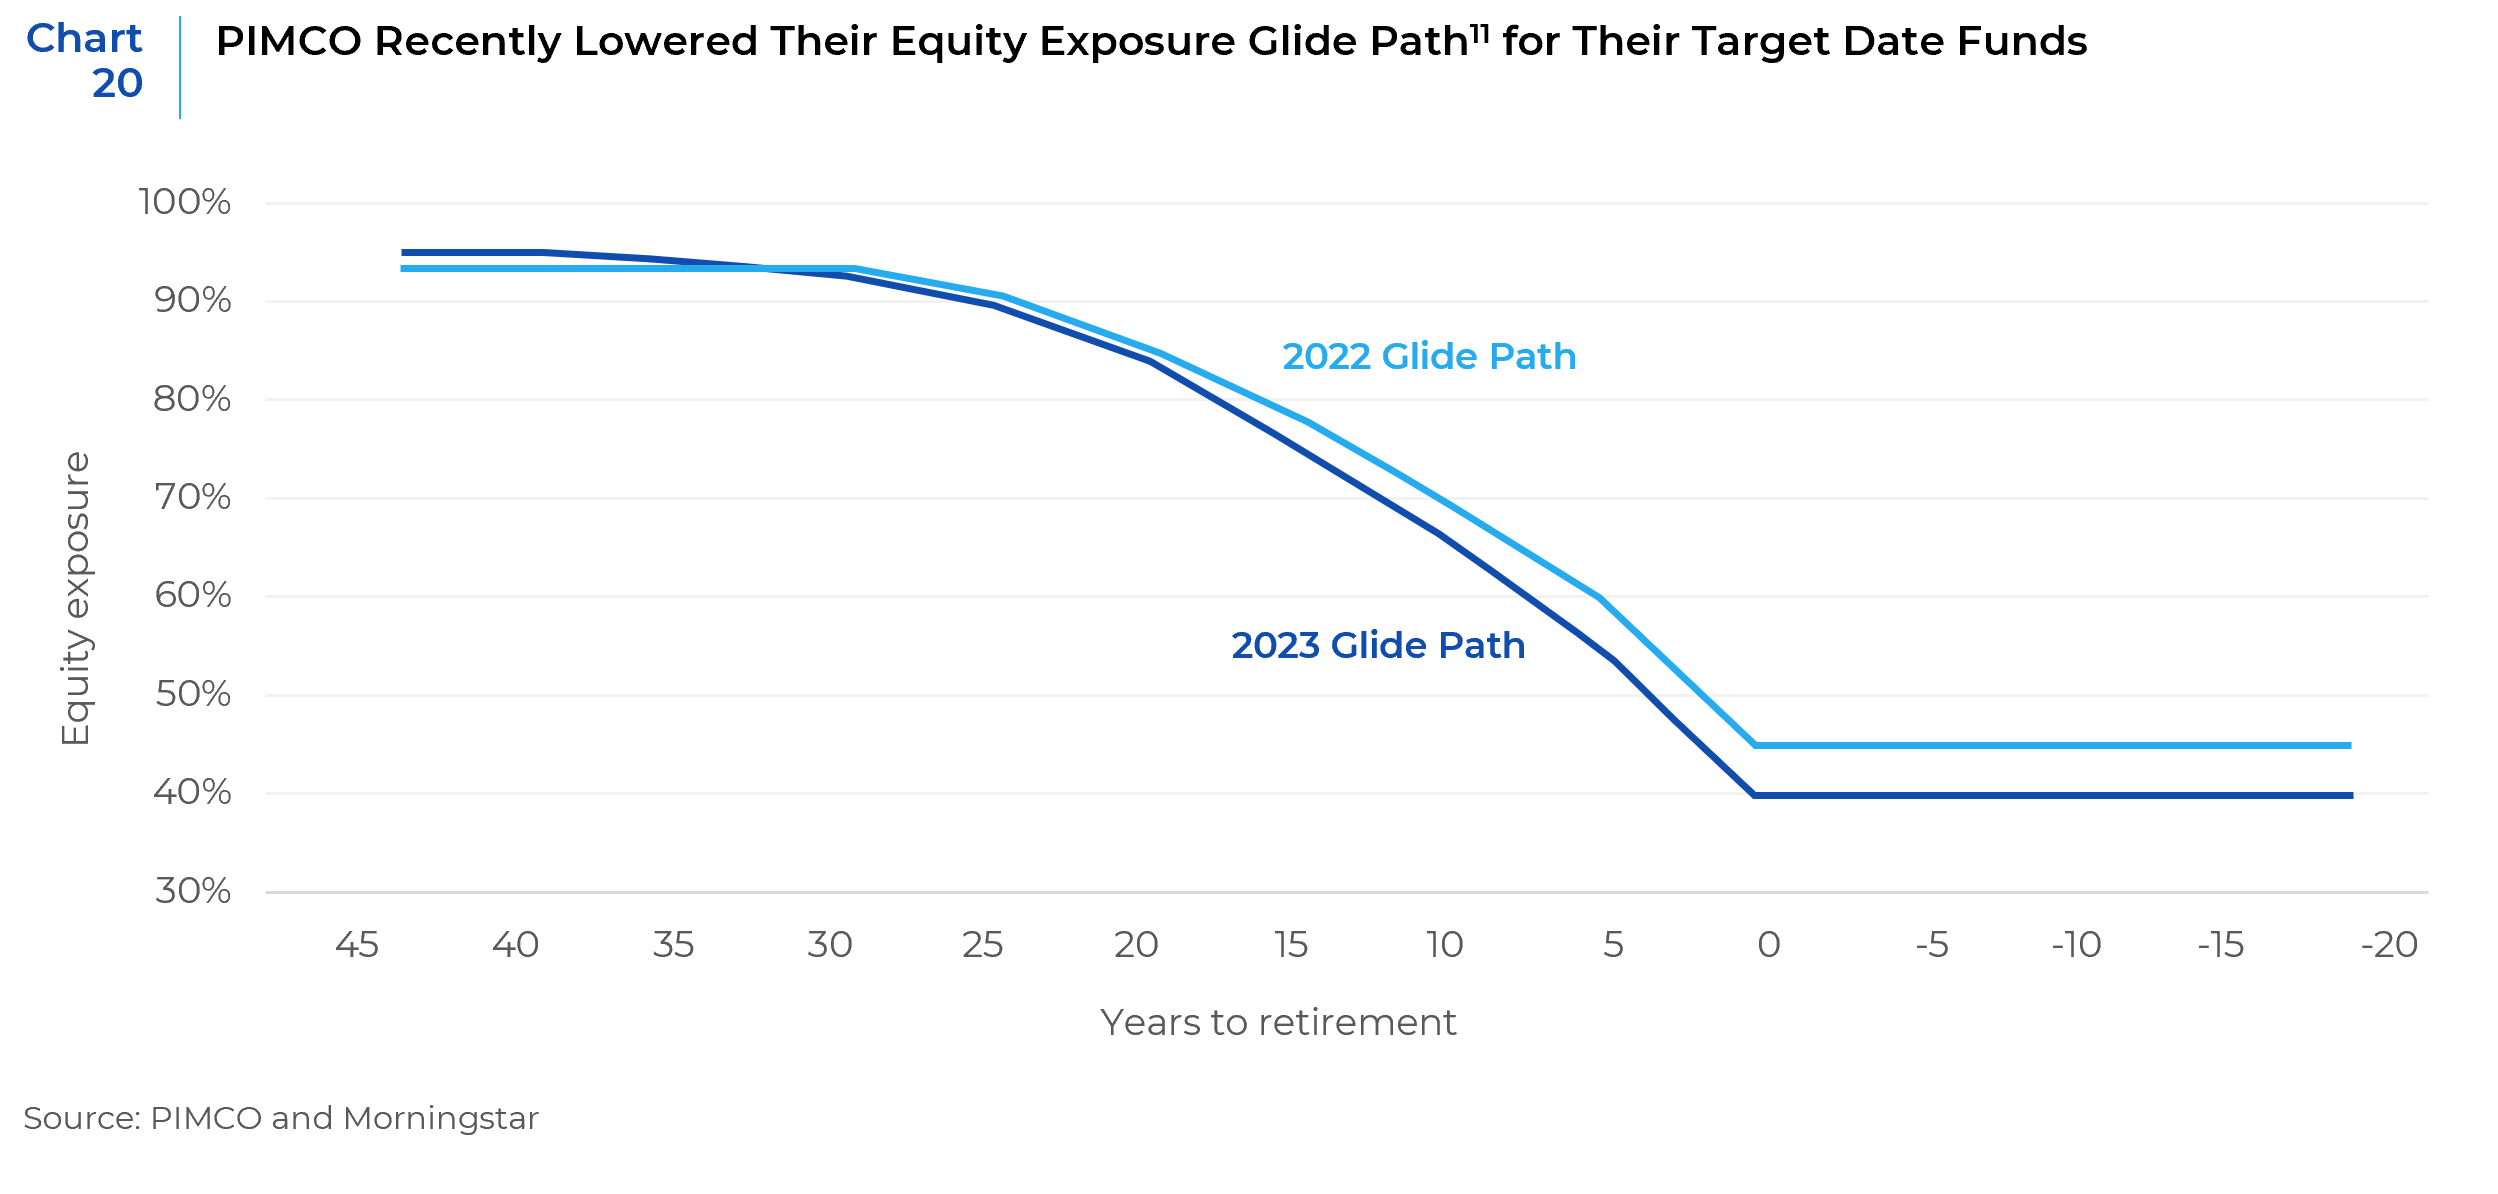
The risks to profitability and earnings come at a time when demand for public and private equities also faces headwinds, given the increased attractiveness to bonds and credit. News reports, outlooks, and other asset allocation announcements are rife with either outright increases to credit allocations, accelerations in the periodicity of asset allocation decisions (e.g. changing governing documents to make for asset allocation reviews more frequent), or public acknowledgements of ongoing reviews. Almost a third of assets in target-date funds are held by savers past or nearing retirement age and thus the incremental demand for equities is shrinking (see Chart 19). This is before the potential effects of target date funds themselves changing their own asset allocations, such as PIMCO recently announced for their own target date funds (Chart 20). Even Pitchbook, the Morningstar owned service that caters largely to private equity and venture capital investors, in updating their own efficient frontier models for “the minimum risk portfolio that is expected to achieve a 7% return” assesses that “the allocation to core bonds increases from 0% to 45%. This analysis suggests that allocators should be motivated to de-risk their portfolios from a strategic perspective and potentially wait for more attractive entry points for riskier assets…”10
- https://www.federalreserve.gov/monetarypolicy/files/fomcprojtabl20231213.pdf
- Rate-exposed debt is short-term debt plus variable-rate debt plus fixed-rate debt maturing in 2023 or 2024
- PE-linked firms are the portfolio companies of private equity firms plus LBOs. Excludes the private equity firms themselves.
- https://www.commonfund.org/cf-private-equity/the-rising-cost-of-debt-impact-on-private-equity
- Incremental interest expense assumes that all short-term and variable rate debt pays the new interest rate immediately and fixed-rate debt is rolled over at the new interest rate as it becomes due.
- The hypothetical borrowing cost is assumed to be the Treasury bond yield plus the current investment grade corporate spead of 1.3 percentage points. For small-caps, the current spread in effective borrowing costs over the S&P 500 of 1.5 percentage points is also added. Interest tax shield based on the marginal all-in Federal and state corporate tax rate of 2.7%.
- Notes: In the panels of this figure, the solid black lines depict the forecasts for real gross domestic product (GDP) growth and headline Consumer Price Index (CPI) inflation. The shaded regions surrounding the solid black lines are the interquartile ranges based on the uncertainty associated with our estimates from the D’Amico and King (2023) model. See the text for further details. Sources: Authors’ calculations based on data from the Federal Reserve Bank of St. Louis, FRED; and Wolters Kluwer, ‘Blue Chip Economic Indicators,’ from Haver Analytics.
- https://www.chicagofed.org/publications/chicago-fed-letter/2023/483
- https://www.nber.org/system/files/working_papers/w31640/w31640.pdf
- https://pitchbook.com/news/reports/2024-allocator-outlook
- https://www.pimco.com/en-us/insights/investment-strategies/strategy-spotlight/pimco-updates-its-2023-glide-path-for-target-date-funds/
This report is neither an offer to sell nor a solicitation to invest in any product offered by Xponance® and should not be considered as investment advice. This report was prepared for clients and prospective clients of Xponance® and is intended to be used solely by such clients and prospective clients for educational and illustrative purposes. The information contained herein is proprietary to Xponance® and may not be duplicated or used for any purpose other than the educational purpose for which it has been provided. Any unauthorized use, duplication or disclosure of this report is strictly prohibited.
This report is based on information believed to be correct but is subject to revision. Although the information provided herein has been obtained from sources which Xponance® believes to be reliable, Xponance® does not guarantee its accuracy, and such information may be incomplete or condensed. Additional information is available from Xponance® upon request. All performance and other projections are historical and do not guarantee future performance. No assurance can be given that any particular investment objective or strategy will be achieved at a given time and actual investment results may vary over any given time.