
The Times They Are A-Changin’”
As I write this research note, (October 13, 2022) annual core inflation has hit a 40-year high at 6.6% from a year ago (8.2% for overall inflation), guaranteeing another punishing rate hike by the FOMC. Market commentators are prognosticating about when we will get back to the relatively stable pre-pandemic Inflation “normal”, and the pain that will be inflicted on financial and real assets to get there. The Fed’s (and its European peers’) seemingly backward-looking decision-making framework is raising the risk of a financial accidents, particularly in the non-bank financial system. I am in the camp that believes cyclical inflation is nearing an inflection point due to easing supply pressures and the likelihood of a garden-variety income-driven recession in the US (as opposed to the more destructive balance sheet recession which led to the GFC), induced by further Fed rate hikes; a more severe recession in Europe, and tepid policy reflation out of China under the weight of an over-leveraged property sector and their zero COVID policy. However, like Bob Dylan, I believe that the times are a-changin’ as structural forces that are outside of central banks’ control are leading to a higher and more volatile inflationary “normal”. These dynamics, the focus of this research note, will be consequential for long term institutional investors because they will raise risk free rates underpinning both asset prices and investment decisions. Moreover, inflation volatility, which alters the correlations impacting asset allocation models, will be buoyed by continual re-appraisement of assumptions as we journey to the new normal and as we settle into a less stable multipolar geopolitical regime. Our prior research on the investment implications can be found here: Asset Allocation During Challenging Geopolitical Times.
Chart 1 depicts the relative contribution of structural vs. cyclical factors to annual core inflation provided by the San Francisco Federal Reserve.1 While cyclical factors have oscillated with the business cycle, structural inflation steeply declined from the late 1980s (hovering around 5%), dropped to 2% in the 1990s, and averaged 1% thereafter until 2021. Over the entire series, structural inflation averaged 2% and cyclical inflation averaged 3%. Depending on the trajectory of productivity (which offsets inflation and is discussed at greater length below), structural Inflation Is likely to approach the 1990s 2% level or higher. This could lead to core inflation normalizing at between 3% and 4%, which is well above 5 and 10-year breakeven inflation rates of 2.29% and 2.38%, respectively.
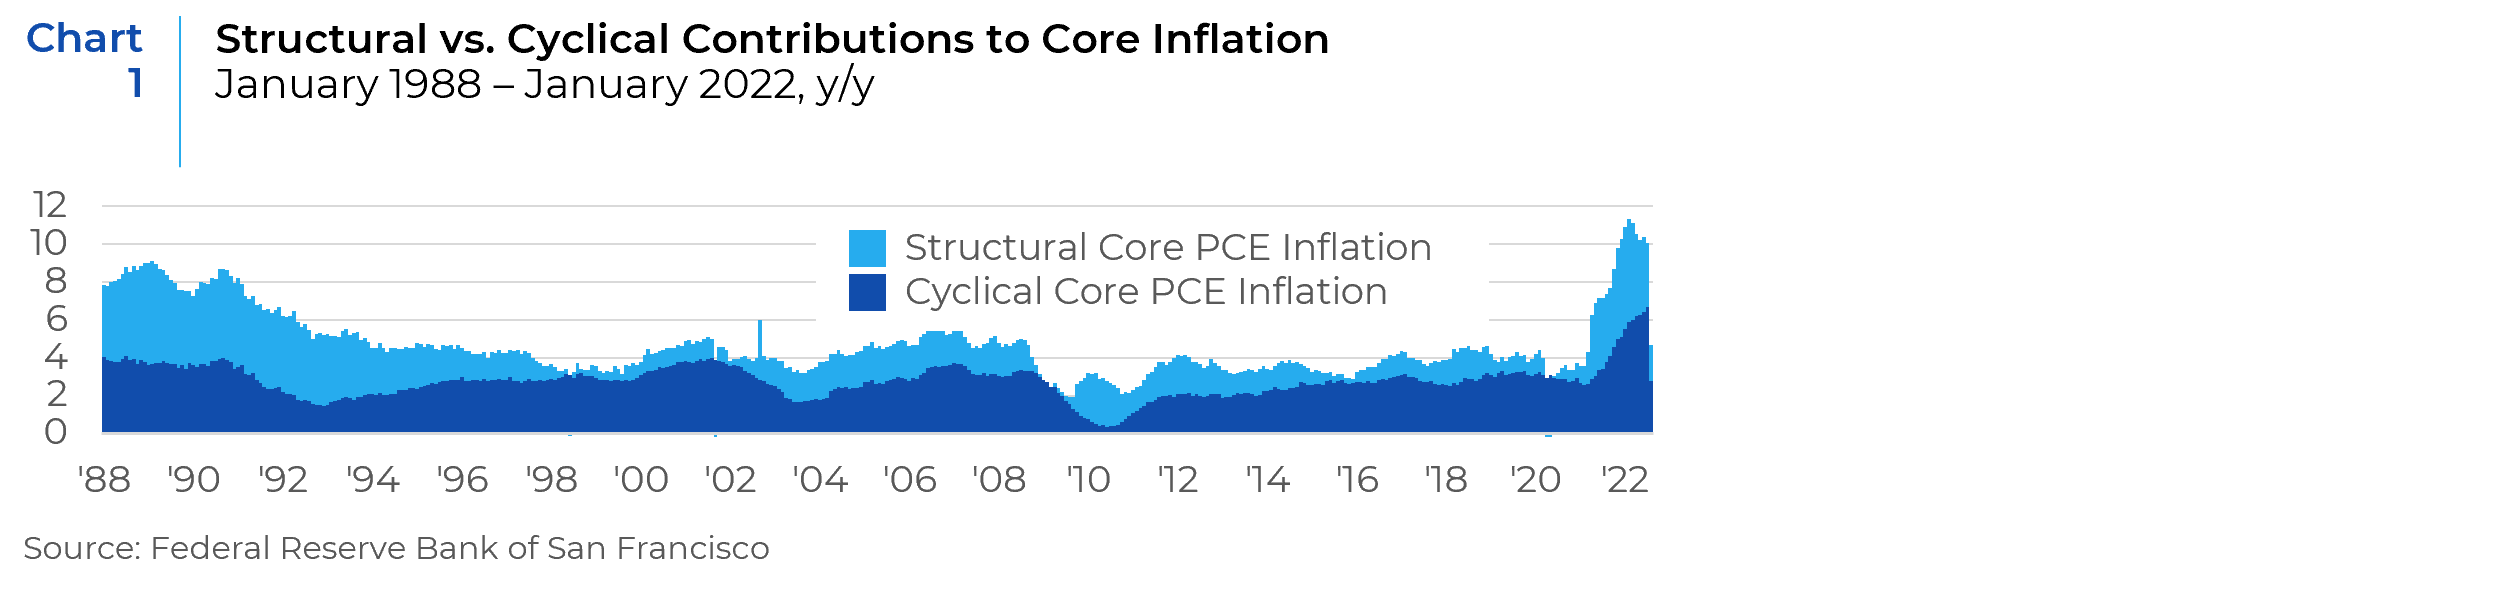
The SF Fed decomposed structural Inflation Into two categories: Health Care (Chart 2) and Non-Health Care (Chart 3).
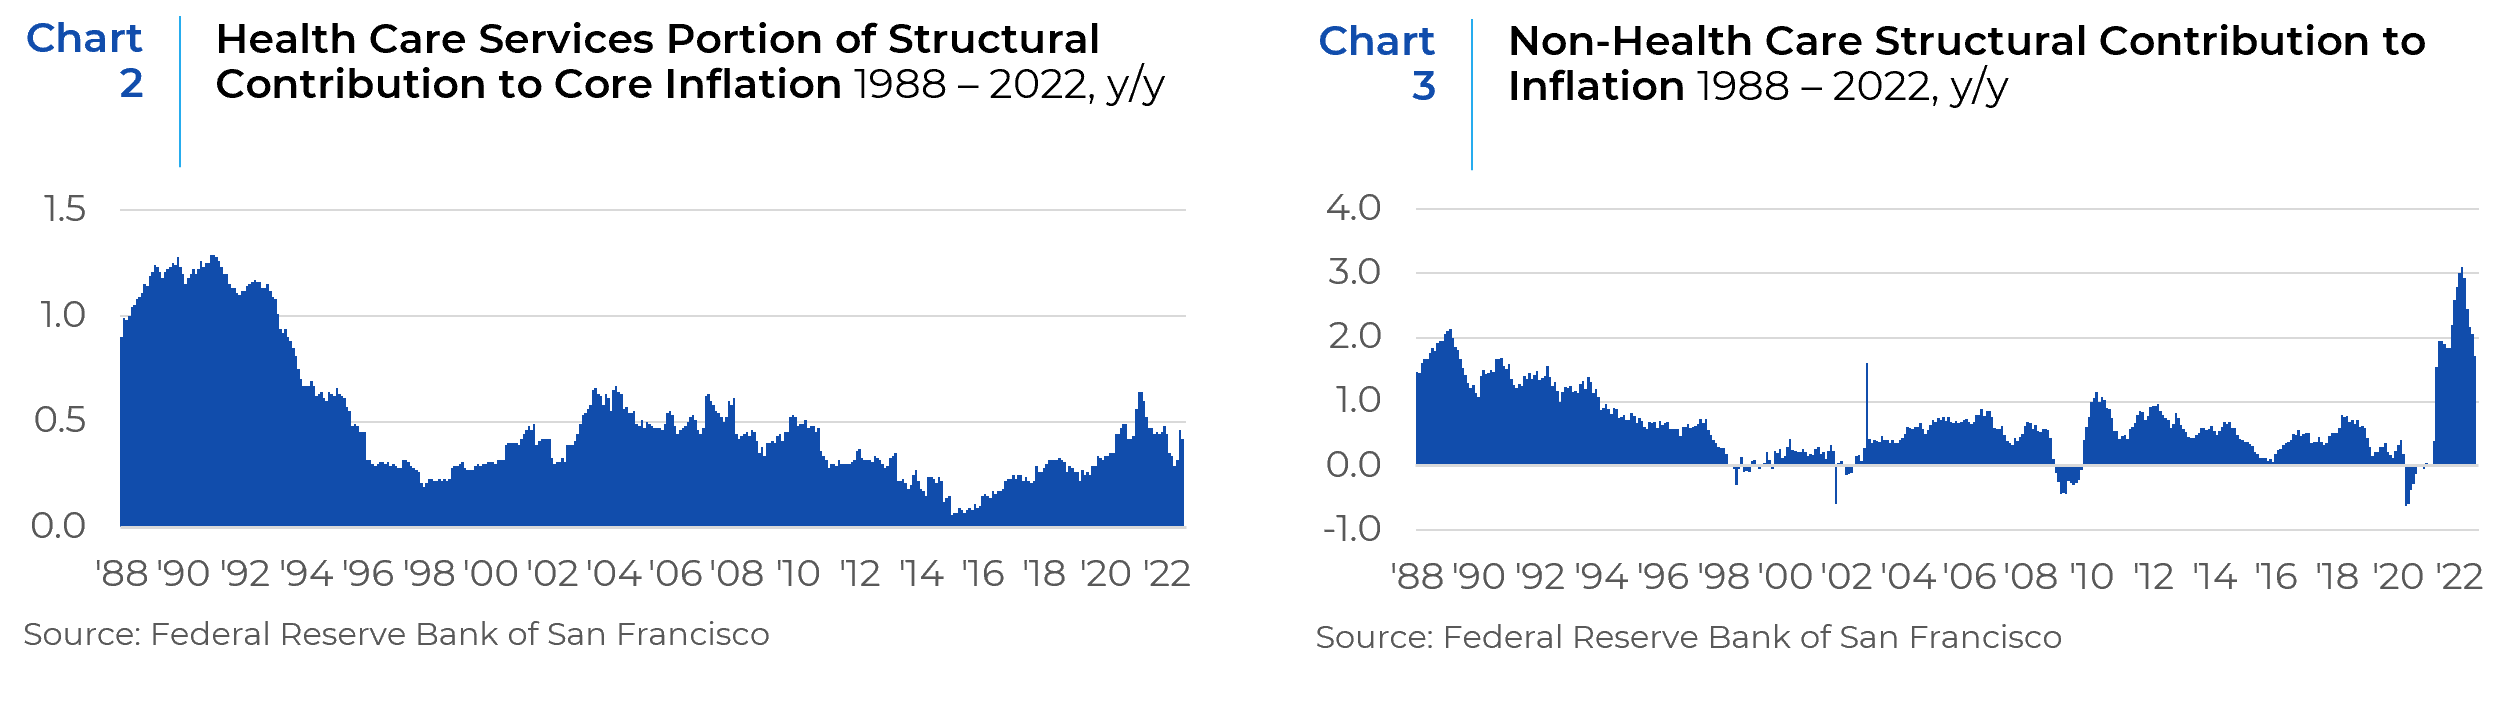
The top two drivers of health inflation have been service price and demographics (specifically, population growth and aging). Other influences include disease prevalence and medical service utilization. The spike in health care inflation in 2020 was undoubtedly due to the Coronavirus pandemic. However, absent policies that better control the price and the utilization of health care, aging populations in the U.S. and most developed economies are likely to increase health care inflation over the next decade.
Fed Chairman Paul Volcker is often viewed as the Superman central banker who single-handedly slayed inflation. While his draconian interest rate hikes undoubtedly tamed cyclical inflation, the 40-year endurance of his inflation fighting policies benefited from powerful disinflationary structural impulses: a massive increase in the supply of labor which decreased wage pressures; globalization, which reduced production input costs; the IT revolution, which was both deflationary and productivity enhancing, and fiscal policy orthodoxy. Consequently, as depicted in Chart 3, non-healthcare structural inflation precipitously declined from the late 1980’s to the beginning of the 21st century. Thereafter, non-healthcare structural inflation rarely touched 1% even after the notable effects of commodity price inflation in the early 2000s due to China’s industrialization, and protectionist measures in 2017. In 2021, non-health-care structural inflation rose to unprecedented levels of about 3%. Some of this rise is undoubtedly due to short-term dynamics, such as supply chain pressures and commodity price increases in response to the pandemic lockdown and Russia’s invasion of Ukraine, respectively. But we believe that this rise also reflects a reversal of the structural disinflationary forces that we explain below:
- Demographics. The entry of women and the baby boom generation into the workforce significantly increased labor supply and the support ratio (of active to retired workers) in the 1990s. Over the next decade, an aging population will both reduce the support ratio and increase healthcare inflation.
- Evolution away from fiscal orthodoxy. Loosely referred to as the Washington Consensus, fiscal orthodoxy (typically characterized by privatization, deregulation, free trade, counter cyclical fiscal policy and central bank independence) gained prominence with the election of Margaret Thatcher in the UK and Ronald Reagan in the U.S. Thereafter, even left leaning politicians, such as Tony Blair, Bill Clinton and Gerhard Shroeder, governed in line with these principles. By favoring economic efficiency and shareholder primacy over other societal goals, the fiscal and regulatory policies espoused by this framework facilitated trade, regulatory and labor practices that helped to subdue Inflation. Currently, politicians on both the right and left appear to be returning to less orthodox fiscal policies, notably exemplified by unfunded tax cuts in the U.S. and U.K., more dirigiste economic policies, increased protectionism, and massive fiscal transfers.
- Geopolitics and the end of American Hegemony. American hegemony and more specifically, the end of the cold war, ushered in a massive labor supply shock that helped tame inflation. As China and Eastern Europe opened and allowed their population to join global capitalism, Western and Japanese corporations were able to arbitrage lower labor costs and suppress wage growth. This was highlighted by the dramatic decline in labor’s share of income after 2000. These massive structural increases to the supply of labor are unlikely to be repeated. Indeed, the primary challenge facing the U.S. and U.K central banks for this cycle is spiraling wage inflation.
- Hyper globalization and the entry of China into the World Trade Organization at the end of 2001 unleashed a wave of offshoring and downward pressure on traded goods prices. While not dead, globalization is no longer a powerful source of disinflation. Tariffs and other protectionist measures are already increasing prices. Accordingly, U.S. import prices from China are back to their highest level in a decade after falling steadily during the eight years to 2020. Moreover, post-pandemic measures to protect supply chains by stock piling strategic commodities and “friend-shoring” inputs will likely raise production costs.
- Energy Transition. The transition towards Net Zero which has limited financing for and curtailed the supply of cheaper carbon-based energy sources will be inherently inflationary.
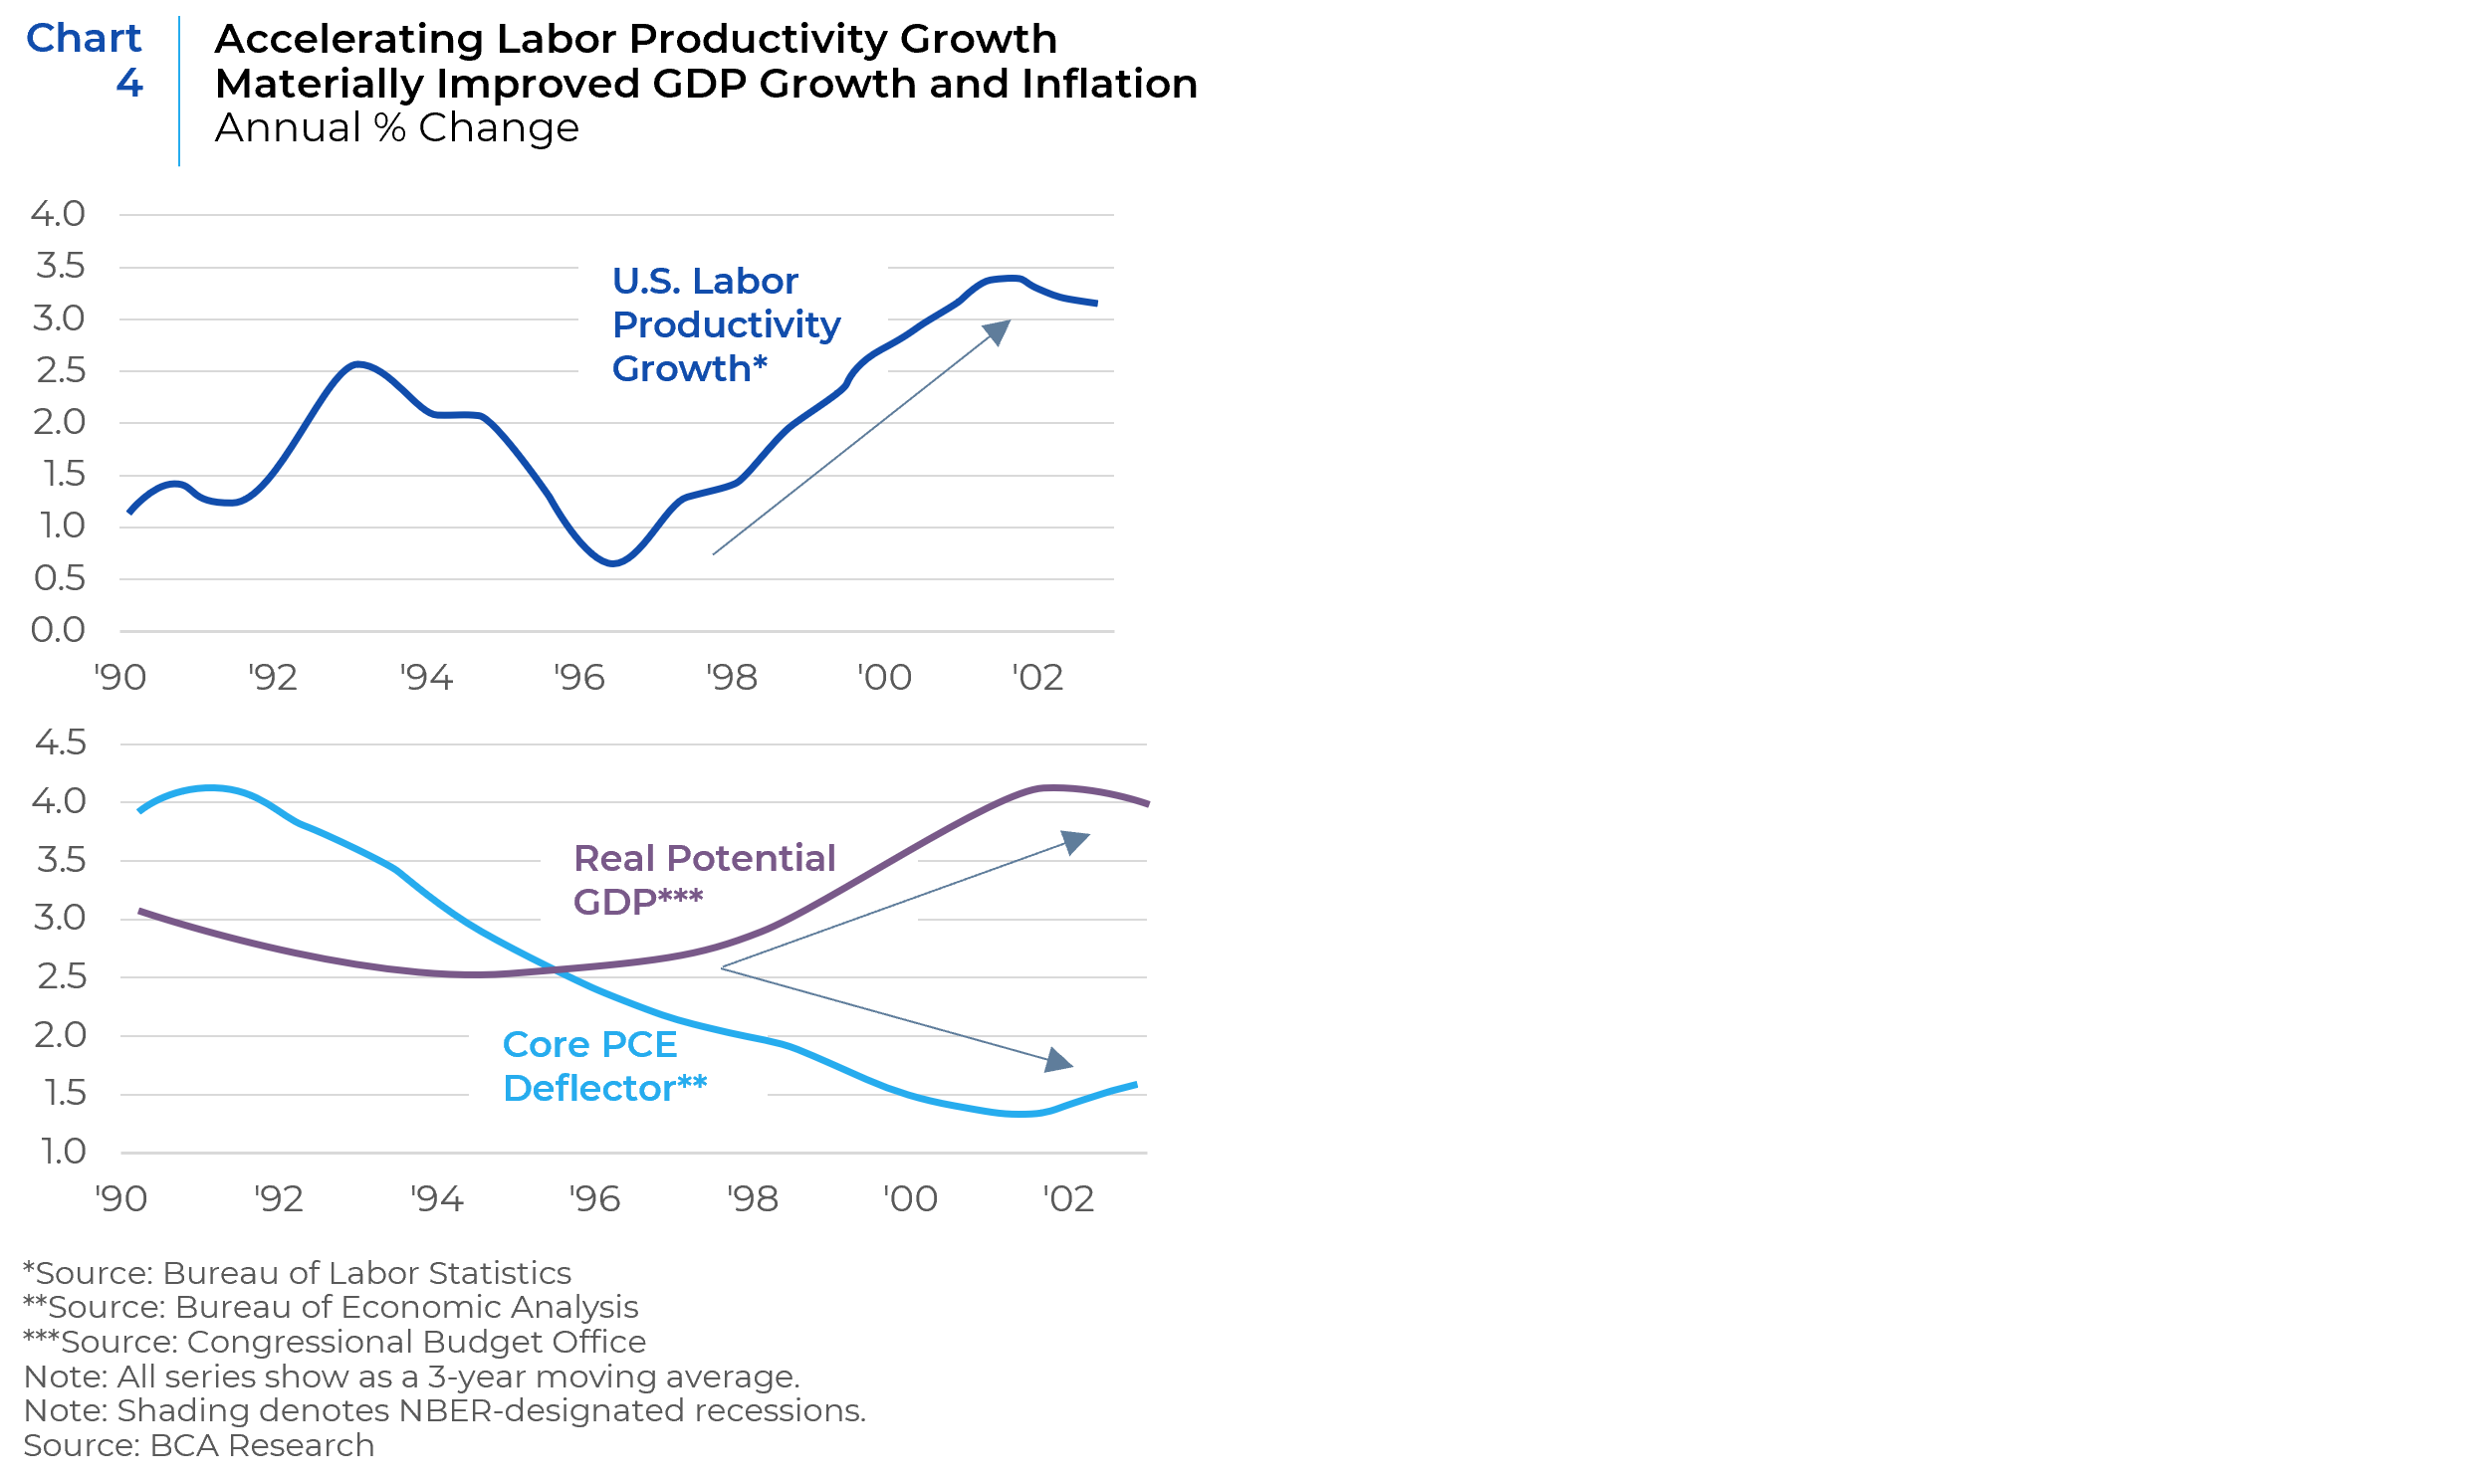
- Productivity. R&D spending during the Cold War era of the 1960s and 1970s and its subsequent availability for commercial use after Glasnost ushered in the computer age. In the 1990s, the combined effect of information technology, a marked increase in global research collaboration and computer processing speeds, as well as the internet, led to a marked pickup in total factor productivity (which measures changes in output per hour due to technological changes and returns to scale). Chart 4 highlights that US labor productivity surged to over 3% from 1995 to 2000, alongside a significant deceleration in core PCE inflation and a sizeable acceleration in potential GDP growth.
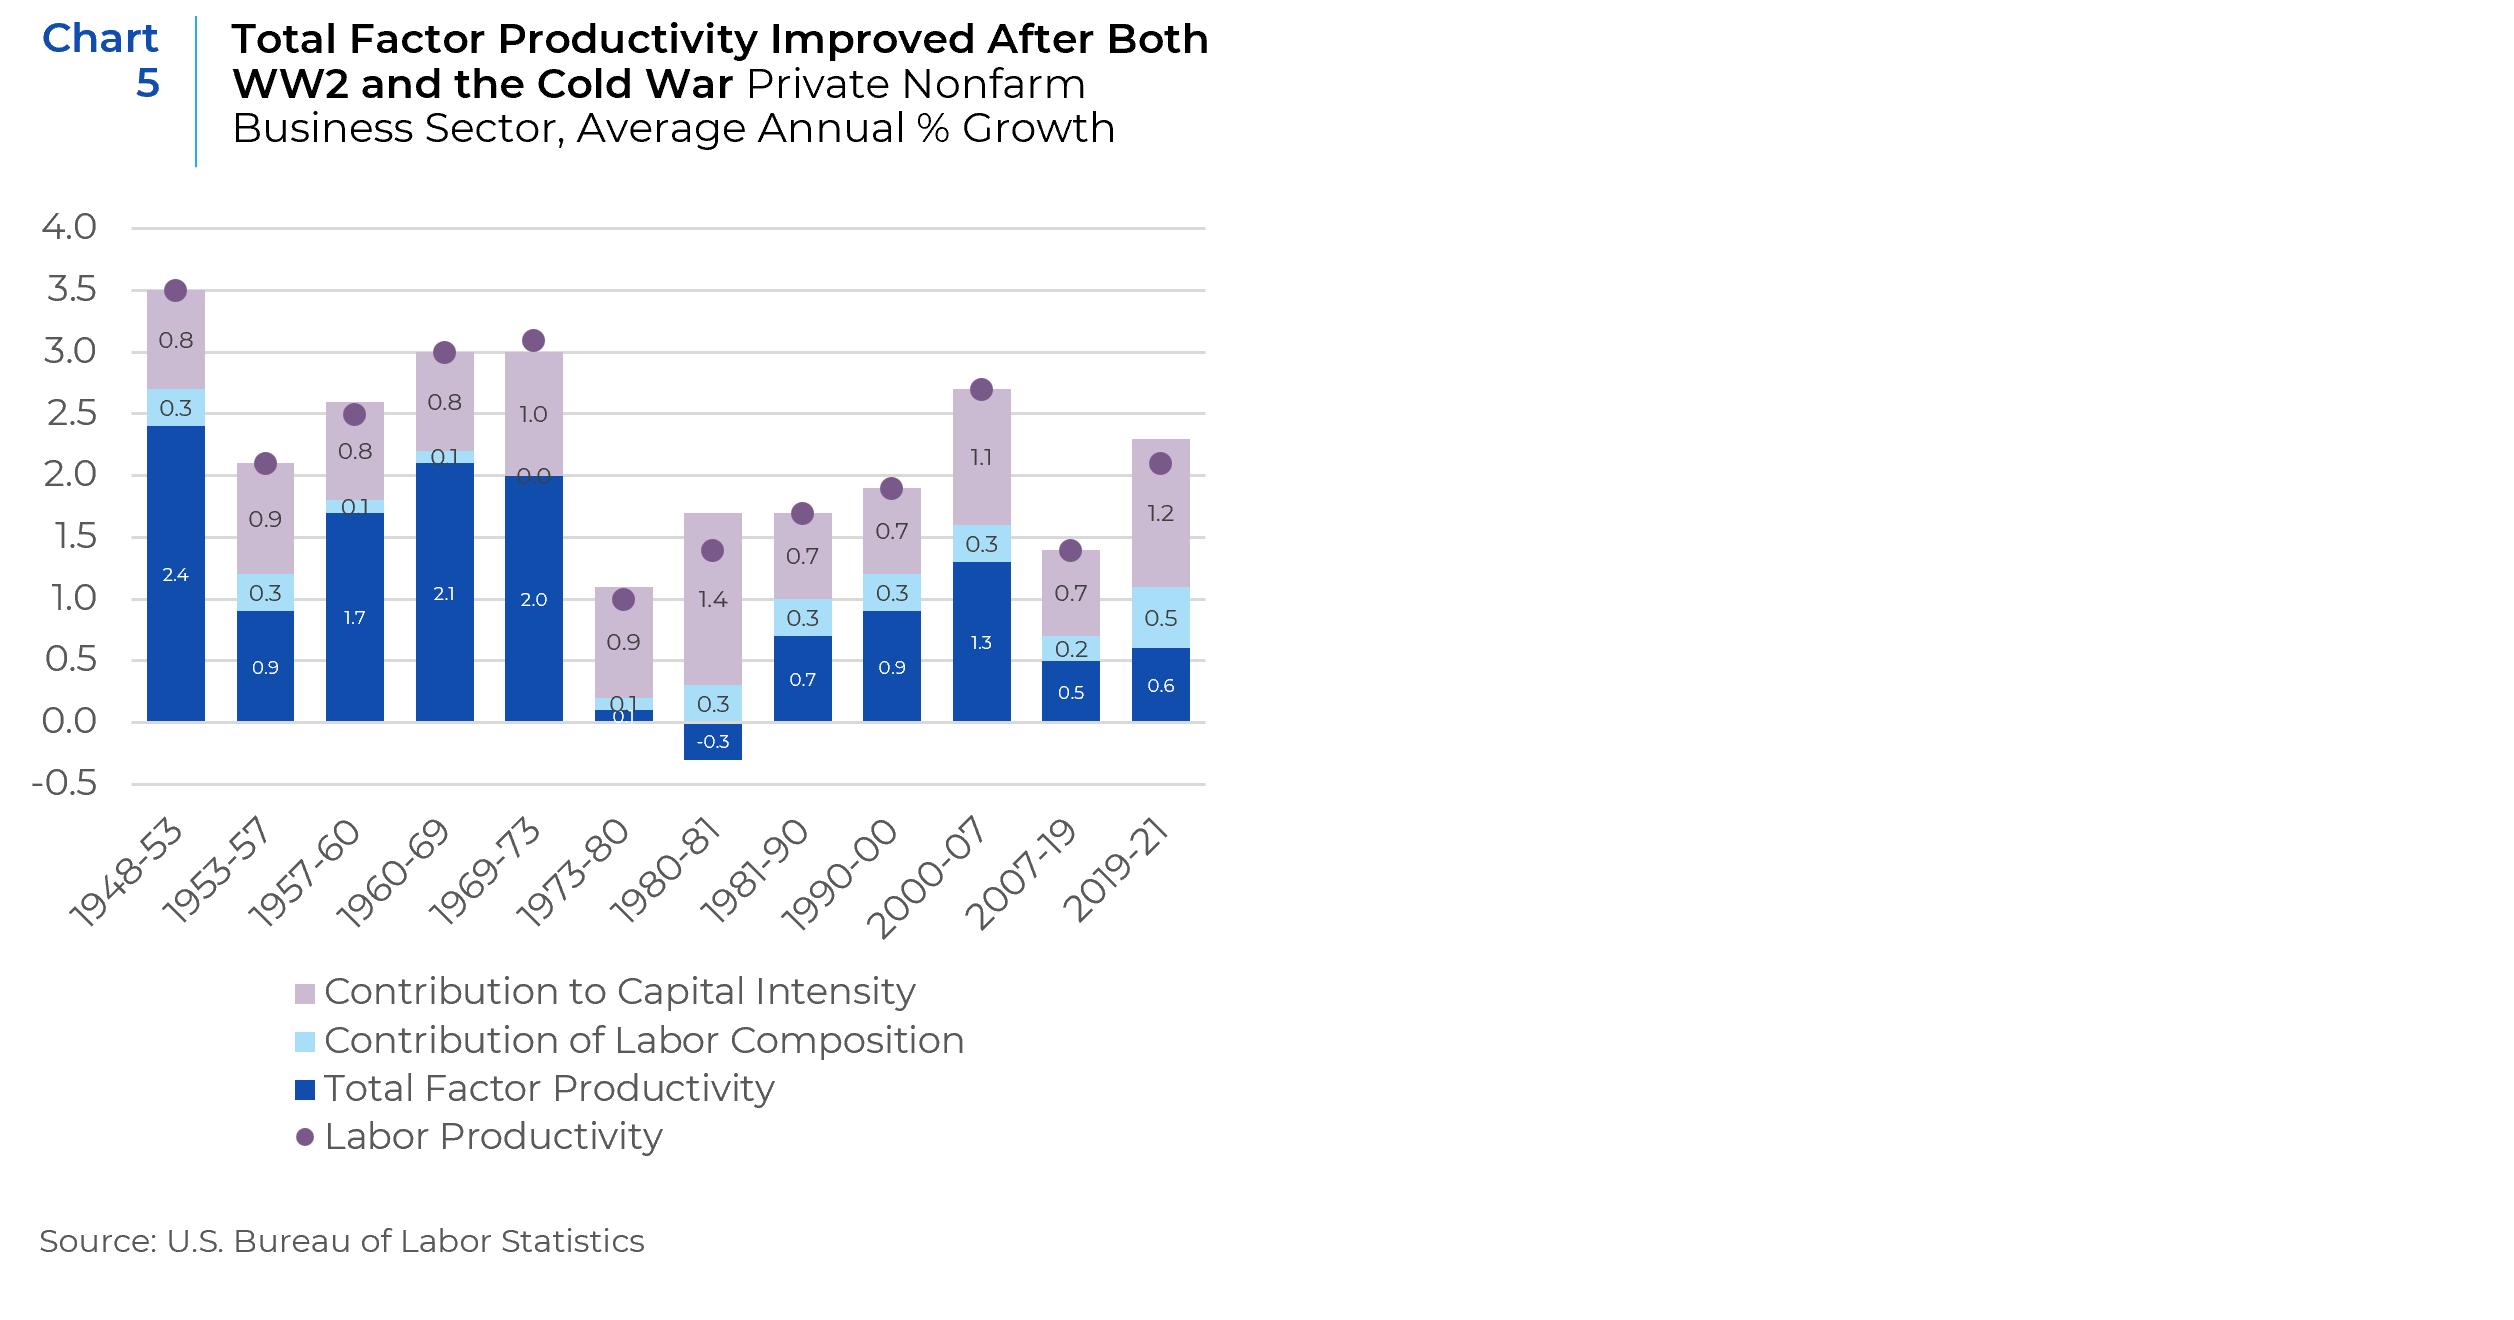
Productivity therefore represents a significant wildcard for future inflation and GDP growth. Since the GFC however, total factor productivity has been relatively subdued (Chart 5). During the pandemic, measured productivity accelerated; but most of the increase was attributable to capital intensity (due to a shift from service jobs to more capital-Intensive goods producing jobs) as well as shifts in labor composition, as the pandemic primarily impacted lower cost workers in the service industries. Unlike earlier periods of substantial productivity growth, total factor productivity barely budged.
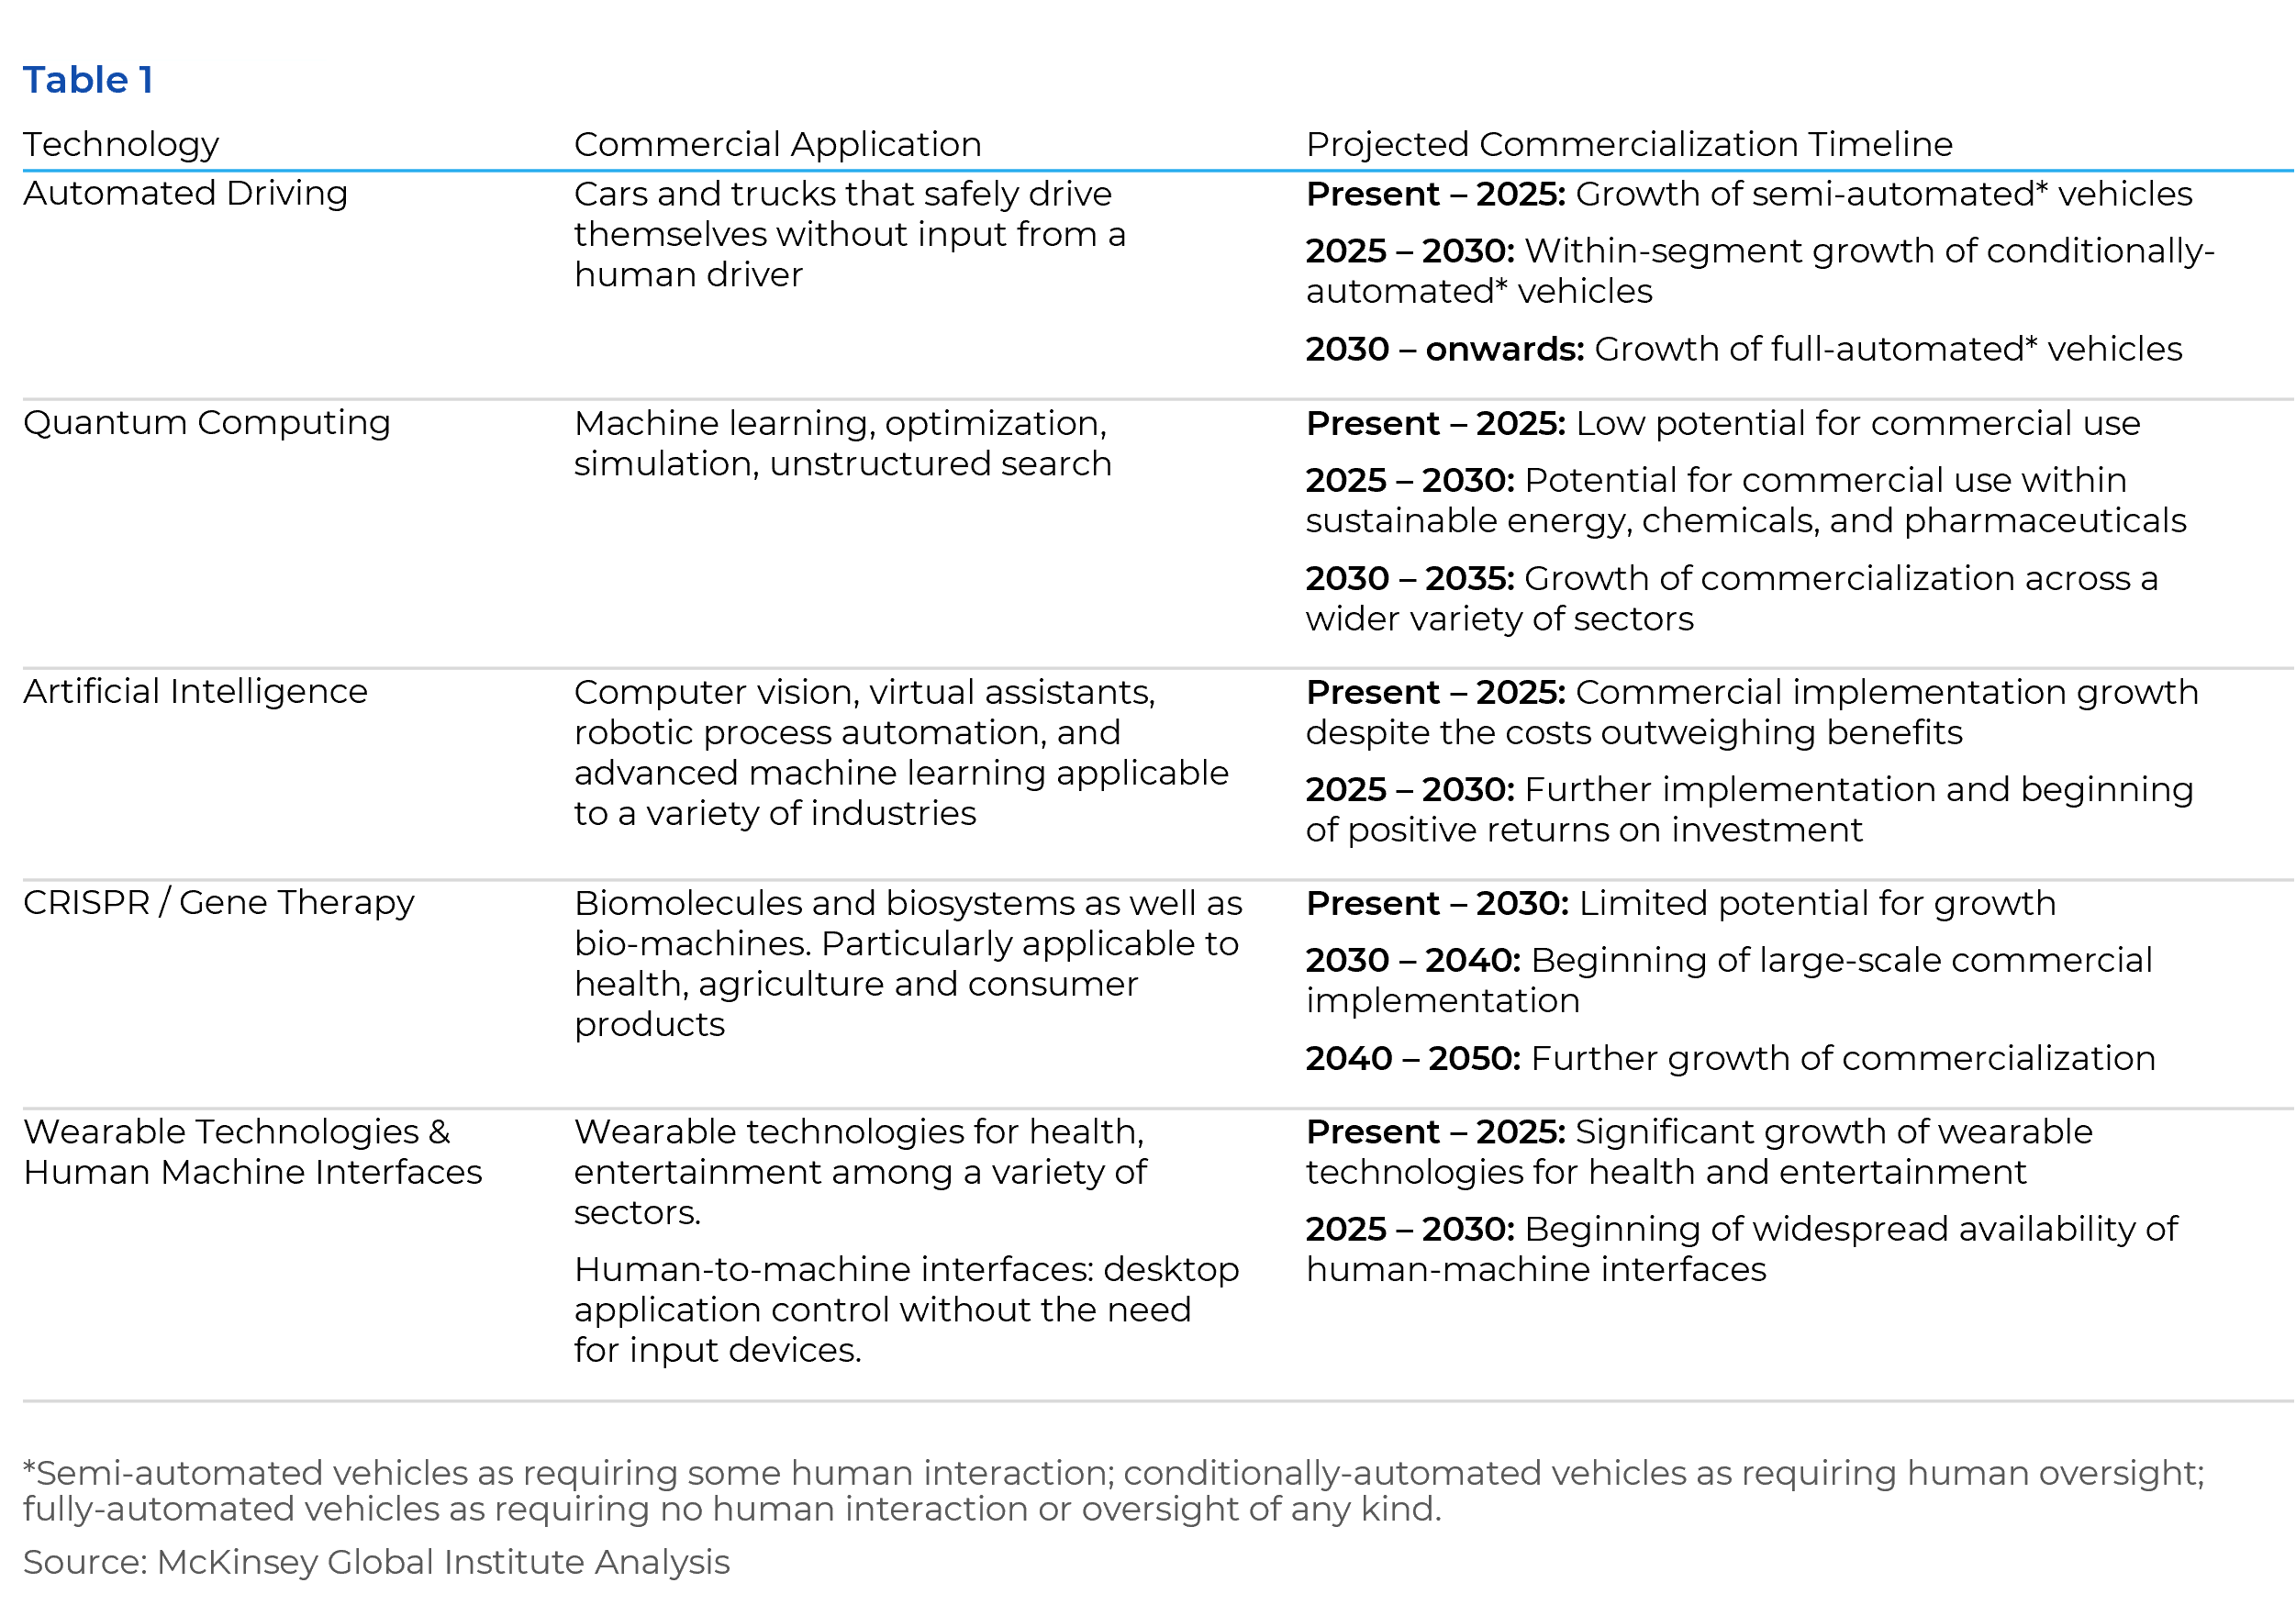
Over the long term, the outlook for technologically driven productivity growth could be promising; though projected commercialization timelines for several well-known technologies under development do not point to an imminent, inflation-offsetting boom in potential output. Table 1 illustrates promising technologies proffered by the McKinsey Global Institute. It is worth noting that some of these technologies, such as Automated Driving and AI, may require additional fiscal transfers to ameliorate their impact on employment and social stability, which could potentially reduce their inflation offset. This table also provides a useful roadmap for capital allocation, particularly for private and public equity portfolios. To this list we would add the capex required to rewire supply chains away from dependence on China and to transition to net zero while maintaining current supplies of energy sources.
In summary, the forces that subdued structural inflation are reversing and depending on the trajectory of productivity, this could lead to a core inflation baseline ranging between 3% and 4%. It is worth noting that such an outcome is not necessarily cataclysmic. During my stint as the CIO of a pension fund in the early 1990s, the discount rate used for pension liabilities or to build return assumptions ranged between 3% to 3.5%. The 2% threshold only became an explicit inflation target by the Federal Reserve in 2012. The evolution from an explicit 2% inflation target to one of “achieve(ing) inflation that averages 2 percent over time” by the Fed in 2020 was a response to structural transformations driven by disinflationary pressures arising from diminishing pricing power and globalization. A reversal of these drivers that leads to higher structural inflation should motivate an equal level of policy flexibility at the next review of its monetary policy framework. However, as with all regime shifts, the process for getting to a new normal will be imbued with uncertainty, volatility, and opportunity as markets continually re-appraise their assumptions and the credibility of the Fed, its central bank peers, and the dogma on which they stand evolve to embrace it. The times “they are a-changin”. But long-term investors have been here before and thrived in such an environment; it was just 30 years ago!
1 The San Francisco Fed defines acyclical inflation by determining whether inflation for individual industries responds to changes in overall economic activity to determine their sensitivity to business cycle conditions. If the industry’s inflation rate shows a negative and statistically significant relationship with the unemployment gap, they categorize the sector as procyclical. If not, they categorize the industry as acyclical.
This report is neither an offer to sell nor a solicitation to invest in any product offered by Xponance® and should not be considered as investment advice. This report was prepared for clients and prospective clients of Xponance® and is intended to be used solely by such clients and prospective clients for educational and illustrative purposes. The information contained herein is proprietary to Xponance® and may not be duplicated or used for any purpose other than the educational purpose for which it has been provided. Any unauthorized use, duplication or disclosure of this report is strictly prohibited.
This report is based on information believed to be correct but is subject to revision. Although the information provided herein has been obtained from sources which Xponance® believes to be reliable, Xponance® does not guarantee its accuracy, and such information may be incomplete or condensed. Additional information is available from Xponance® upon request. All performance and other projections are historical and do not guarantee future performance. No assurance can be given that any particular investment objective or strategy will be achieved at a given time and actual investment results may vary over any given time.