
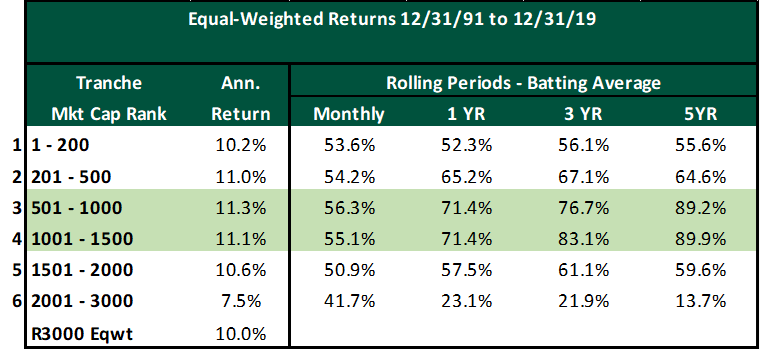
In our previous post, we sought to identify and quantify the investment opportunity or edge within various market capitalization segments. We found that the top 1000 names in the Russell 2500 benchmark constitute a sweet spot across the entire Russell 3000. As a reminder, we include the data that demonstrates this edge.
Why does this anomaly exist (and persist)? There are various theoretical and practical justifications:
- These medium-sized companies represent the “successful” small caps.
- Once a company reaches the $1-$5 billion capitalization range, their strategic options improve:
- Balance Sheet flexibility – Financing options improve as the cost of capital decreases relative to small- or micro-cap stocks. Debt financing becomes a viable alternative.
- Economies of scale – Flexibility and scale to implement growth initiatives.
- Liquidity – The average trading volume is large enough for managers to commit to impactful position sizes.
- M&A – Larger firms seek to acquire smaller firms but favor those that can meaningfully impact the P&L of the larger firm.
- Good data – While mega cap stocks may be viewed as an efficient market segment from a valuation and analysis perspective, and small caps are viewed as highly inefficient, the SMid segment combines the best of both worlds: plentiful data and investment opportunity.
As shown below, the “Sweet Spot” is a popular fishing hole for M&A activity. While the mega-caps have the highest deal value when it comes to mergers and acquisitions, the number of transactions are small. On the flip side, the smallest capitalization stocks have the highest number of transactions but the smallest deal values. The “Sweet Spot” however has the best of both worlds – attractive deal value and number of transactions.
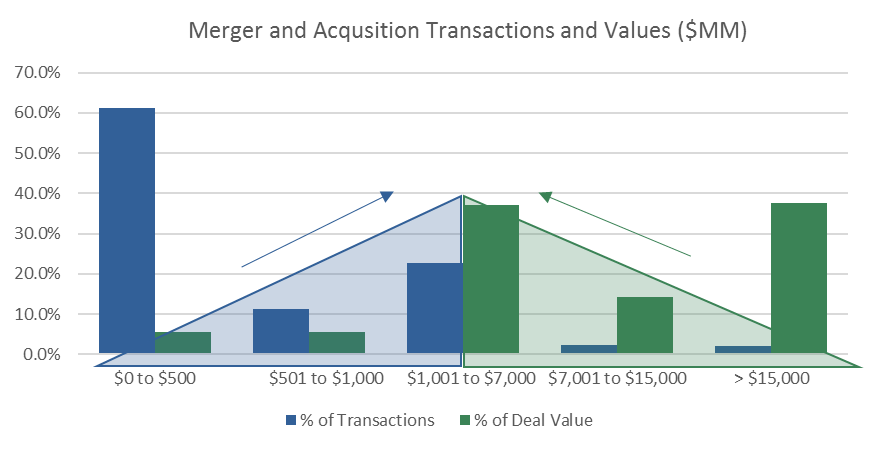
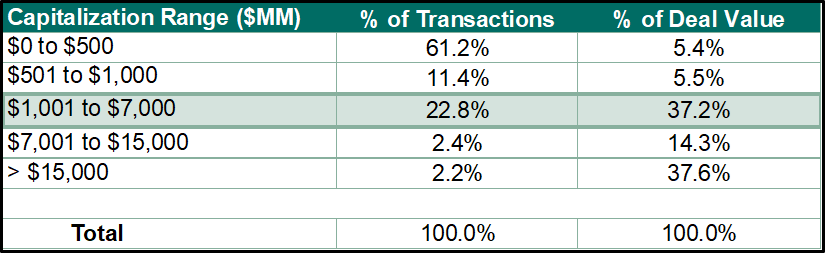
Source: Factset.
Universe – 3,838 US Public Merger Transactions – 12/02 to 12/19
The “Sweet Spot” adds a layer of quality and allows investors to reap the returns of small-cap investing while offsetting some of the risk. Adding a layer of medium-sized companies improves the quality of the blended group and improves liquidity for investors when compared with smaller names. These companies also tend to be less vulnerable to business downturns and macroeconomic slowdowns.
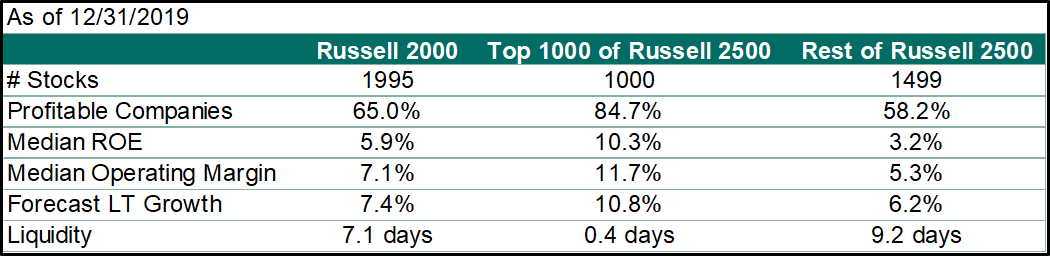
Liquidity represents the average of each stock’s 30-day average daily volume (ADV) required to invest $10MM (1% of a $1BN portfolio) in each holding.
The result of this analysis has informed our investment philosophy in the SMid (small and midcap) segment of the US equity market. We view this part of the market as the true “Sweet Spot” and anchor our strategy in this area. Most SMid strategies are benchmarked against the Russell 2500©, an index that covers stocks ranked 501-3000 by market value (our tranches 3-6). However, we note that the largest 1000 stocks in that index (i.e., stocks ranked 501-1500 in the Russell 3000©, our tranches 3 and 4) comprise 85% of the SMid benchmark by weight. A “tailwind” exists for those who recognize and are able to exploit this “Sweet Spot.”
In our next post, we update and expand on our analysis to explore the impact of rising and falling interest rates on the performance of the various capitalization tranches.