
While it is intuitively easy to understand that quality companies outperform in the long run, factors that fall in the Quality category often get less attention than the more popular Value and Growth factors. As we head into a slowing economy and possibly a recession amidst an inflationary environment, quality factors once again deserve the attention of investors. The first place to start would be with a definition of “quality.” Unlike standard factors, such as value, momentum, and size, “quality” lacks a commonly accepted definition. “Quality” as a factor in equity investing is a collection of metrics designed to capture the indicators of higher-quality financials in companies. What are the factors that fall into this category? The company attributes listed below are some of the most widely used measures of quality and tend to go hand in hand. We explore the behavior of these factors during periods of equity market weakness and recessionary periods.
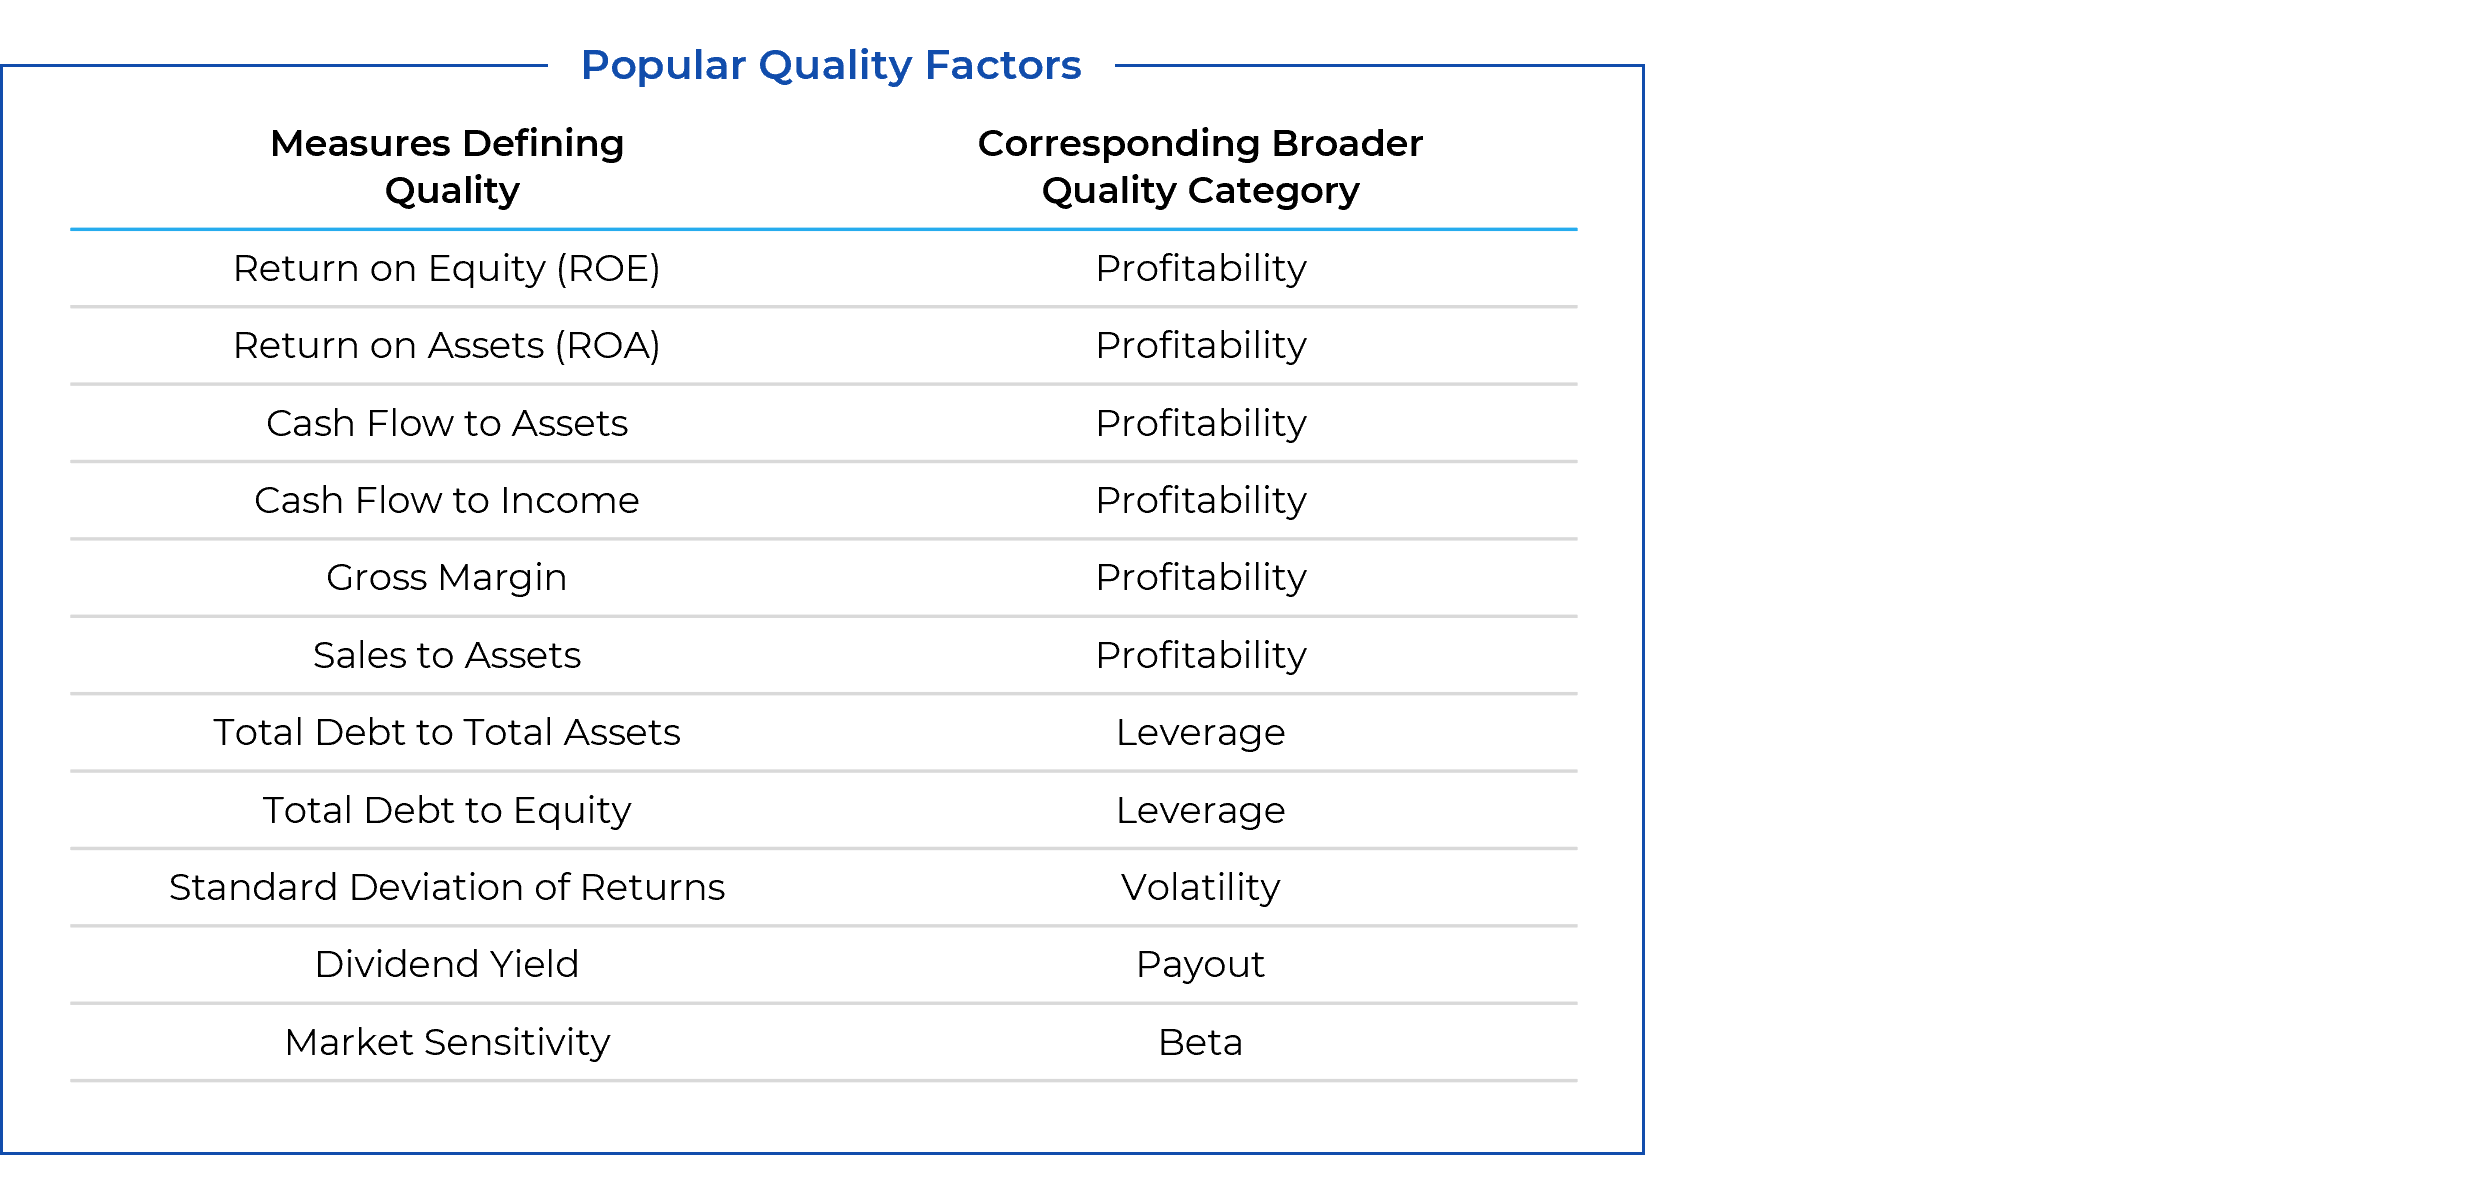
Profitability, Leverage, Volatility, Dividend Yield and Market Sensitivity (Beta) were used in this analysis. The construction of these Axioma fundamental risk factors aligns with our definition of quality. Profitability is a linear combination of the return-on-equity, return-on-assets, cash-flow-to-assets, cash-flow-to-income, gross margin, and sales-to-assets descriptors. Leverage provides a measure of a company’s debt to assets and debt to equity exposures. Volatility gives a measure of a stock’s relative volatility over time according to its historical behavior. Market Sensitivity (Beta) is a measure of a stock’s performance relative to that of the overall market, based on historical data. The performance of these three factors – Leverage, Volatility, and Beta – have been reversed to highlight the return to companies with lower Leverage, lower Volatility, and lower Market Sensitivity (Beta). Dividend Yield is the sum of the dividends paid (excluding non-recurring, special dividends) over the most recent year, divided by the average total issuer market capitalization computed over the last thirty calendar days. All these factor returns are representative of the return to a long-short portfolio with unit exposure to the factor in question, and no exposure to any other model factor.
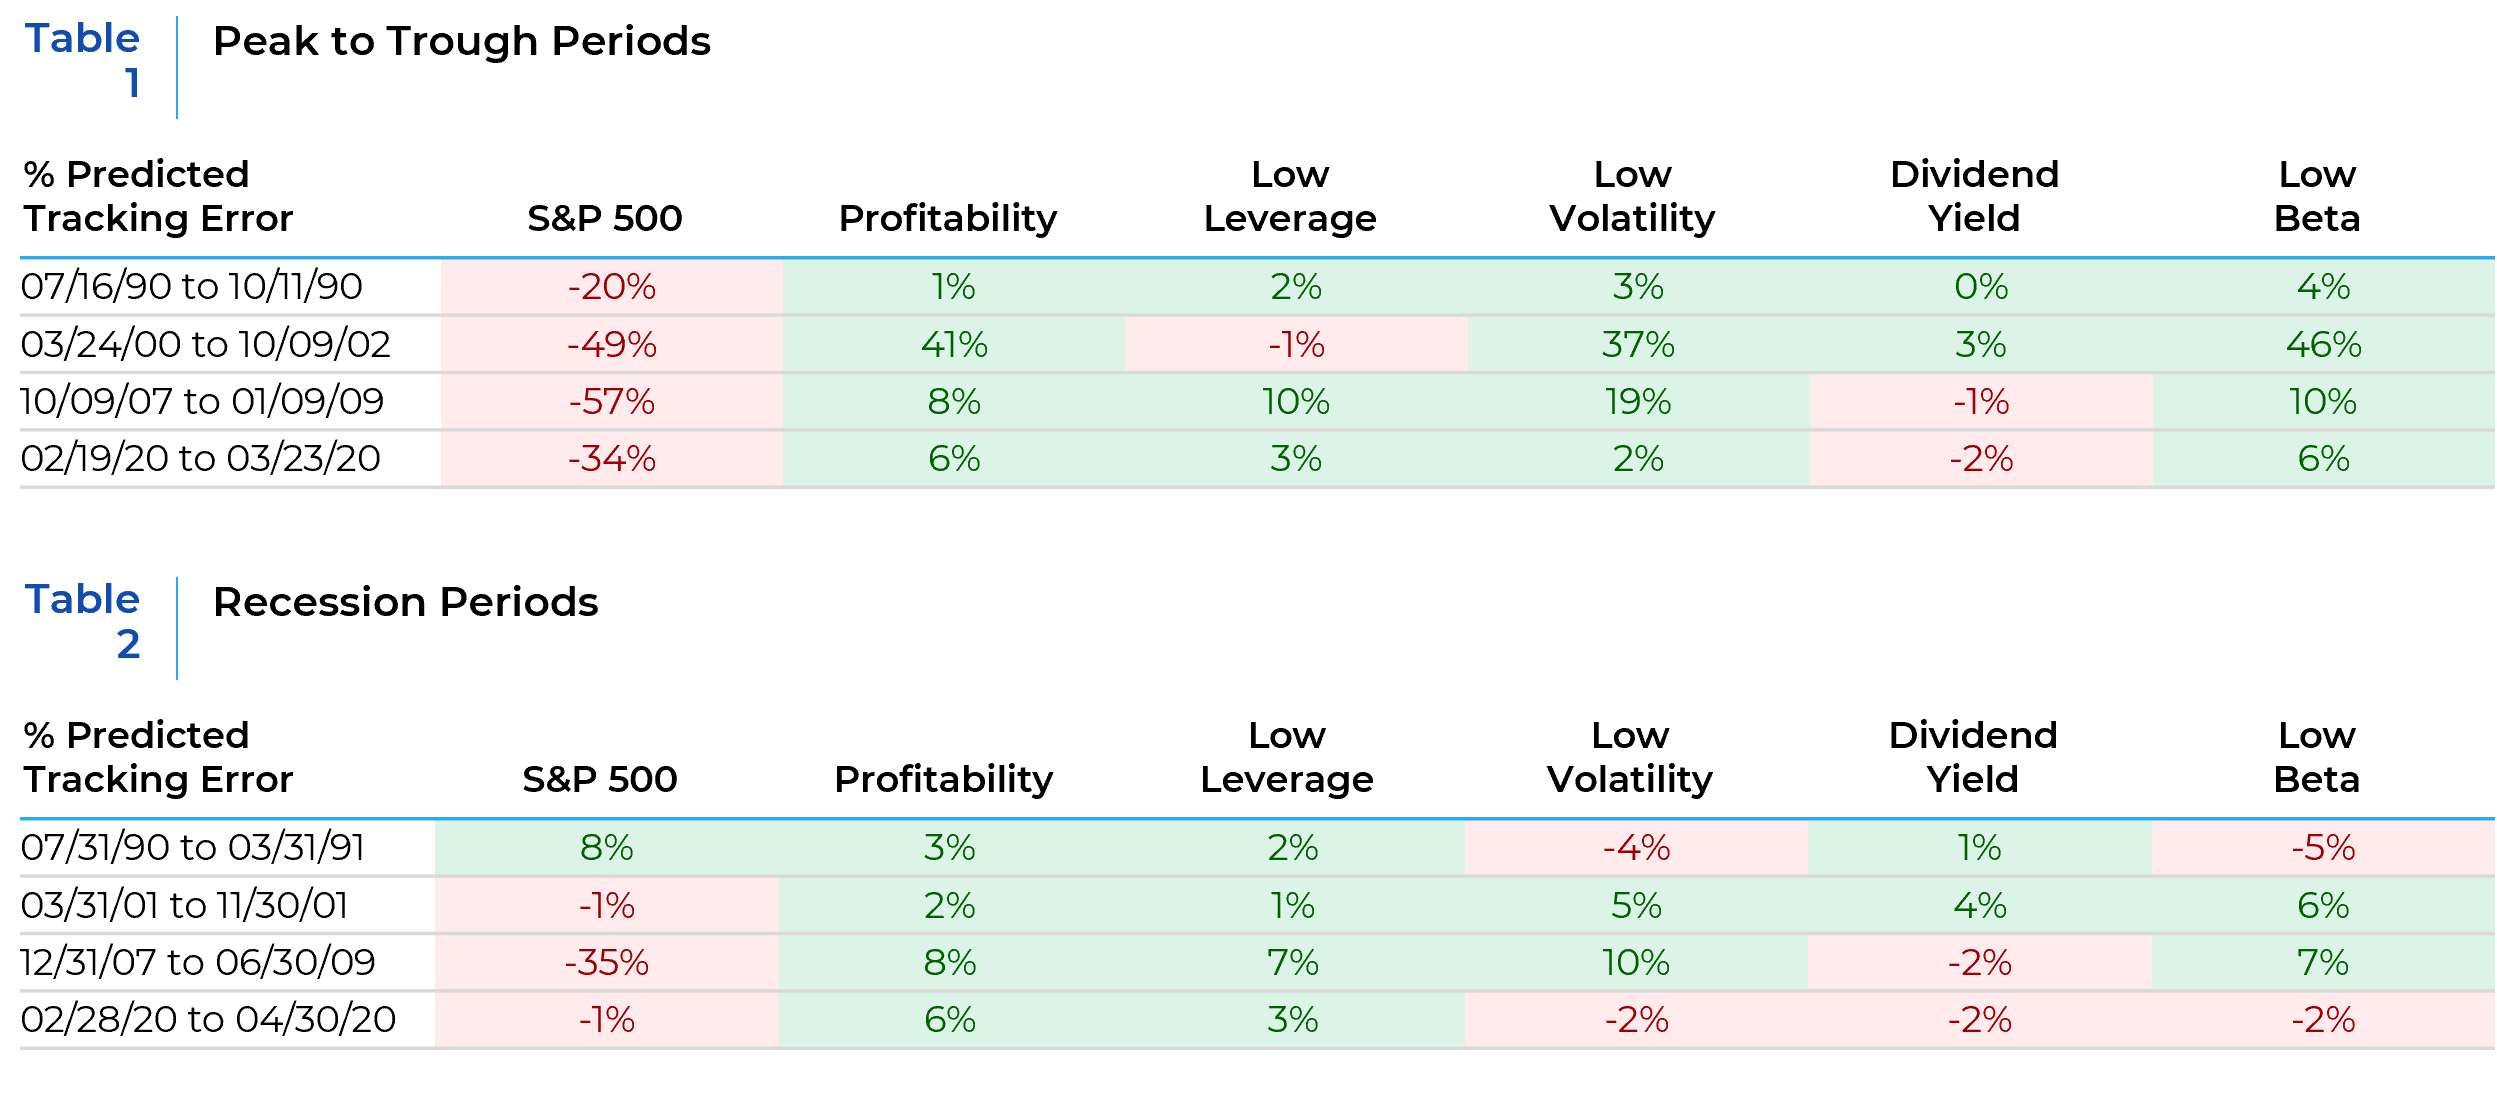
The tables (Table 1 and Table 2) above show how the S&P 500 and the quality factors listed earlier performed in bear markets (Peak to Trough) and recessionary periods since 1990. The S&P 500 index return is included to highlight the performance of the equity market during these periods, which was mostly negative. The Axioma factor returns are constructed to show the absolute or long-short return to each factor. Therefore, they should not be compared directly to the S&P 500 index return but should be viewed as indicators of the direction of performance in stressed market environments.
The performance tables highlight that Profitability, Low Leverage, Low Volatility, and Low Beta exposure had positive returns during most of the Peak to Trough periods. Profitability and Low Leverage were also positive during all the recessionary periods, but the performance of Low Volatility and Low Beta was mixed. The performance of Dividend Yield was the least consistent of the factors considered.
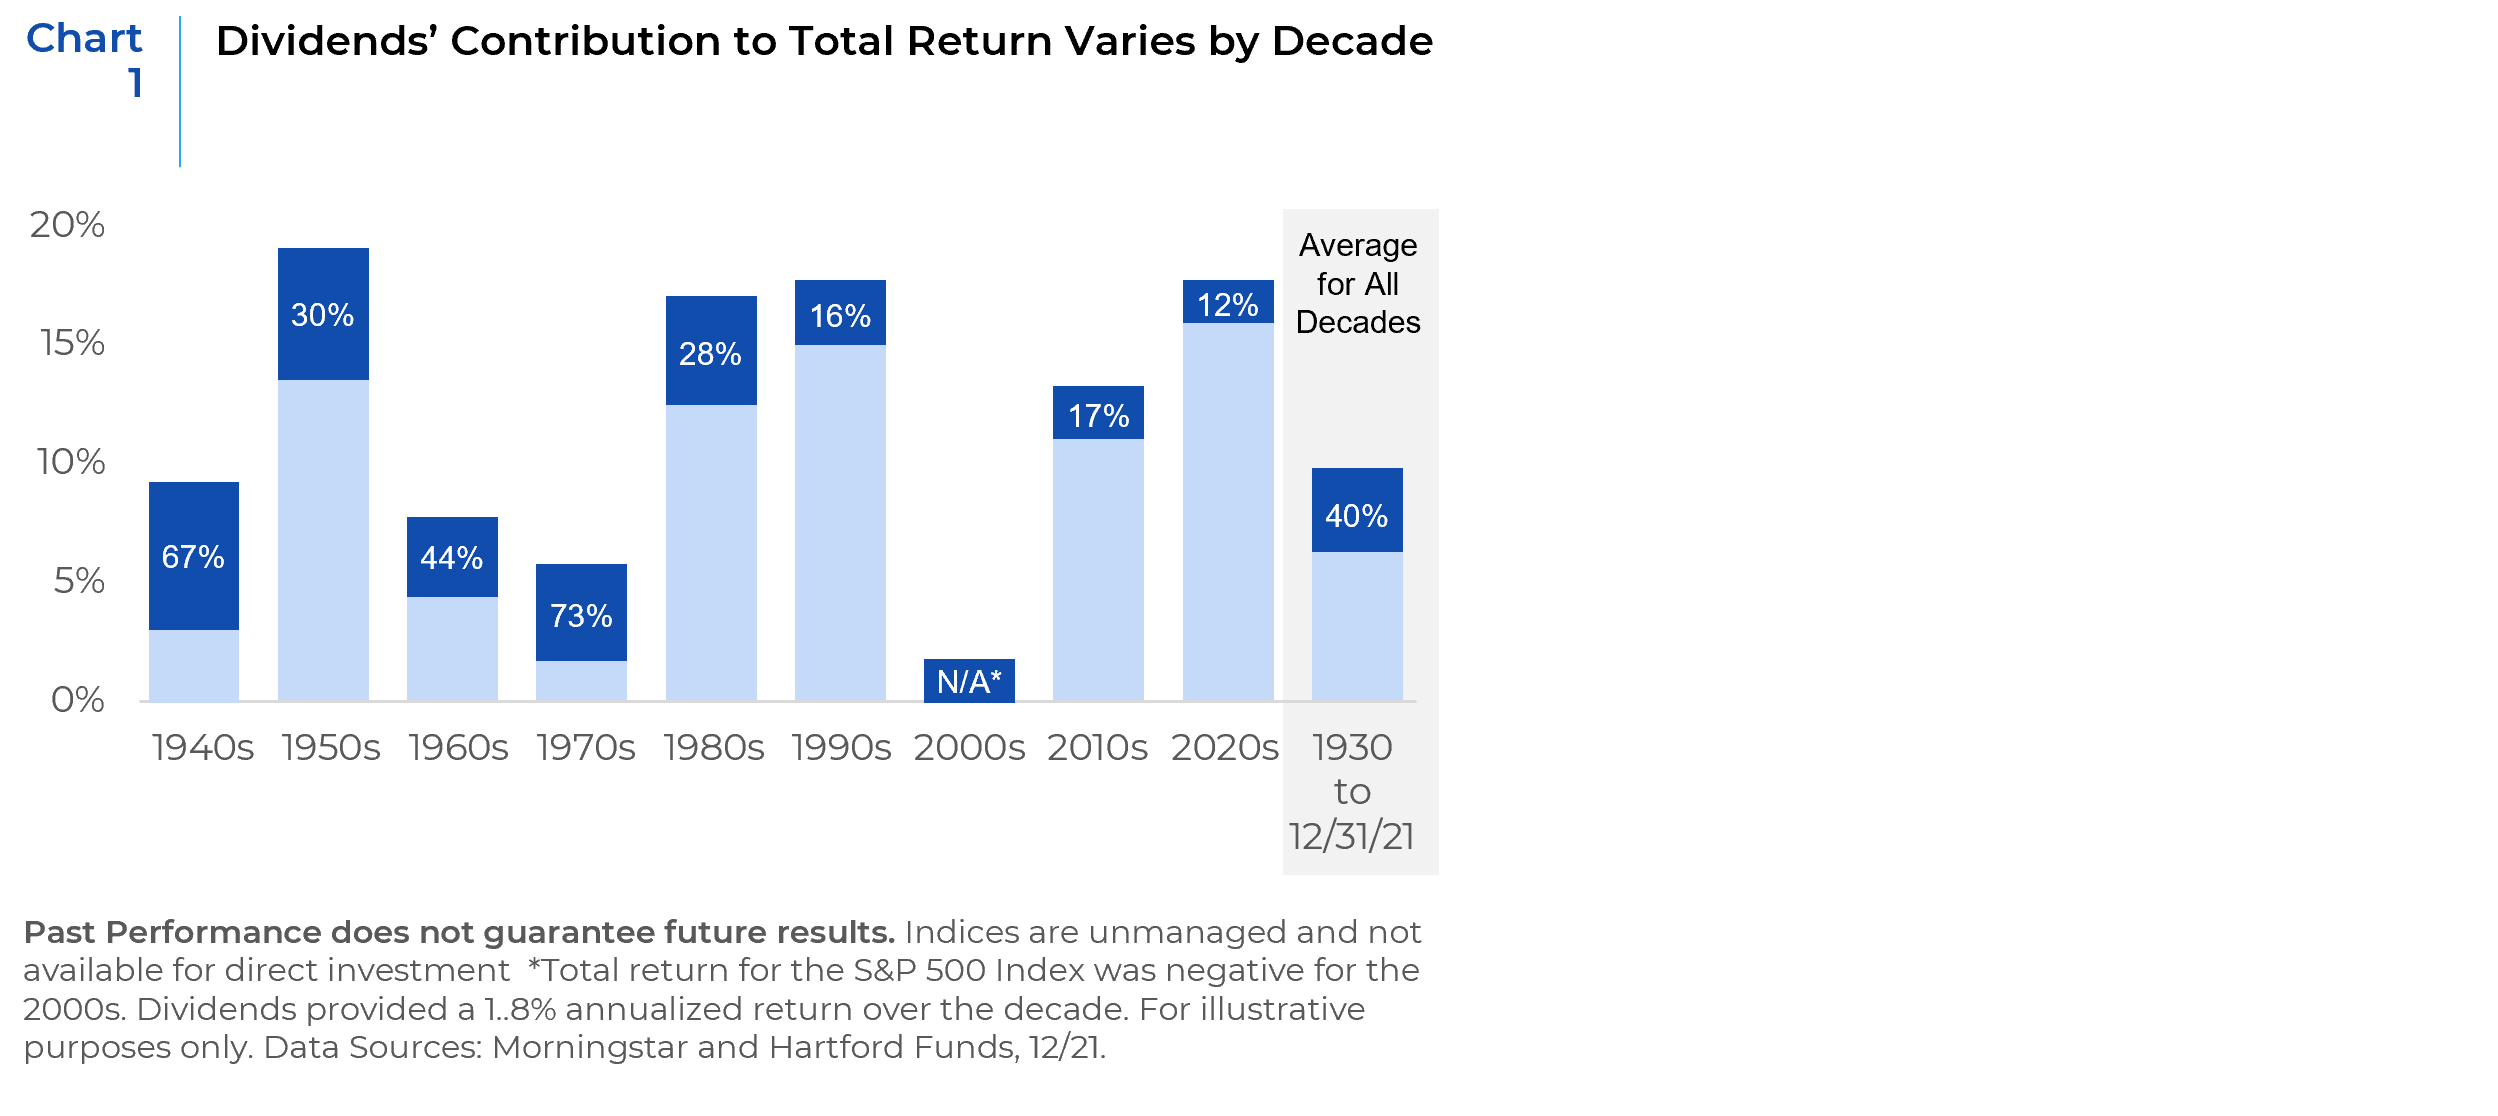
Profitability by far has the strongest performance among the five quality factors considered. This is not surprising as there is considerable academic research highlighting a positive premium associated with the characteristics of profitability. Companies that rank the highest on this factor have strong business models and a demonstrated ability to grow their cash flow over time by reinvesting back in their businesses while sustaining a high rate of return. These companies have barriers to competition that allow them to maintain high financial productivity longer than the market expects, which in turn makes them undervalued. Companies with low leverage also tend to perform well in bear markets and recessionary environments. The more conservative capital structure of these companies decreases the risk of financial stress and bankruptcy. They also enjoy strategic flexibility. If they ever need to borrow, the rate they pay should be relatively low. These companies also perform well during inflationary times when interest rates are rising. Since their debt servicing costs are low or non-existent, they also have greater flexibility to use cash flows to support growth or return capital in the form of dividends and stock buybacks. Companies with lower leverage also tend to have lower volatility and lower beta exposures as their operating performance is less likely to be impacted by changes in economic conditions. Many investors count on low volatility strategies to provide capital preservation during severe market downturns. These strategies have been generally able to deliver on this promise, for example during the debt crisis of 2008 and subsequent market downturns. The stocks that have the quality characteristics discussed here also tend to have less market sensitivity or low beta. In the end, a quality company is one that generates a lot of cash and reinvests it wisely so that it can defend and grow its competitive advantage. It is as simple and as complicated as that. The performance of Dividend Yield is mixed. Companies with high dividend yields and low debt ratios are expected to outperform in equity market environments marked by investor pessimism. In addition, dividend yielding stocks have inflation hedging potential. Dividends have accounted for 40% of stock market returns since 1930 and even higher during decades when inflation has been high (Chart 1). When inflation has been high, the stocks that have increased their dividends the most have outperformed the overall market. Dividend payments also may help make a stock’s total return less volatile. However, a caveat to buying high dividend yielding stocks is that a higher yield may be the result of a price decline resulting in a potential yield trap. Therefore, it is important, particularly during periods of economic distress, to incorporate other quality factors such as profitability and low leverage as indicators of a company’s ability to sustain and grow their dividends. The concentration within sectors and industries of high versus low or non-dividend paying stocks may also impact the performance of this factor during periods such as 2020 when growth stocks, many of which did not pay dividends, significantly outperformed.
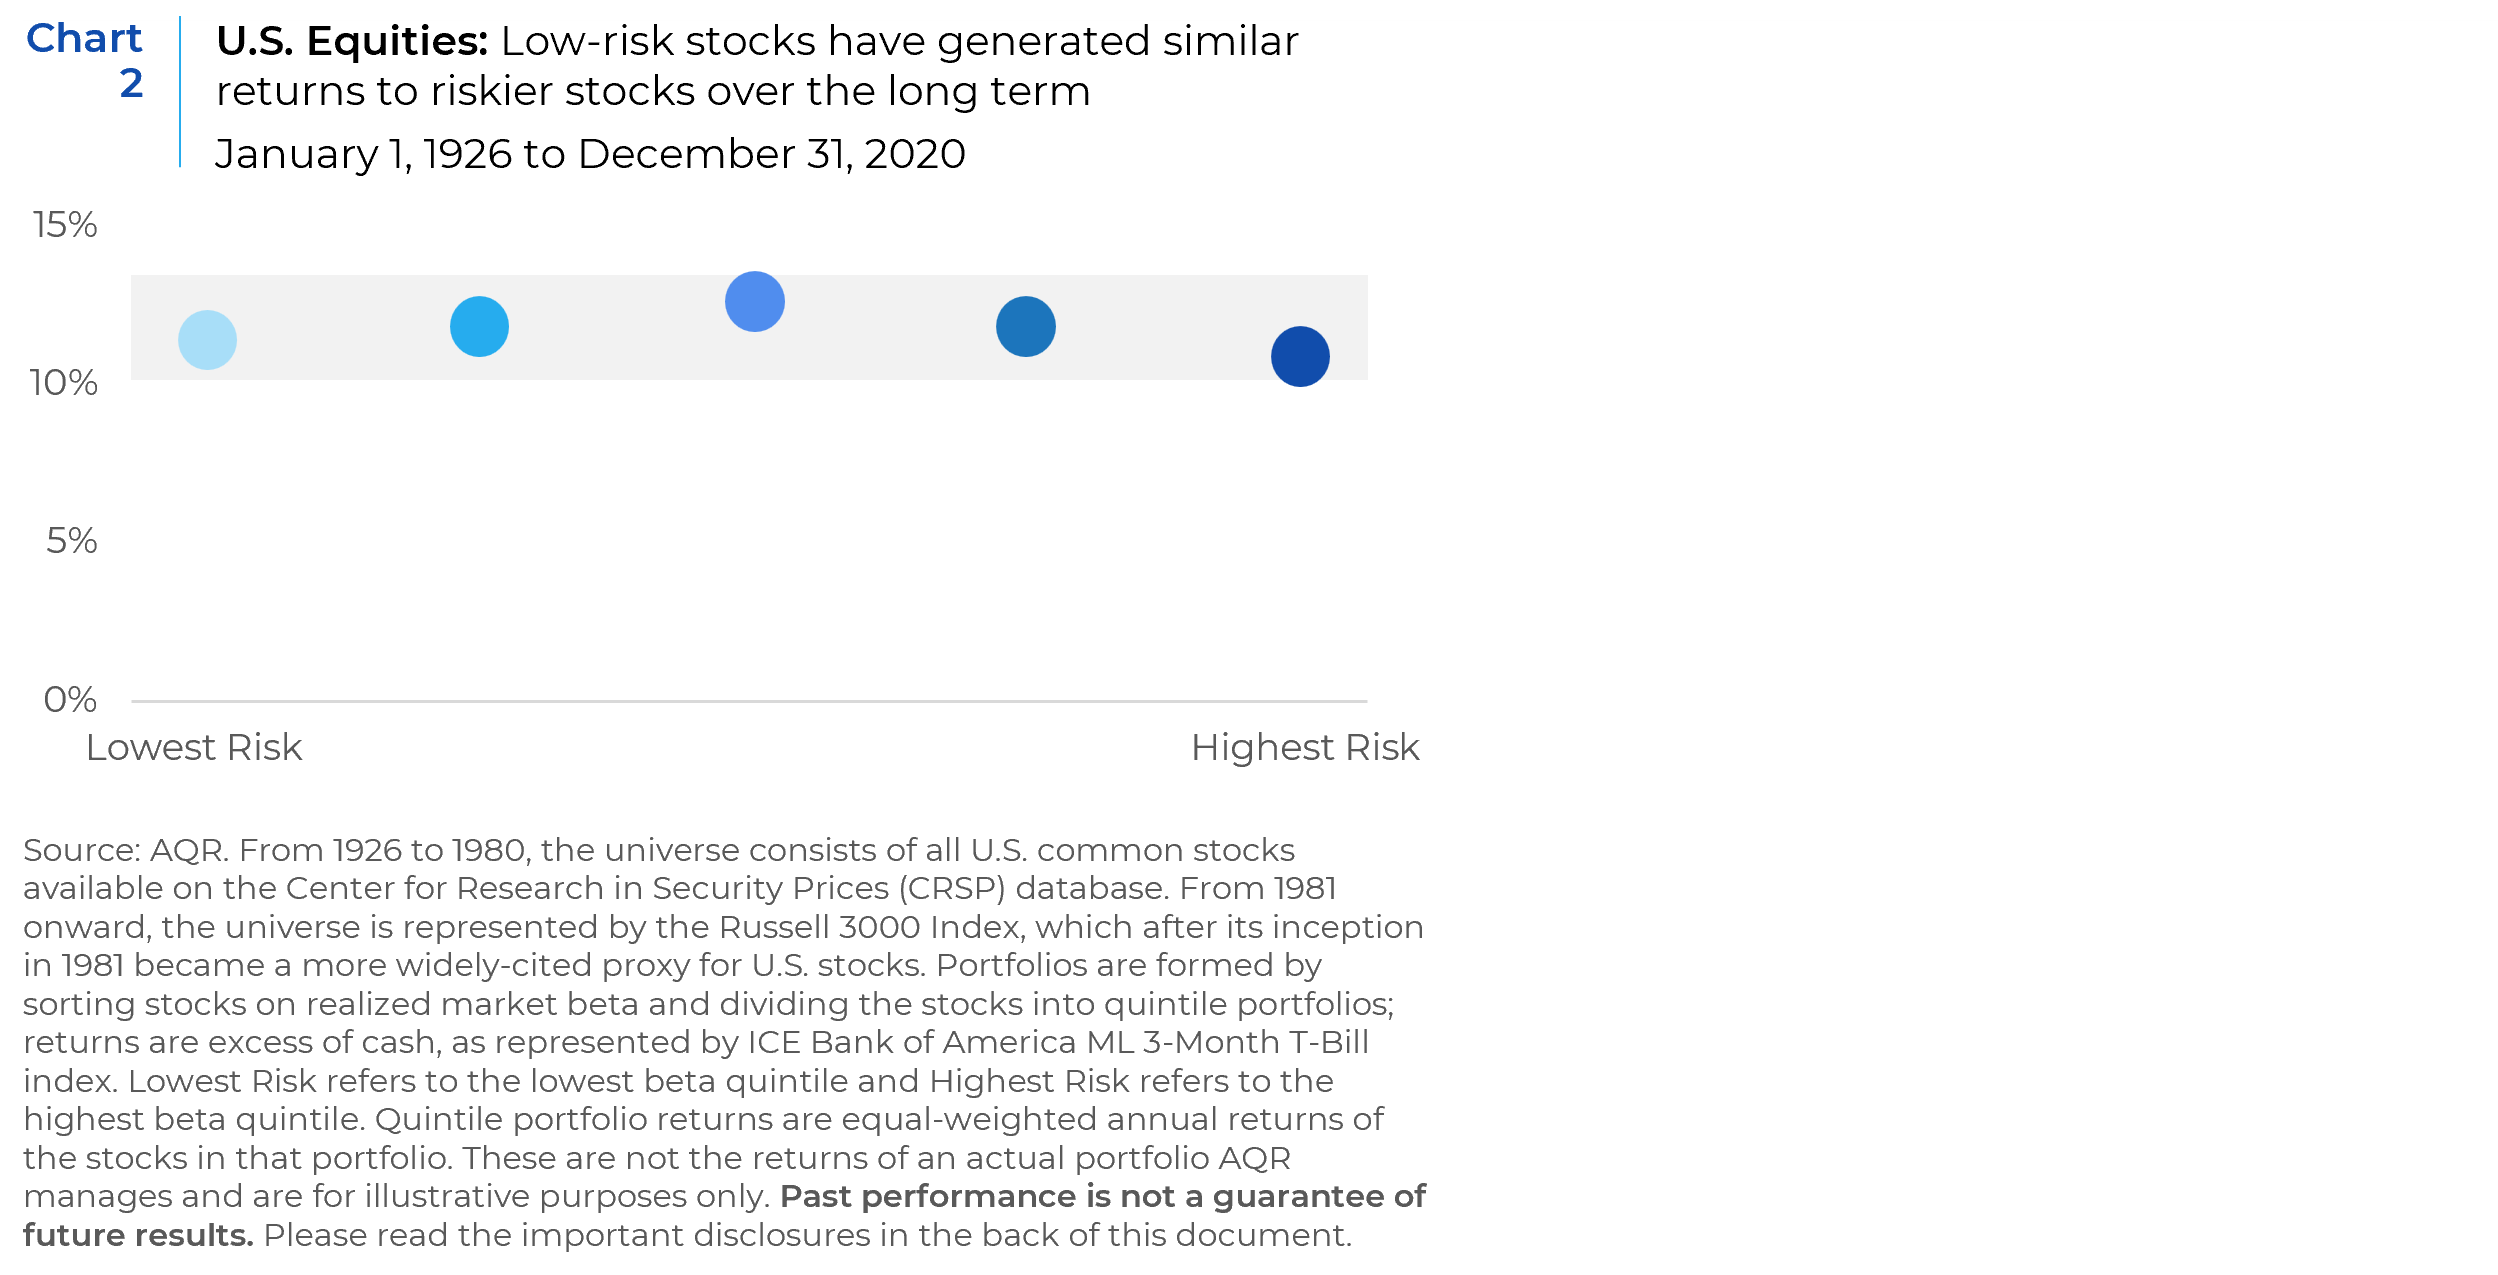
So far, we have highlighted the benefits of investing in quality factors during bear markets and recessions. However, research has also shown that tilting to quality allows equity strategies to perform consistently in a wide range of market environments. For example, these factors can be combined in a multifactor approach to create defensive strategies. Defensive strategies commonly target stocks of companies that are stable businesses that have demonstrated strong fiscal health, high profitability, and low leverage. Many of these stocks exhibit less volatility than their equity market counterparts and have the potential to produce higher risk-adjusted returns over a full market cycle than broader market indices. Conventional wisdom assumes that there is a tradeoff associated with investing: higher risk should lead to higher returns. However, that may not be the case always. Defensive equity strategies can deliver returns like traditional benchmarks but with lower volatility. The chart below (Chart 2) divides U.S. stocks into five groups from lowest risk (left) to highest risk (right) and compares the returns of each group over nearly a century. Low-risk stocks have performed similarly to riskier stocks over the long-term, suggesting that investors have not had to sacrifice significant returns when reducing risk in their portfolio.
References: Jason Hsu, Vitali Kalesnik & Engin Kose (2019) What Is Quality?, Financial Analysts Journal, 75:2, 44-61, DOI: 10.1080/0015198X.2019.1567194; AQR, An Investor’s Guide Defensive Equity.
This report is neither an offer to sell nor a solicitation to invest in any product offered by Xponance® and should not be considered as investment advice. This report was prepared for clients and prospective clients of Xponance® and is intended to be used solely by such clients and prospects for educational and illustrative purposes. The information contained herein is proprietary to Xponance® and may not be duplicated or used for any purpose other than the educational purpose for which it has been provided. Any unauthorized use, duplication or disclosure of this report is strictly prohibited.
This report is based on information believed to be correct, but is subject to revision. Although the information provided herein has been obtained from sources which Xponance® believes to be reliable, Xponance® does not guarantee its accuracy, and such information may be incomplete or condensed. Additional information is available from Xponance® upon request. All performance and other projections are historical and do not guarantee future performance. No assurance can be given that any particular investment objective or strategy will be achieved at a given time and actual investment results may vary over any given time.