
Market Review
Equity markets fell sharply for a third straight quarter in Q3, 2022. The big story for the quarter was the tightening of financial conditions driven by expectations for a more aggressive global rate hike cycle. The Fed was quick to push back after the market seemed to conflate peak inflation developments with a 2023 policy pivot that at one point even included the possibility of easing. Fed officials ratcheted up the central bank’s raise-and-hold and higher-for-longer messaging as the quarter progressed. Fed hawkishness was underpinned by higher-than-expected August core CPI data and the broad-based nature of its underlying components. Further support came from a still tight labor market, which Fed Chair Powell noted at his September FOMC press conference, had only shown modest evidence of cooling off. While the quarter started with an optimistic July when markets posted strong positive returns, the optimism quickly faded in August amidst all the uncertainty related to inflation and recession, and that in turn led to the quarter ending on a sour note after a negative September. By quarter end, worries that tighter financial conditions in combination with liquidity issues were leading to meaningful stress and setting the stage for “something to break.”
Market Outlook: The Path of the Fed
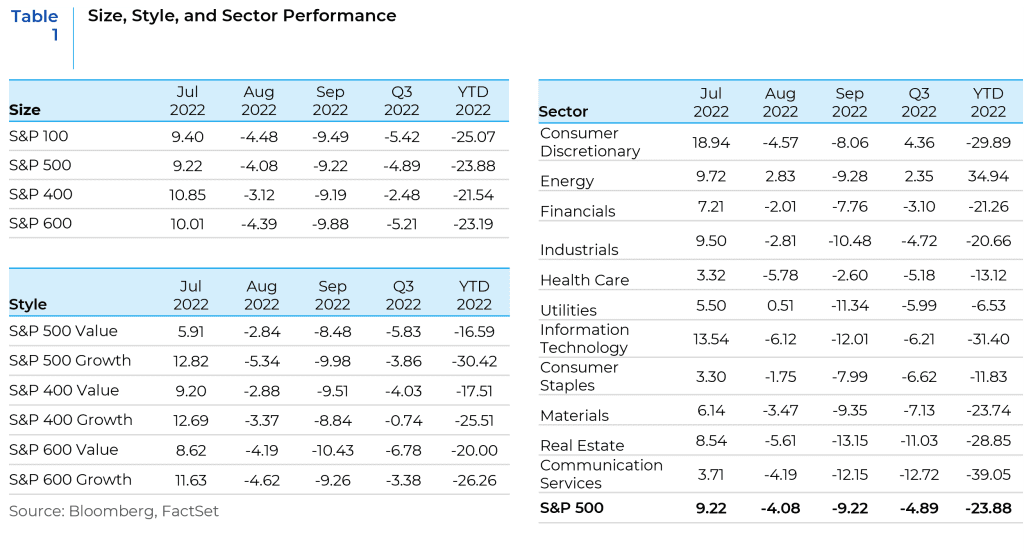
At the September meeting, Fed officials hiked the fed funds rate by 75 basis points and committed to do whatever it takes to battle inflation. Looking ahead to the remaining meetings in 2022, the rate path forecasts imply another 75-bp hike is likely in November, before the pace slows to 50 bps in December as the Fed nears a terminal rate in early 2023. Given tighter financial conditions and a higher fed funds rate, the path to a soft landing continues to narrow and the probability of a recession in the next 12 to 24 months has gone up significantly (Chart 1). Looking further out, while the Fed was clear that it is willing to accept the near-term economic costs of bringing inflation down, most Fed officials were also forecasting rate cuts starting in 2024, as lower inflation and a higher unemployment rate would require easing the policy rate back to neutral in order to balance the trade-off between battling inflation and accommodating growth.
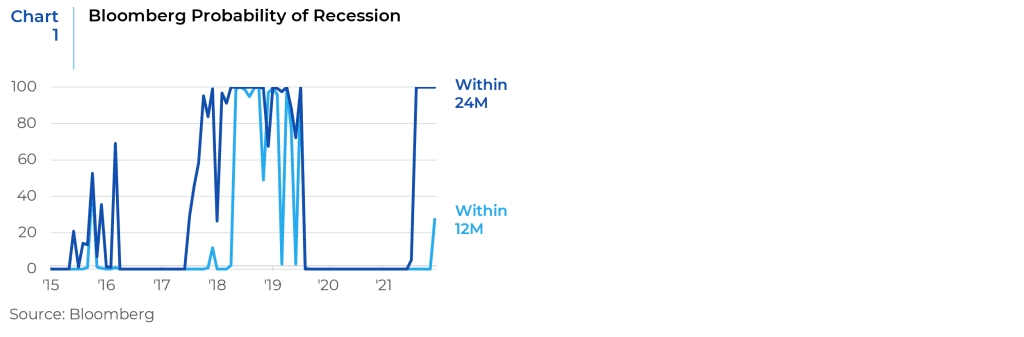
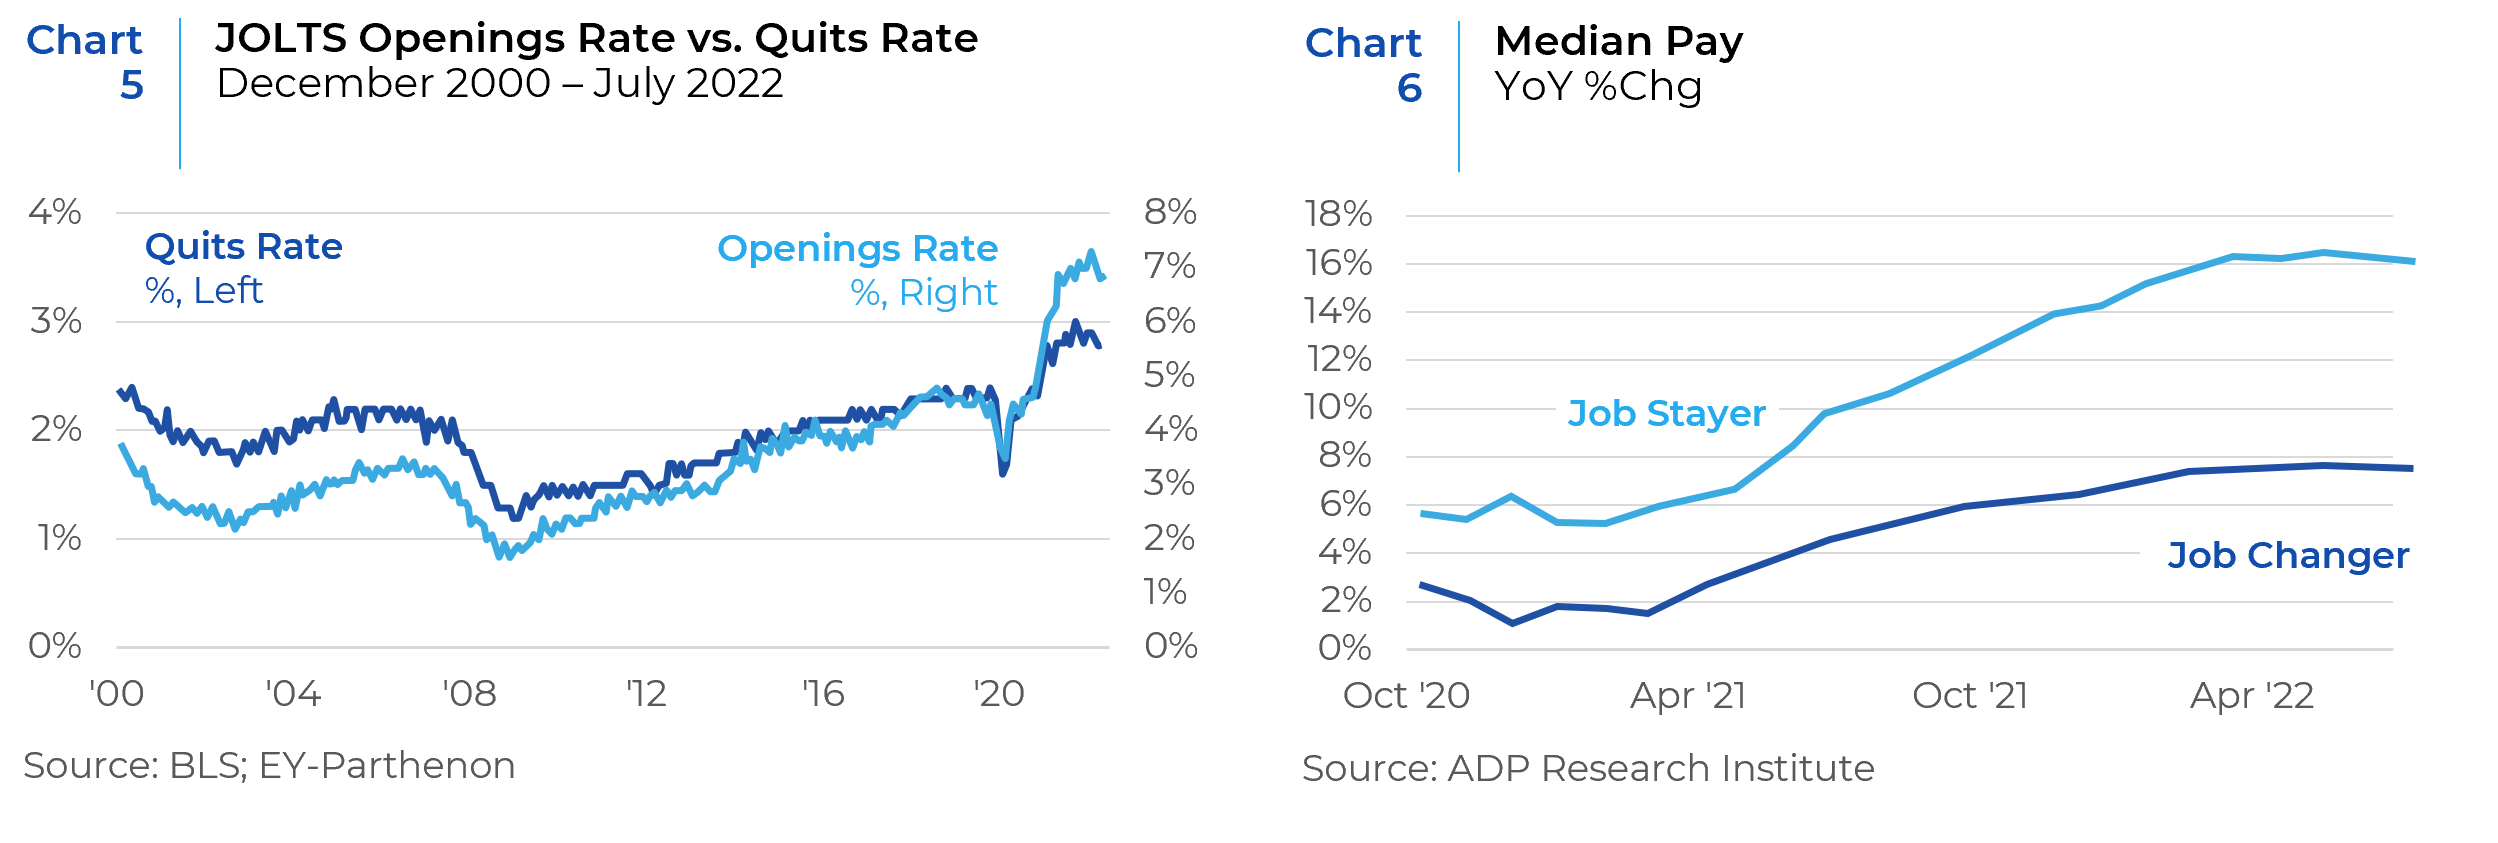
The inflation picture has worsened in the past few months and has become more broad-based and entrenched. While energy prices have moderated, food and shelter costs have continued to climb. In addition, economic activity data indicates that growth reaccelerated after a weak patch in May and June and that the labor market continues to remain resilient. Inflation peaked at 9.1% in June, as measured by the 12-month change in the US consumer price index. But it has failed to come down as quickly in recent months as Fed officials had hoped: In August, it was still 8.3% (Chart 2). Job growth, meanwhile, has remained robust and the unemployment rate, at 3.7%, is still below levels considered to be sustainable in the longer run. The demand for workers still exceeds the available supply, and wages are rising at more than 6% a year (Chart 3). The failure of the labor market to soften has added to the impetus for a more-aggressive tightening path at the US central bank. Therefore, in the trade-off between the fight against inflation and supporting a weakening economic outlook, the former seems to be winning. At this point, all good news is bad, because the stronger the economic data the more the Fed’s need to raise rates and control inflation.
Tail Risk
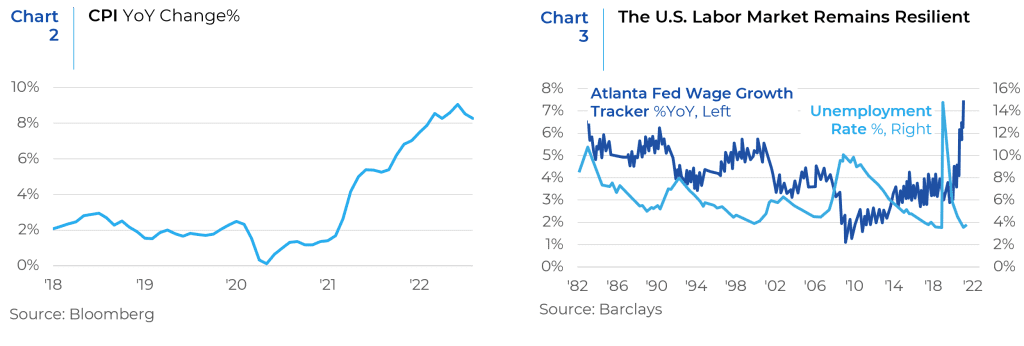
The leading tail-risk potential is the increased odds that inflation remains stubborn, and the Fed continues to fight it aggressively. Based on implied market expectations, investors are betting that inflation will revert to normal next year and the Fed will promptly ease its policy measures. The tail risk is that inflation proves sticky, and the Fed maintains a heavy foot on the financial brakes and markets continue to trend lower. There is anxiety among Fed members that the low inflation era may be ending. If so, a new, high inflation regime and behaviors that accompany it will likely spell more restrictive Fed monetary policy. Unlike the 1970s and early 1980s, when debt levels were low and equity valuations cheap, today’s environment is the opposite. Today’s economy relies heavily on debt for consumption and to roll over maturing debt and avoid bankruptcy. High-interest rates will be exponentially more damaging than they were 40 years ago. Chart 4 shows the CAPE valuation hit a level of 6.64 in the early 1980s. Today, the CAPE stands at 28.90, about 50% above the historical average. The risk to investors of a normalization of valuations is significant.
Crushing high inflation immediately before it becomes persistent will take harsh measures, but it may be the best action given the nation’s financial vulnerability. If policymakers fail at the task and let high inflation persist, there will be much bigger problems. Once people think that high inflation is permanent, their behaviors change. As prices rise, workers demand higher wages, companies raise prices to compensate, and this goes on in a vicious circle. Chart 5 and Chart 6 point to a very tight labor market.
Persistently high inflation is the tail risk that few investors appreciate. If inflation remains persistent, markets will realize that the Fed needs to raise rates beyond 4.6% and possibly keep them there well beyond 2023. That will result in more drawdowns in asset prices. One mitigating factor to this risk may be the Fed’s adjustment of the target inflation rate to something that is slightly higher and more realistic. A 2% target inflation rate in today’s world may need to be adjusted upward to strike the right balance between growth and recession and to prevent a hard landing.
Glimmers of Hope
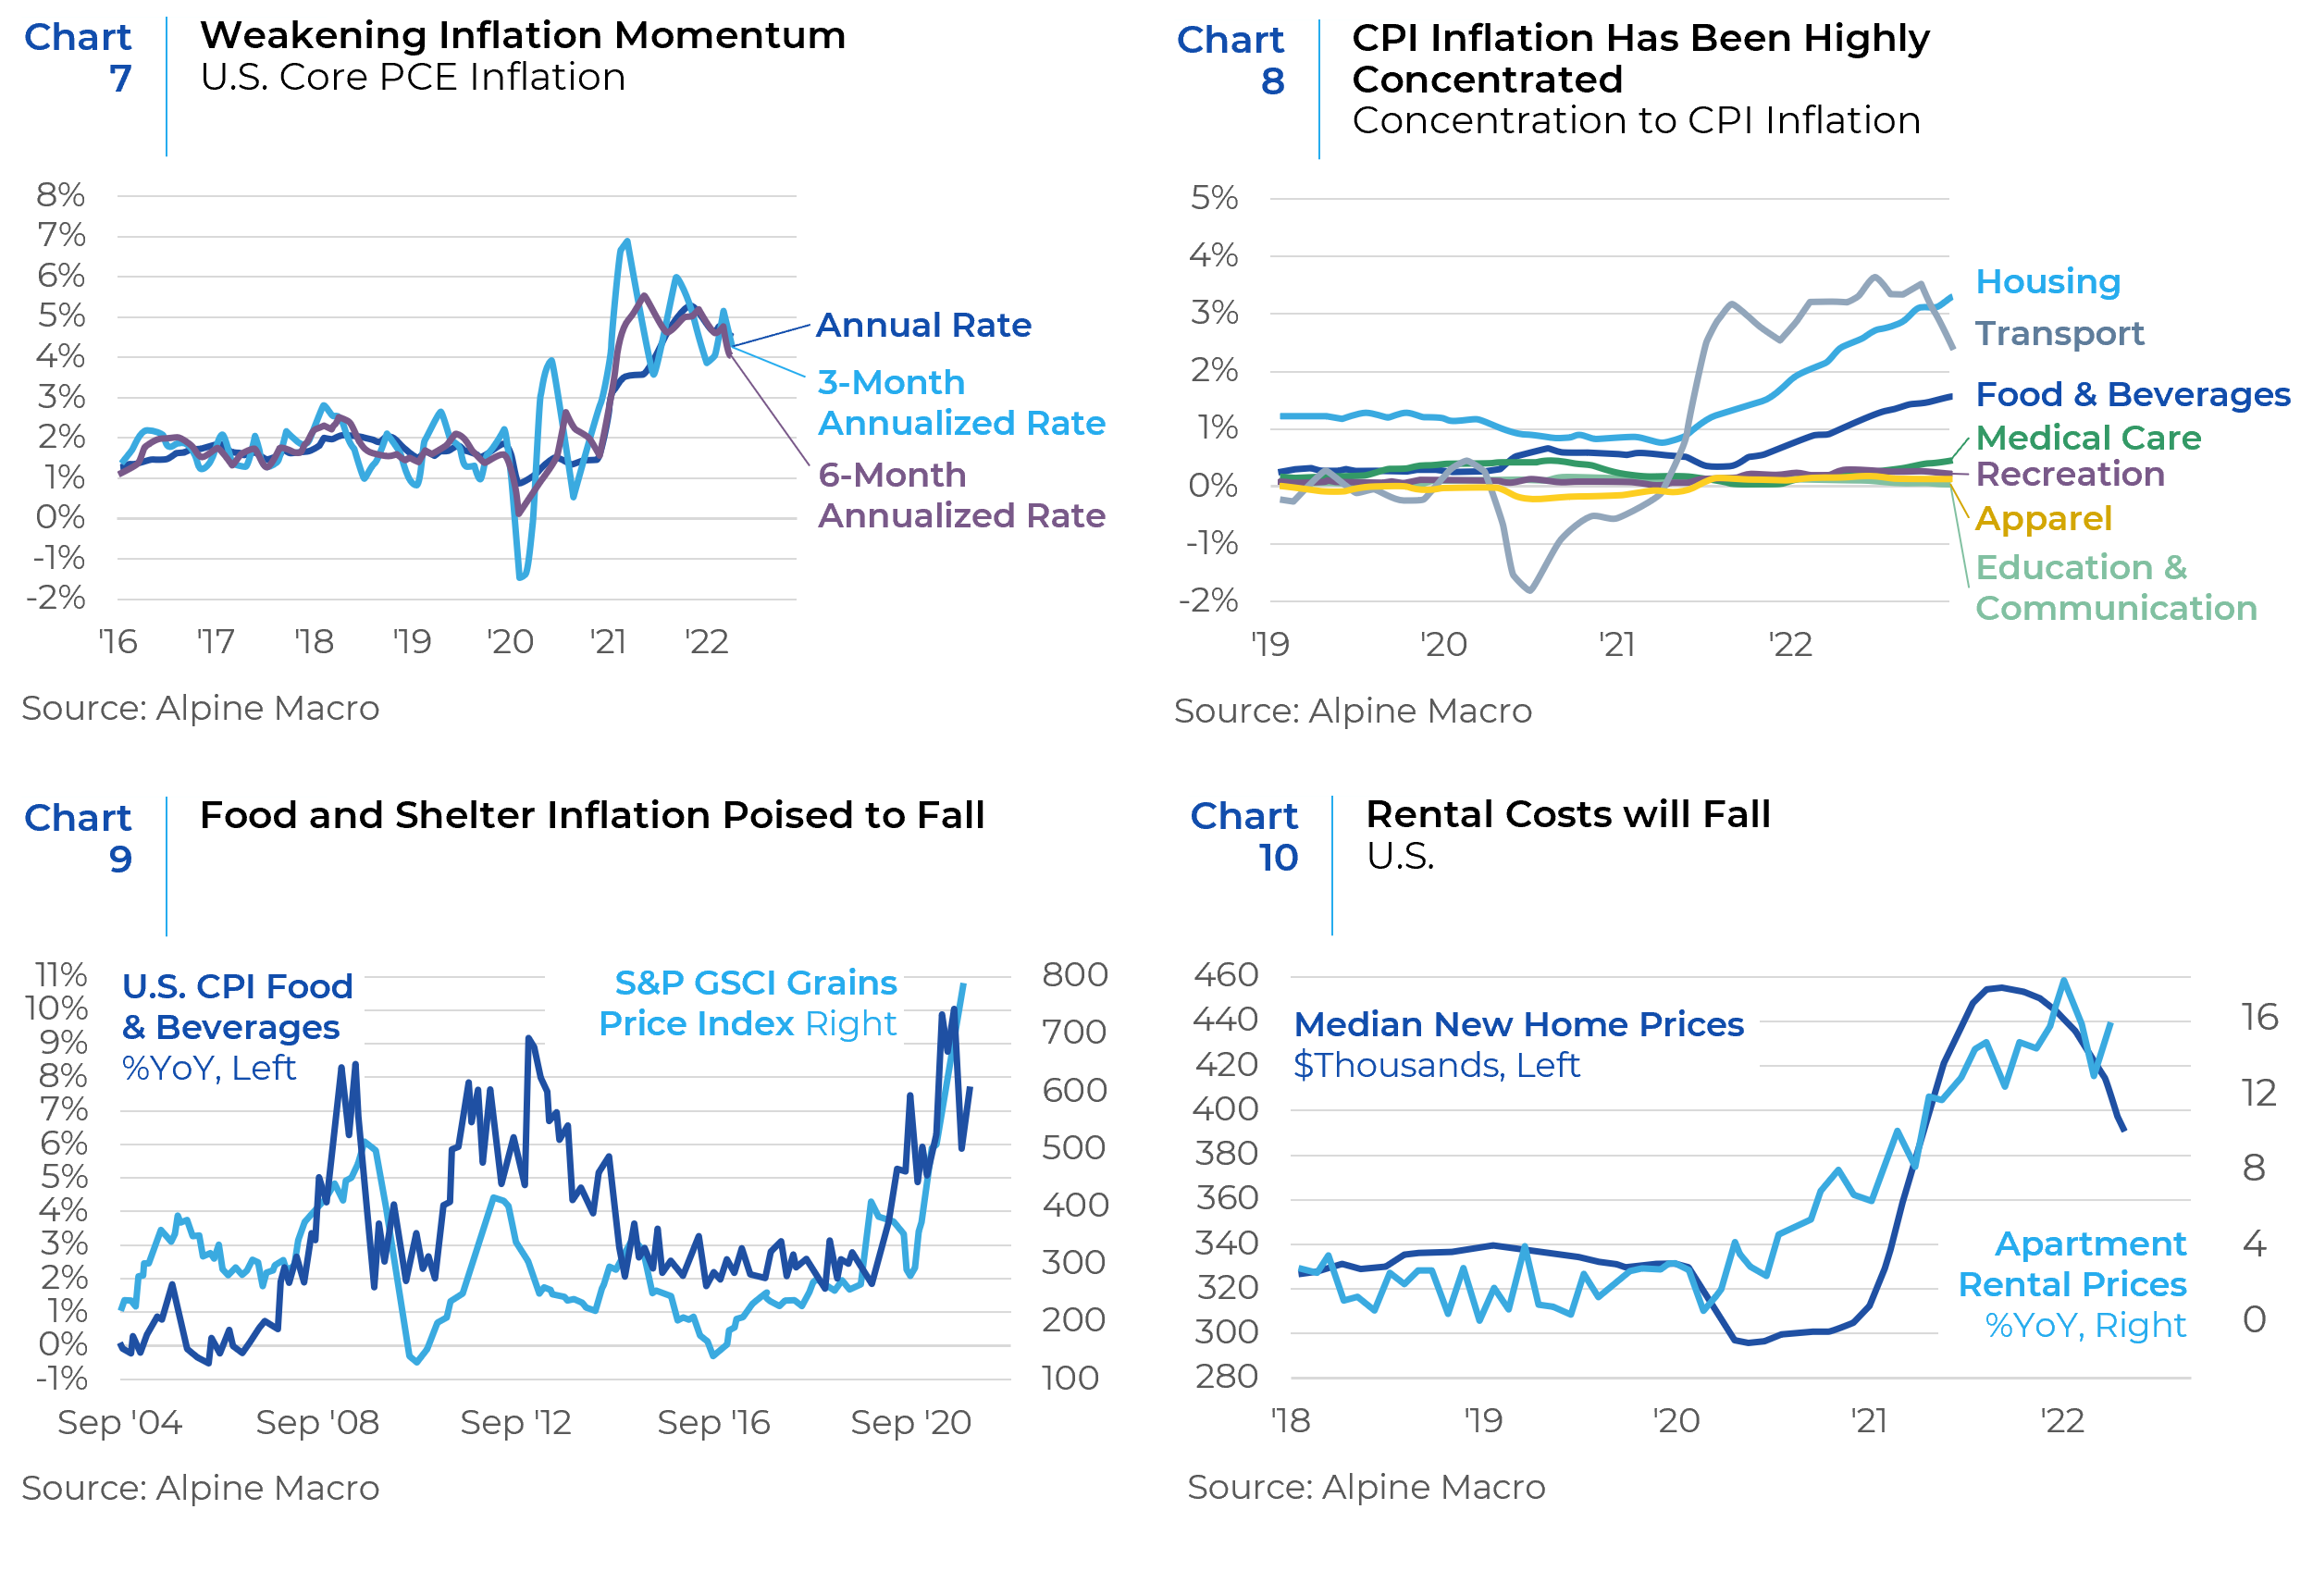
Although there is a realization that inflation has become entrenched and will take longer than expected to fall towards the 2% target range, there is some evidence of a potential decline in core PCE inflation. The PCE (Personal Consumption Expenditures Index) is what the Fed prefers to use as its primary measure of inflation. Chart 7 shows core PCE inflation over the last three, six, and 12 months. All short-term, fast-moving rates of change are falling, suggesting that momentum behind core PCE inflation is weakening. Moreover, Chart 8 shows that the recent jump in the CPI (the other measure of inflation) is highly concentrated driven primarily by transportation, food, and housing. Moderation in oil prices have pulled transportation costs lower in the past few weeks. Food price inflation can also be expected to moderate given that the GSCI grain futures are falling, which usually leads to a drop in the CPI Food and Beverage Index (Chart 9). This leaves housing as a sticky component in the CPI basket. Rental inflation is ultimately linked to the housing market, and both are strongly influenced by interest rates. Following the spike in mortgage rates, construction activity has already fallen 25%, and home prices have dropped 5% from their recent peak. National rental inflation has also decelerated recently (Chart 10). This should pave the way for some declines in the core inflation numbers in the coming months. If disinflation becomes more of a theme heading into 2023, it can be the foundation for optimism on the economy and markets. However, the speed and timing of inflation moderation versus the pace of rate increases will determine the probability of a soft landing versus a hard one.
Upcoming Earnings Season
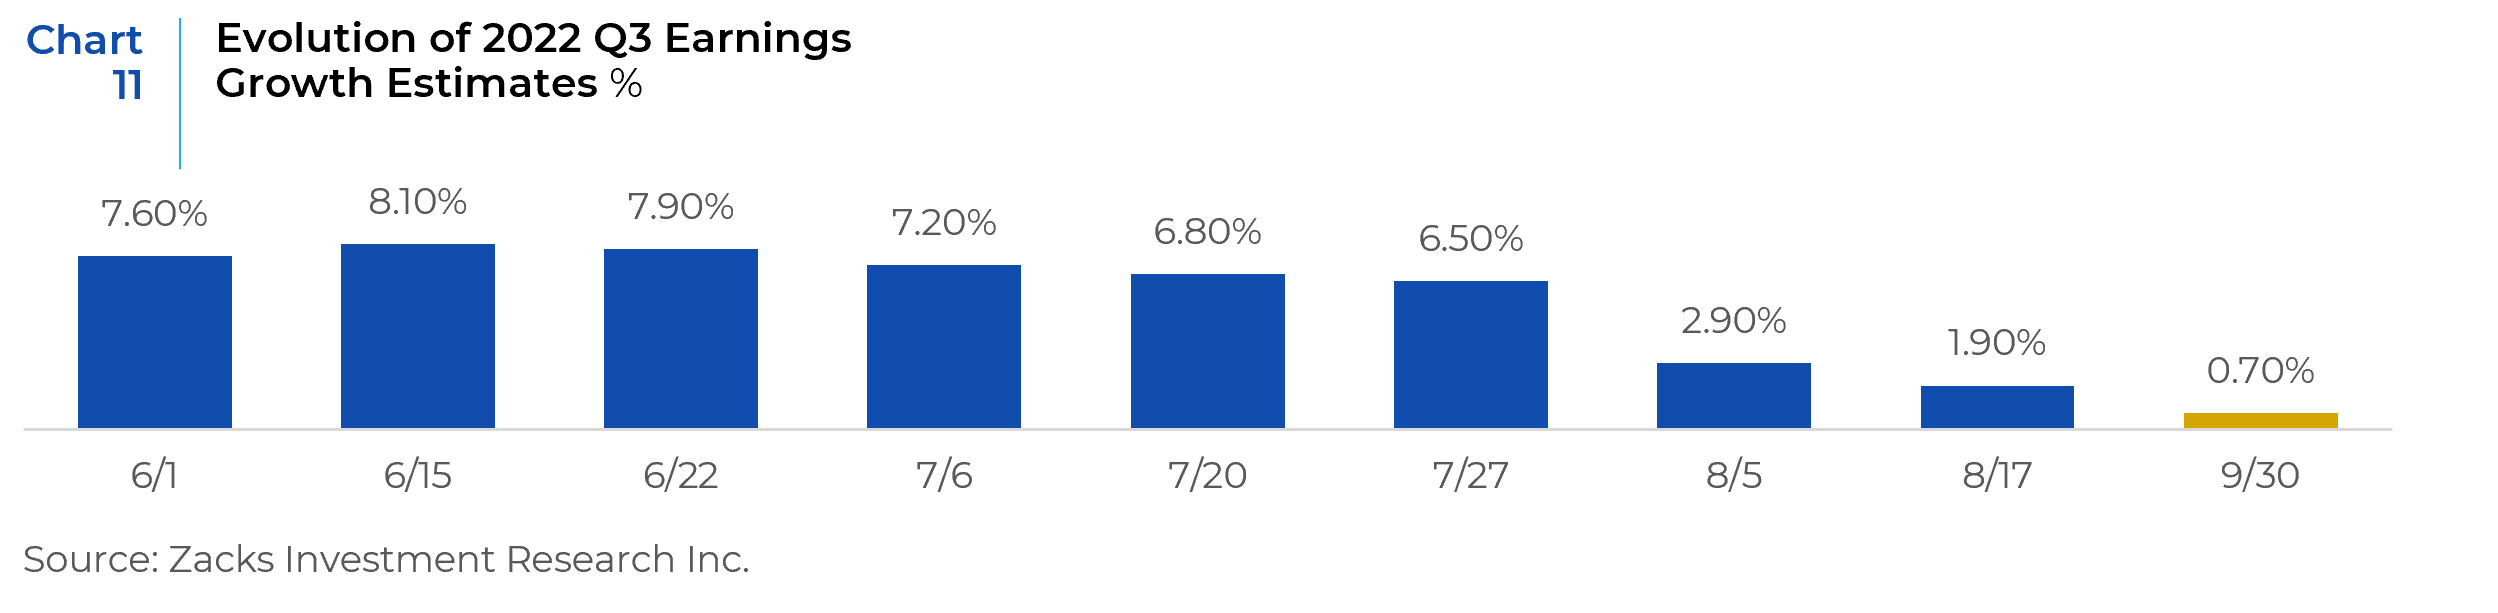
Estimates for the last two quarters of this year and full-year 2023 are coming down (Chart 11) but investors remain nervous about actual earnings and guidance from companies and their impact on market performance. High inflation generally increases the probability (Chart 12) and magnitude (Chart 13) of margin declines to a degree that may not be fully reflected in current earnings estimates.
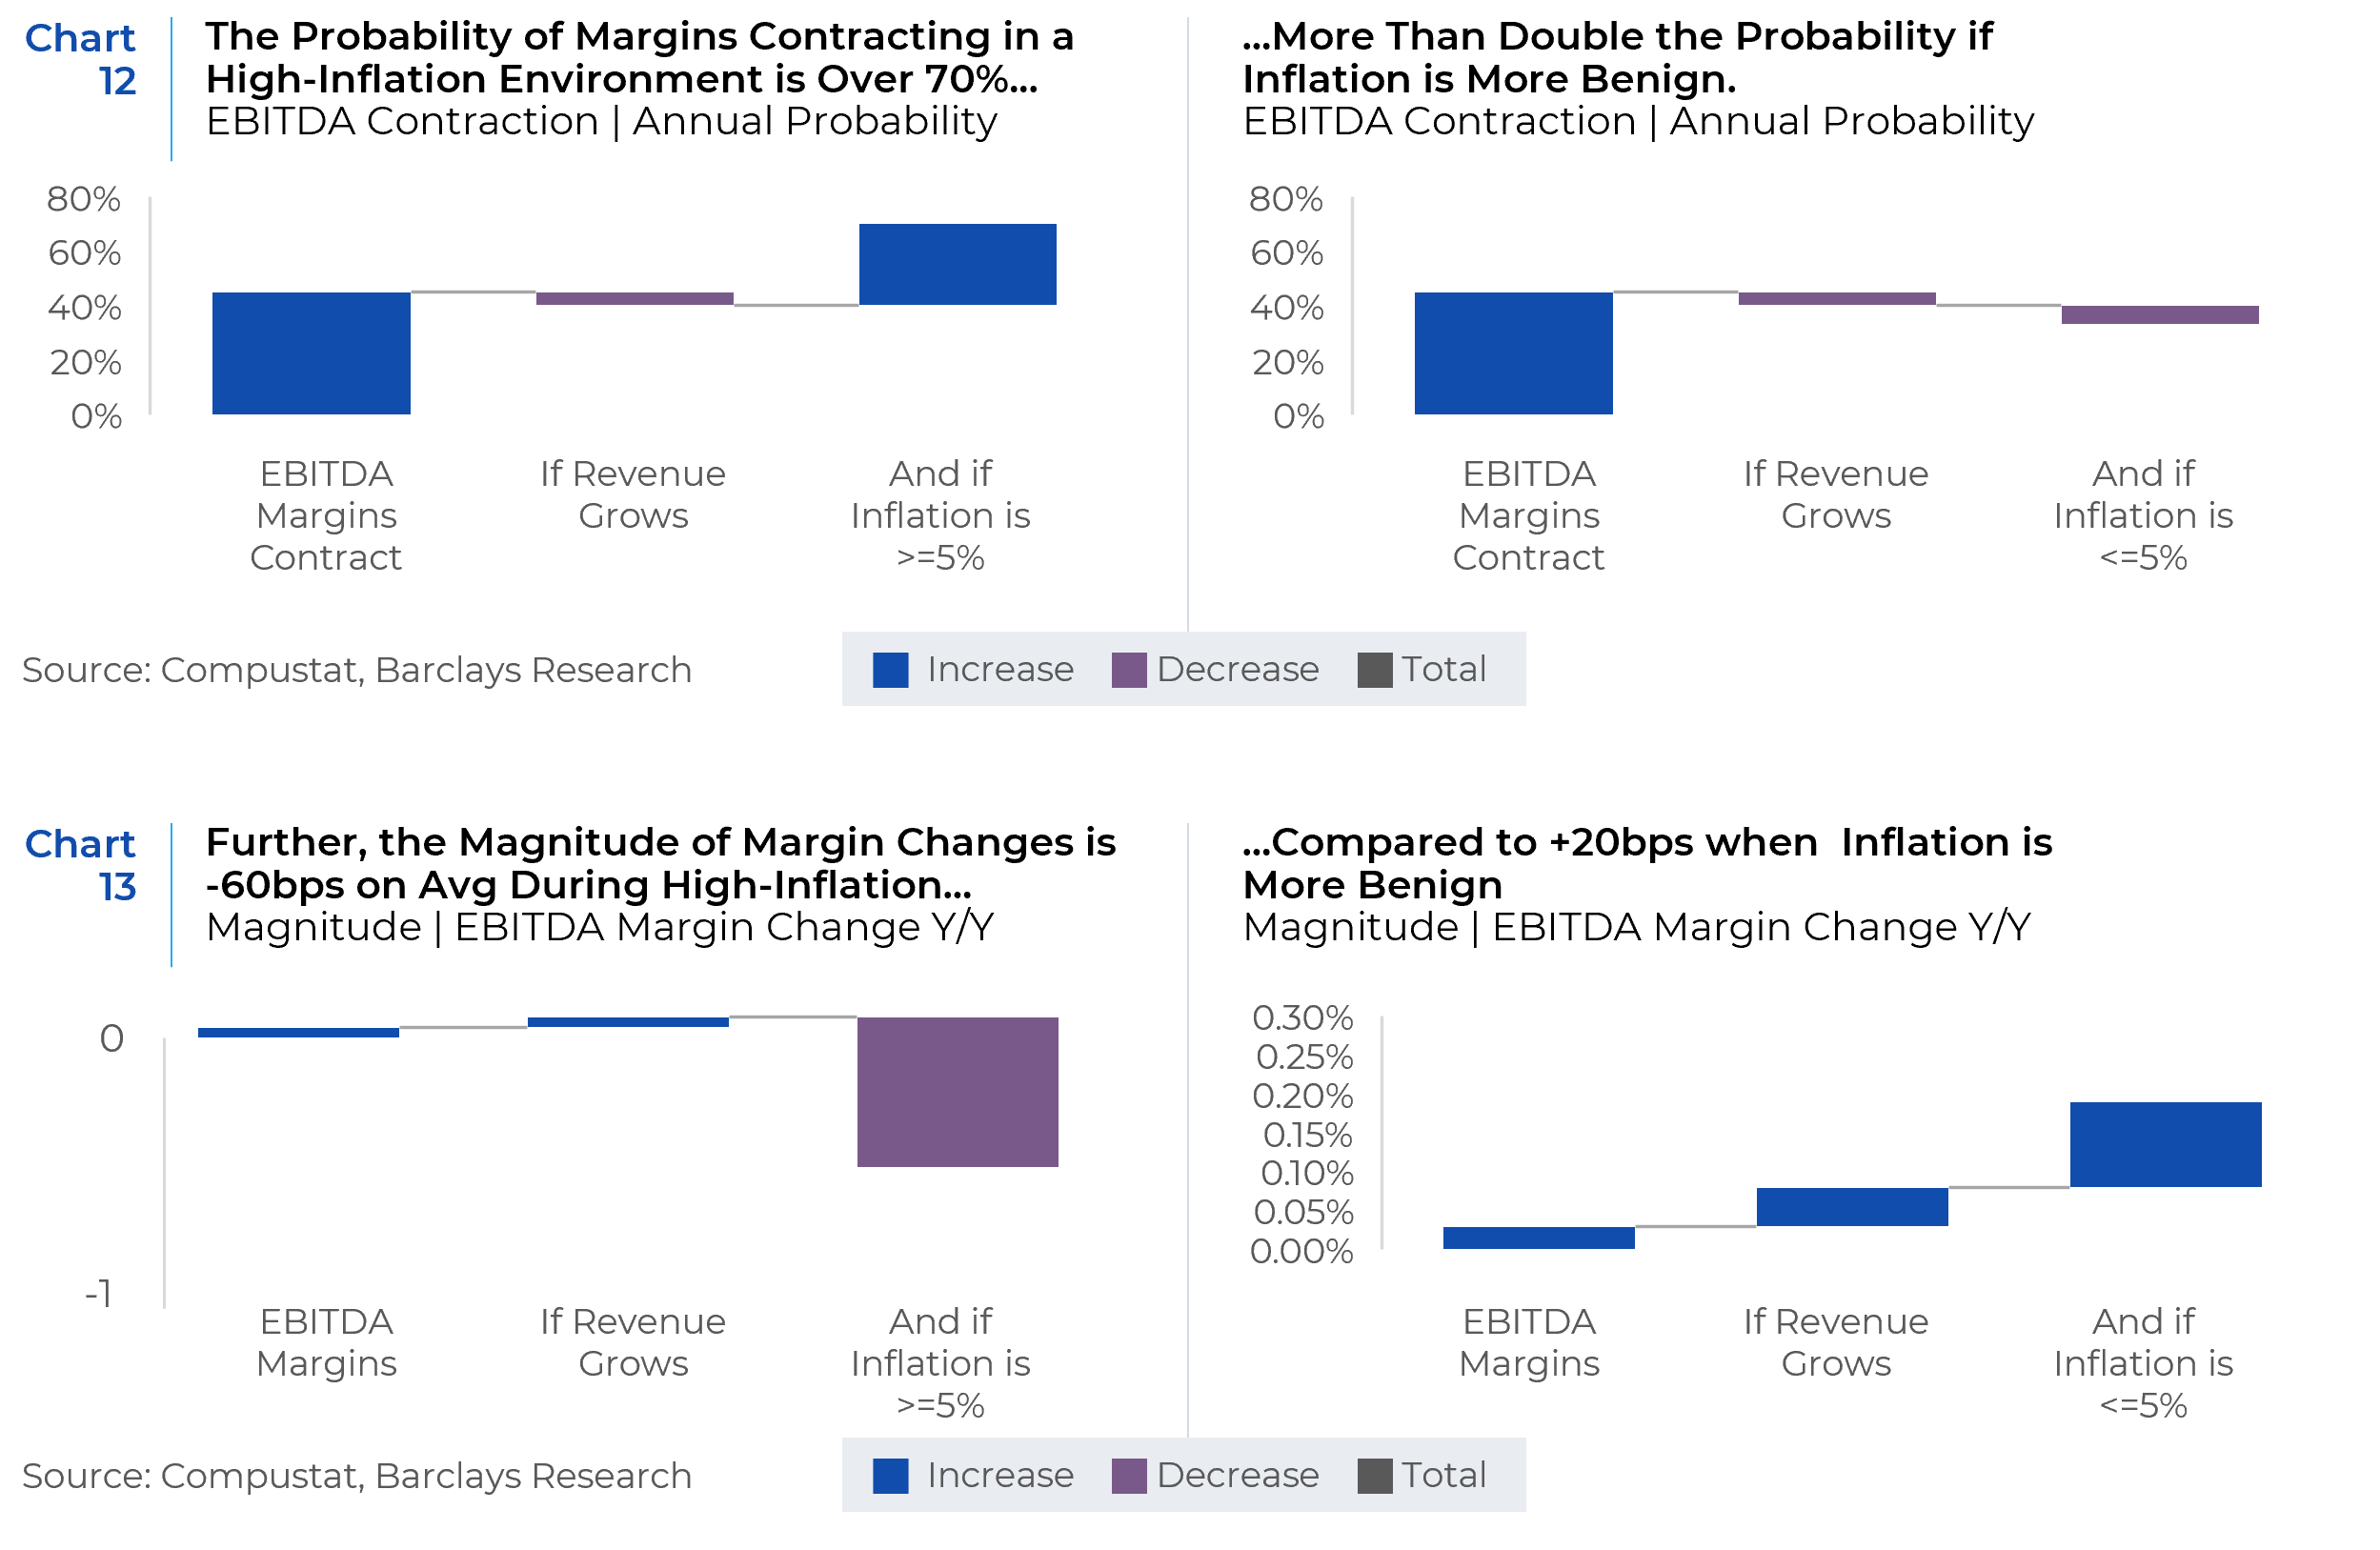
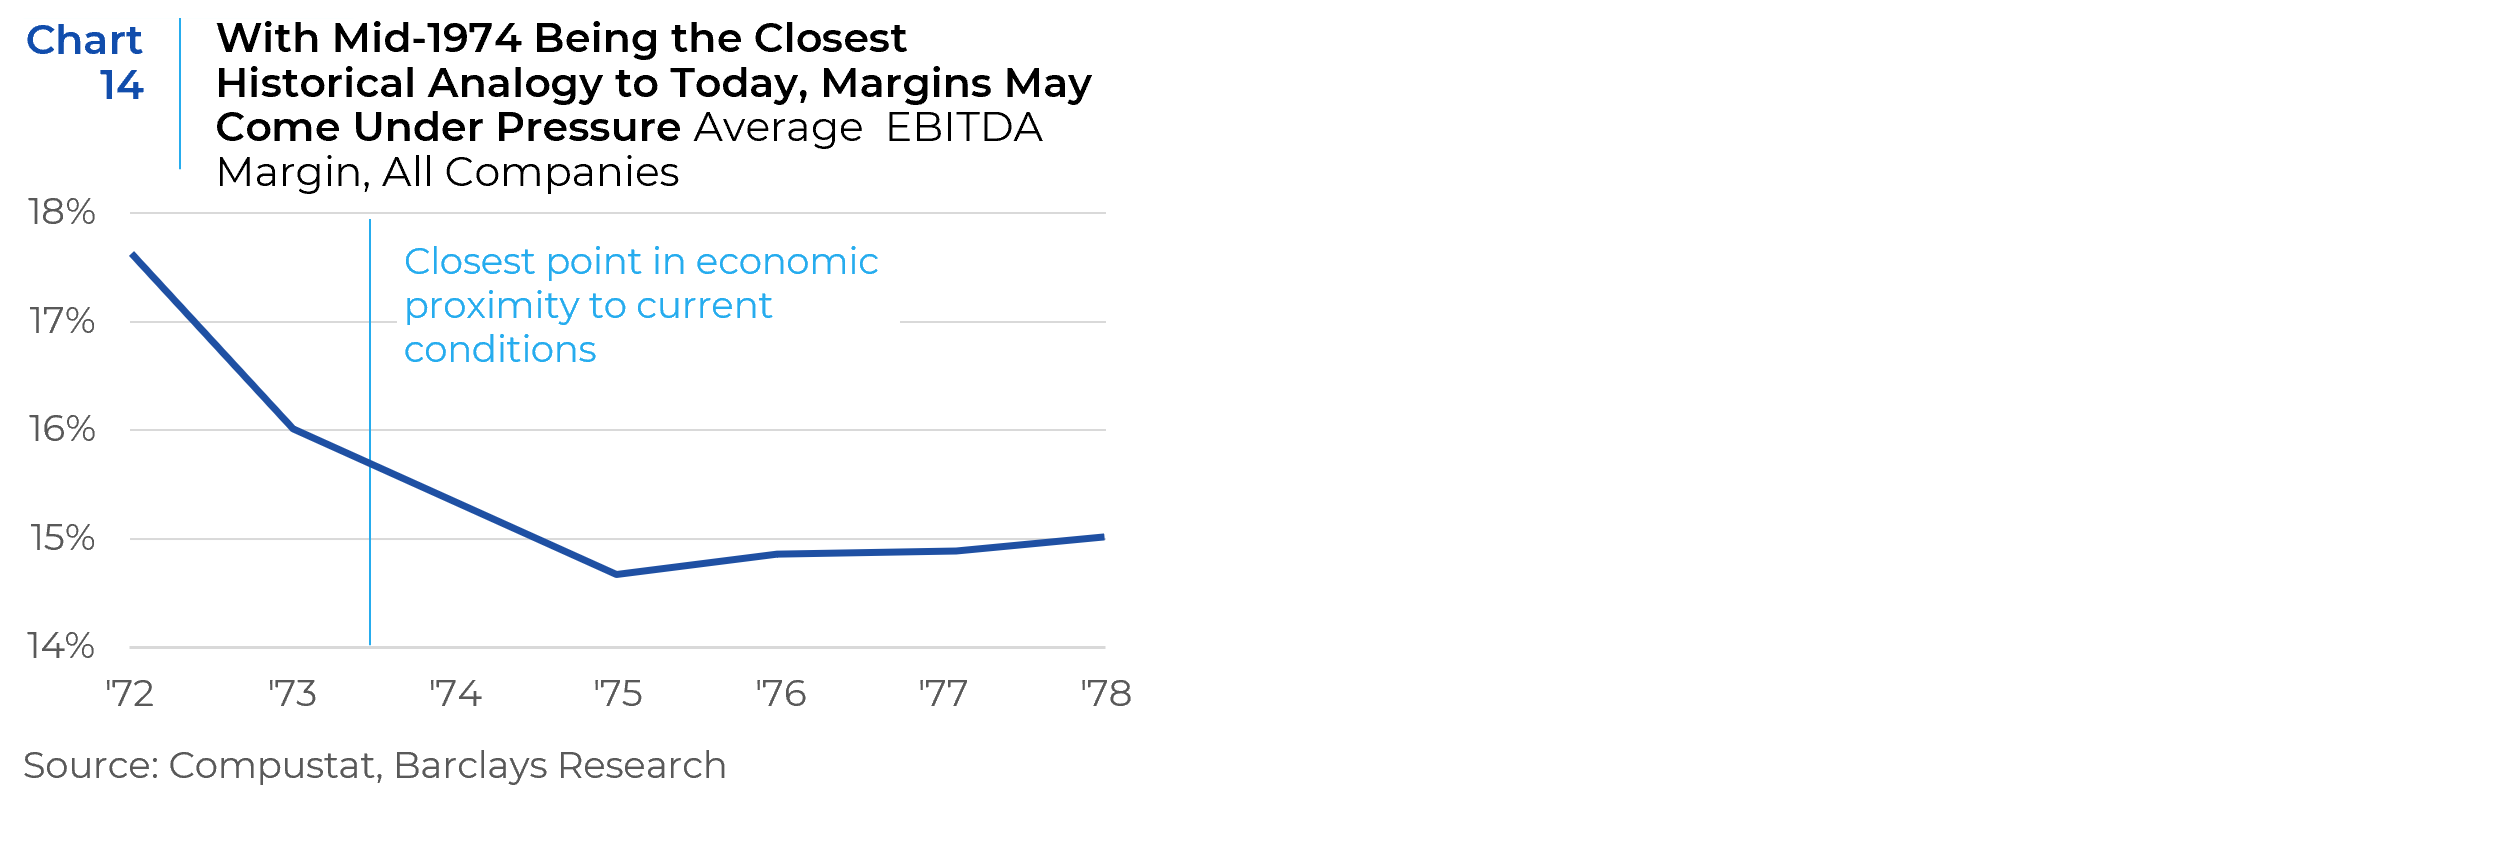
Inflation running north of 8% is novel to most managers and analysts, who have not experienced a high inflation period in their careers. They most probably face a squeeze on their cost lines that is unprecedented in their working lives. In addition, a slowing economy will negatively impact revenues and ultimately earnings and the bottom line. In the most historically similar period from 1973 to 1974, EBITDA margins contracted by ~75bps, and from 1974 to 1975 contracted by another ~65bps, with declines in most industries (Chart 14).
The other headwind for earnings is the strong dollar. The US dollar has appreciated by over 25% since the beginning of 2021 (Chart 15) and US multinationals have underperformed. The S&P 500 companies derive roughly 40% of sales from abroad and the strong dollar is a headwind because not only does an appreciating domestic currency diminish foreign earnings through a currency translation effect, but it also makes US goods and services more expensive and less competitive in the global marketplace.
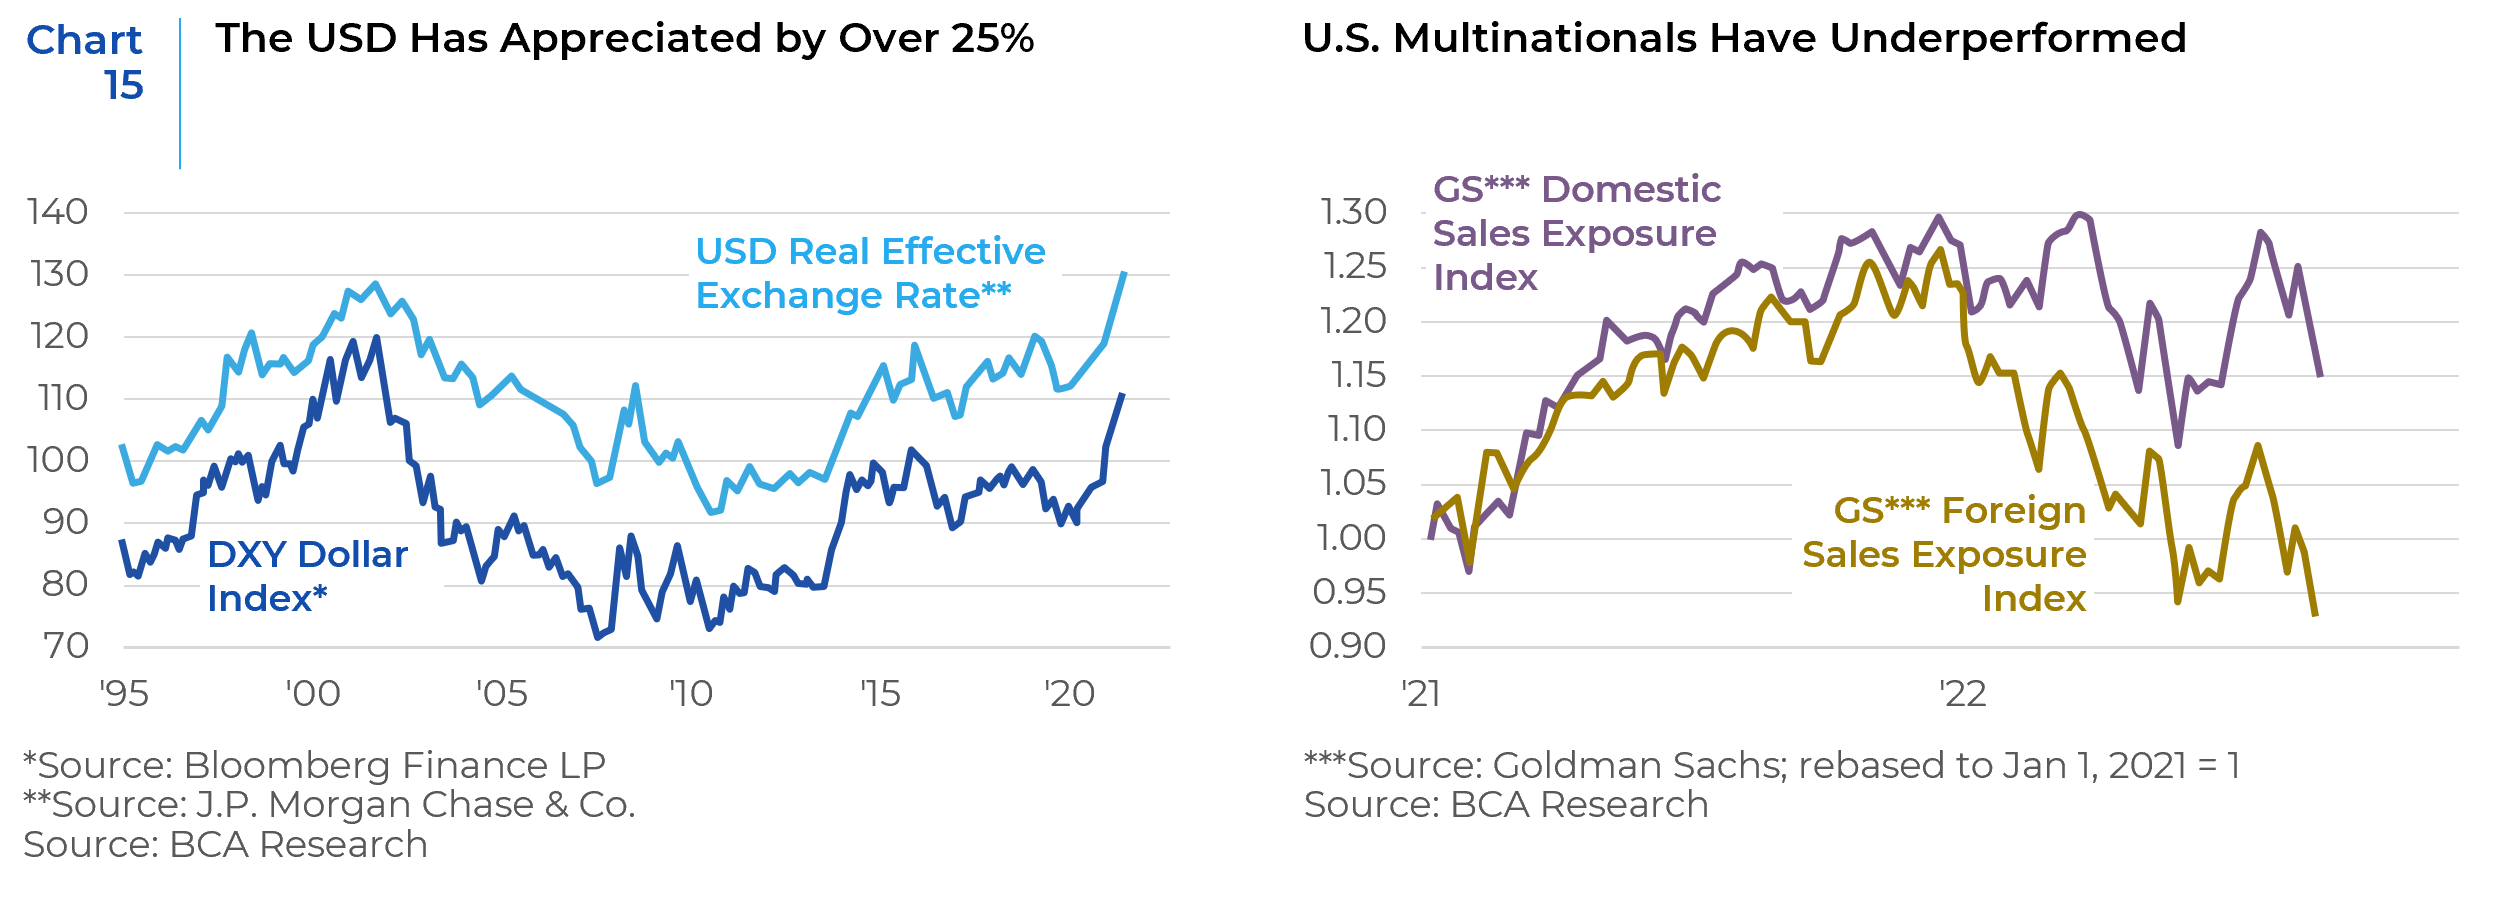
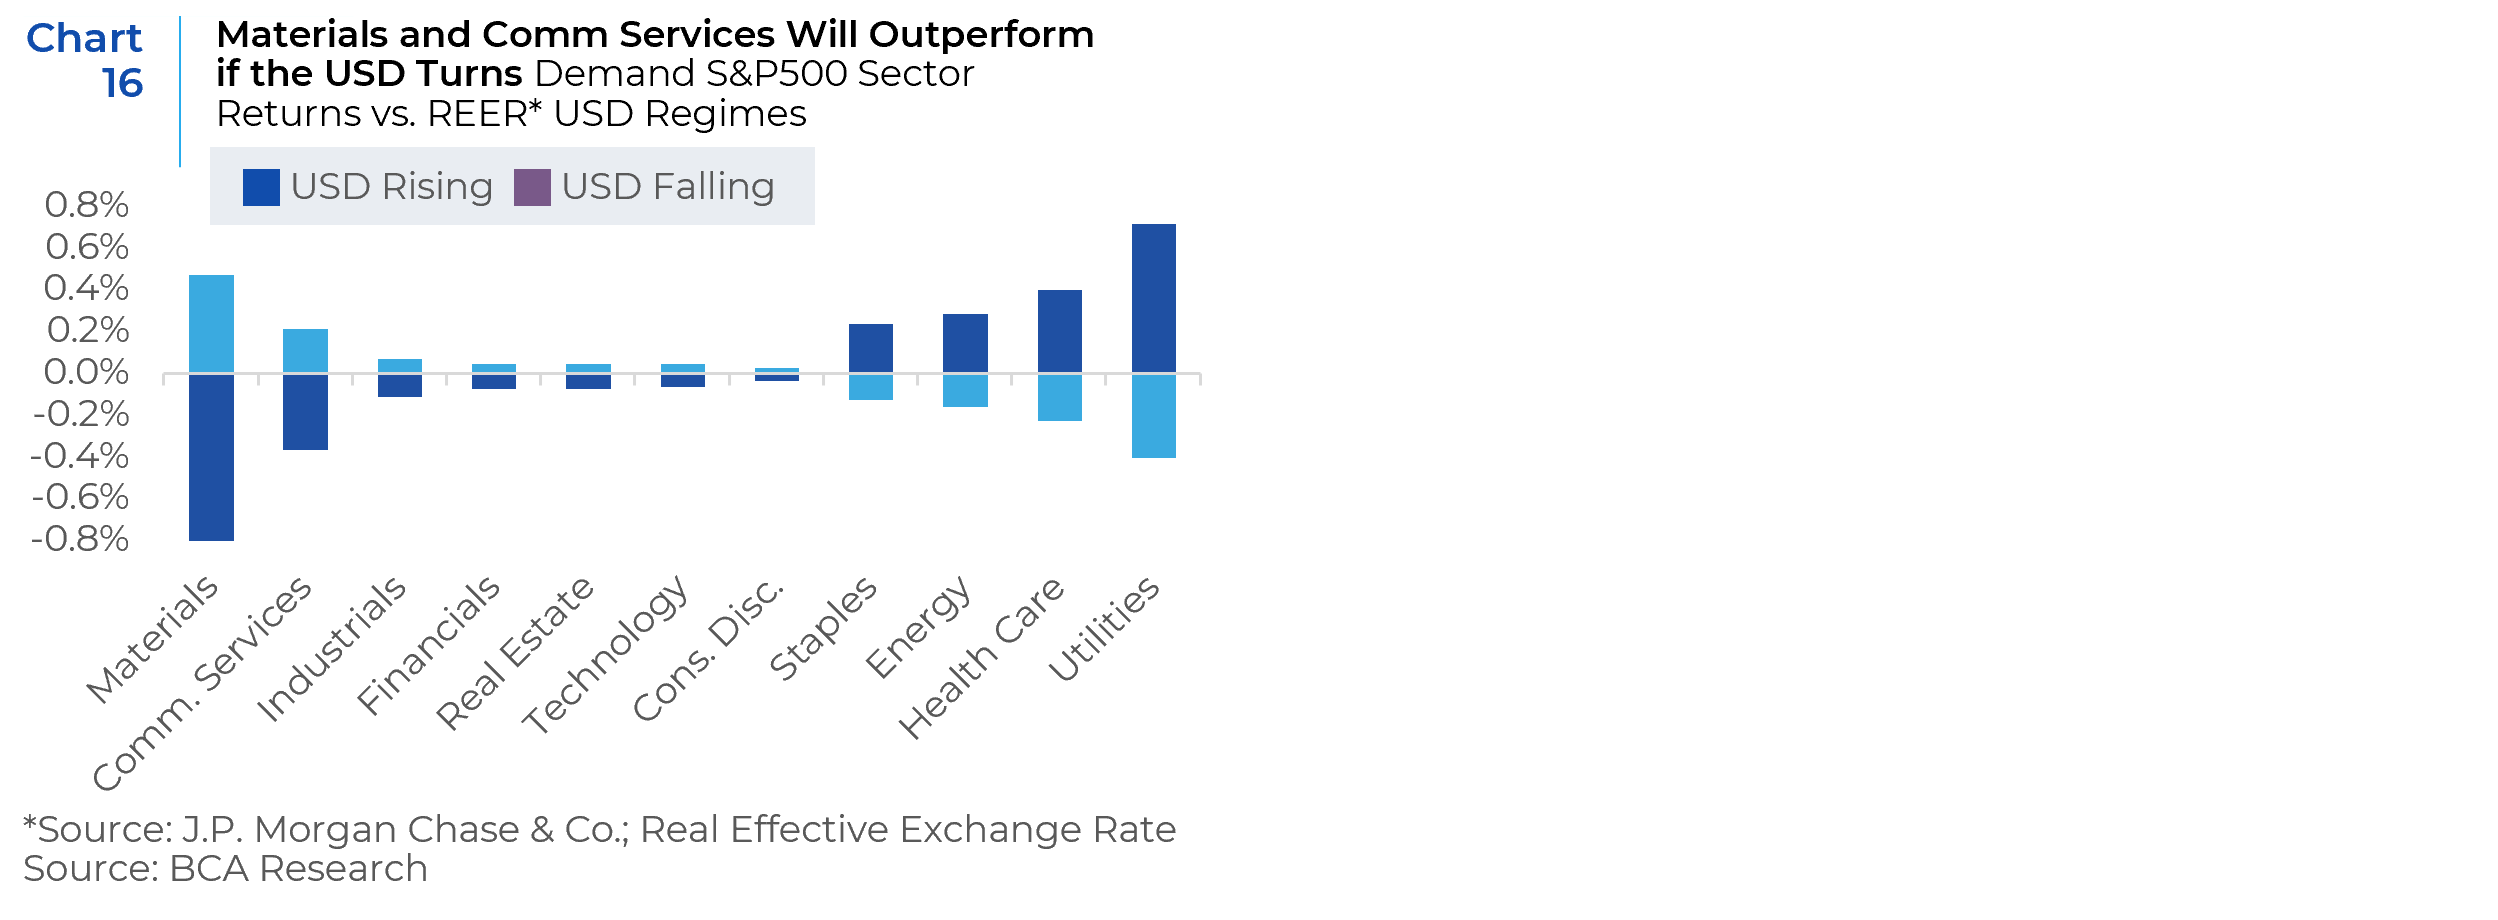
The US dollar outperforms when global growth is strong and investors are optimistic, as well as when growth slows and investors are fearful, benefiting from its status as a reserve currency. Over the past two years, both scenarios have played out. In 2021, investor flows pushed the dollar higher as the US was ahead of the rest of the world in terms of post-pandemic recovery. This year, the dollar became a safe haven for nervous investors and became one of the rare assets delivering positive returns. In the S&P 500, the Technology and Materials sectors have about 60% of foreign sales, and for the companies in these sectors, a strong currency is a serious concern. Utilities, Financials, and Real Estate are the most domestic in the index (Chart 16).
Equity Markets
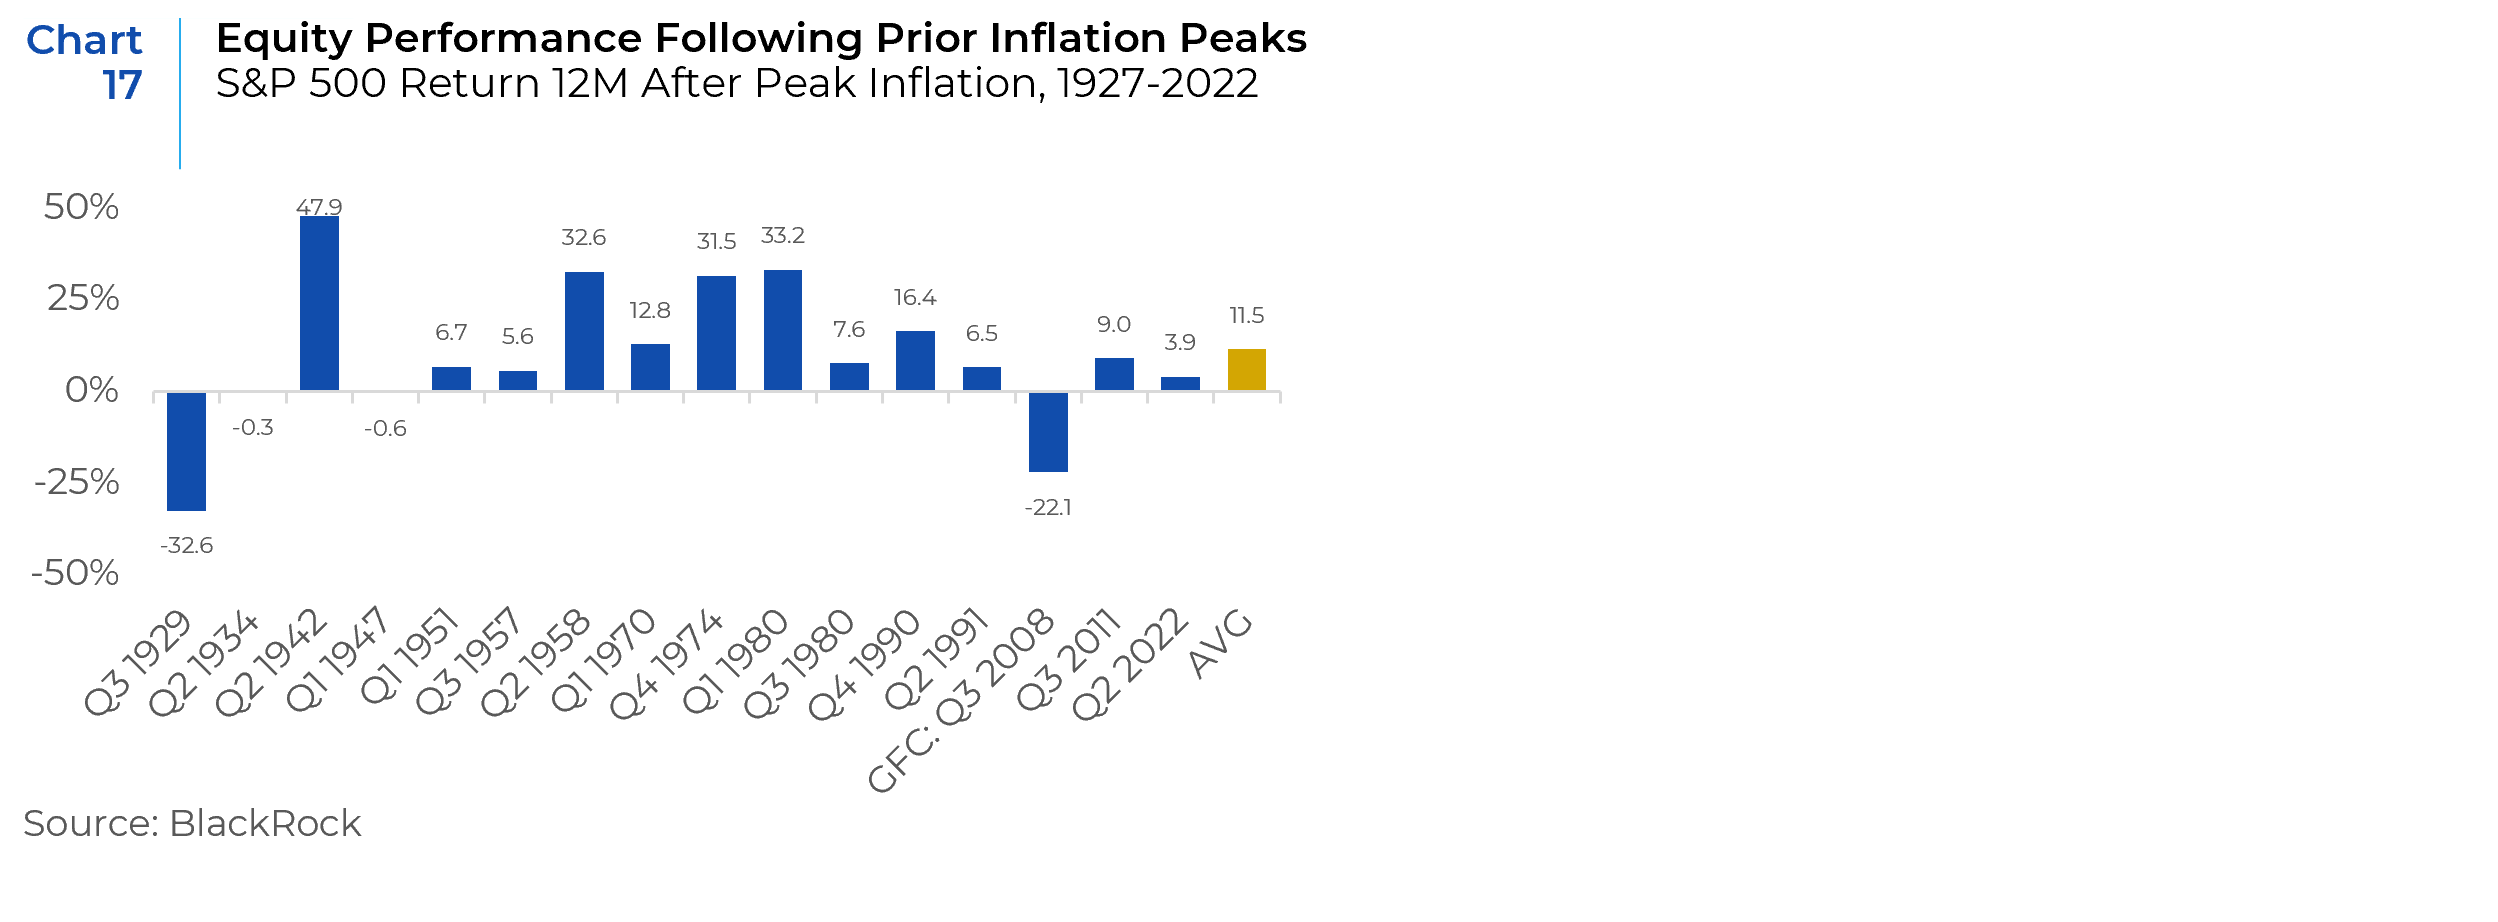
As the Fed aims to tame inflation without sending the U.S. economy into a deep recession, equity investors are grappling with their own balancing act ― how to factor competing risks into their portfolios. Inflation peaks and market rallies sometimes go hand in hand. As shown in Chart 17, the average S&P 500 return in the 12 months following a peak in inflation is 11.5%. If inflation peaked in June as many investors hope, there is still a possibility that markets may consolidate and post a positive return for one-year period ending in June 2023.
However, that does not account for the growing risk of recession. The ongoing transition in the economy and markets is likely to be bumpy. At this early stage, with inflation just having peaked, investors may be overestimating the speed at which shorter-term dislocations in the economy can normalize (e.g., strong employment alongside high inflation) and underestimating the magnitude and duration of the longer-lasting components of inflation (e.g., wages and shelter costs). An easing in headline CPI could be supportive of equity markets in the near term, but Fed rate hikes impact the real economy with a lag and company earnings may be stressed for the next couple of quarters. Businesses will weather this chapter with varying degrees of success. This further argues for a focus on companies with quality characteristics ― particularly strong balance sheets and healthy free cash flow to offer a buffer in the case of a slowdown or profit squeeze.
If the economy heads into a recession, there will be pain for asset prices. Drawdowns for the S&P 500 around recessions have ranged from 14% to 57% (Table 2). The average drop has been 32% and the median drop has been 27%. That could imply that the S&P 500 could end up in the 3200 to 3500 range, i.e., fall another 7% to 15%.
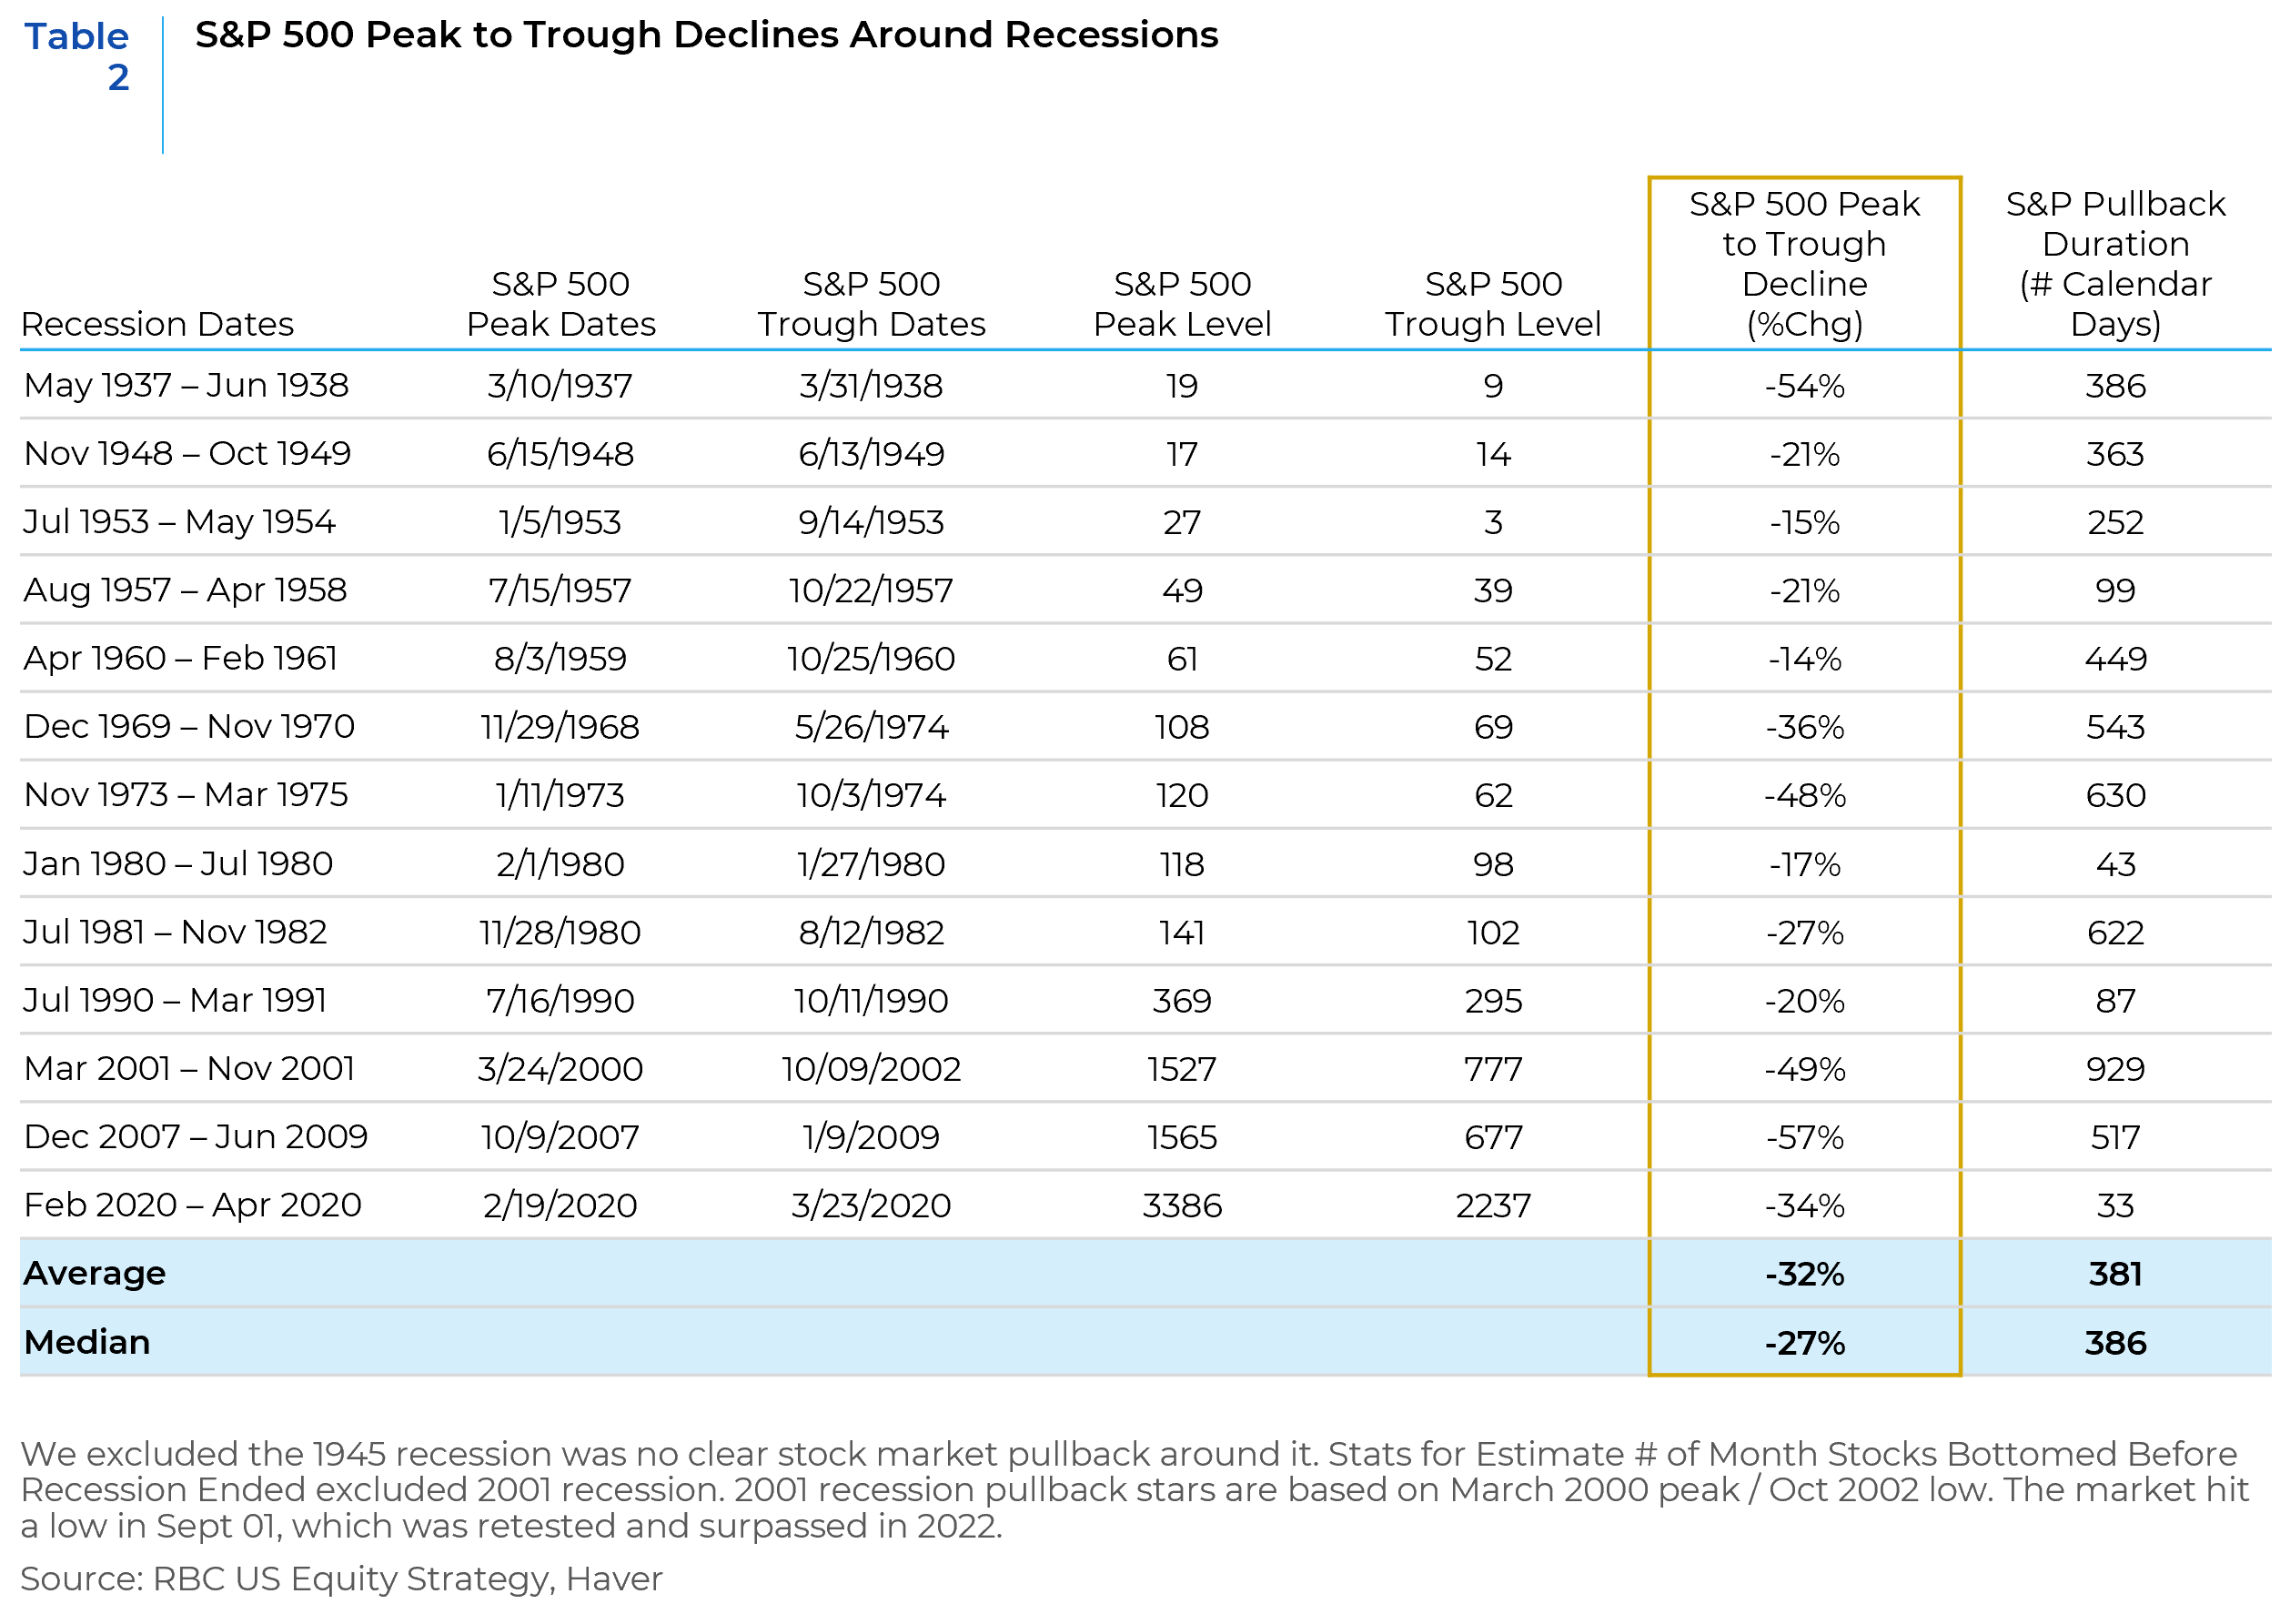
The Dec 2007 – June 2009 S&P 500 Peak to Trough Decline number needs to be 57% not 5.7%.
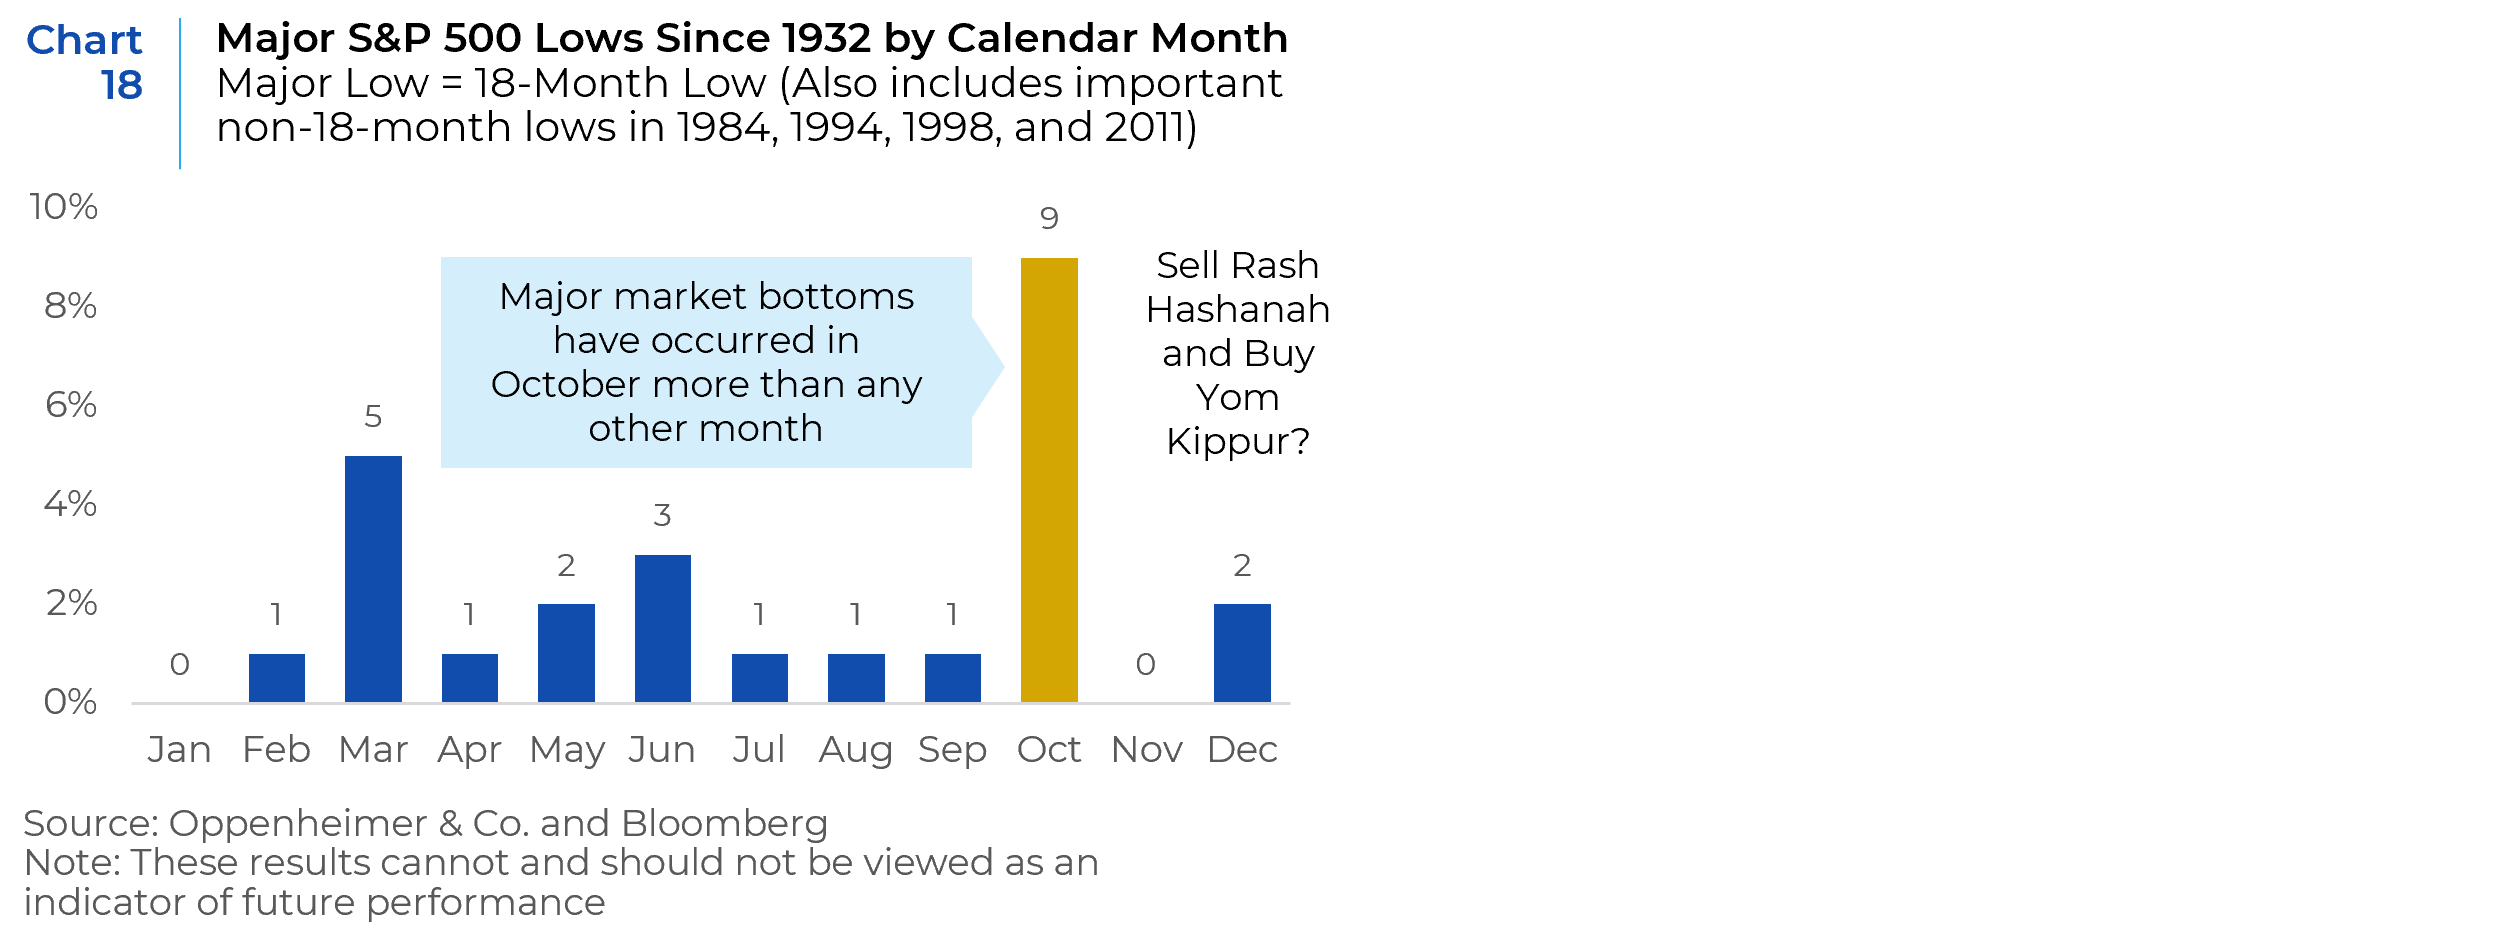
Despite all the headwinds, a short-term bounce in the fourth quarter of 2022 may be possible due to oversold conditions and the fact that weak Septembers have typically been followed by strong Octobers when the S&P 500 is trading below its 200-day average. In addition, major market bottoms have occurred in October more than any other month since 1932 (Chart 18).
The progression of the cyclical decline in equity prices since early this year is being driven by the close negative correlation between rates and stock prices and the multiple compression in response to rising rates. Stock prices began to fall in January when the equity market sniffed out an impending monetary tightening cycle. By extension, this correlation also suggests that the bear market will come to a stop once the Fed is about to complete its tightening cycle. The equity market has become more anticipatory than before, and equities will likely perk up even before the Fed signals a dovish pivot. A large amount of monetary tightening has already been priced in at a time when inflation may well have peaked. This means that the current bear market is very advanced but not yet completely over. While it is hard to gauge when there will be a transition to a disinflationary environment, the Fed’s relentless fight against inflation is expected to yield results by the middle of next year.
References: FactSet, BCA Research, Alpine Macro, Charles Schwab Asset Management, PGM Global, Credit Suisse, BlackRock, Zacks, Michael Lebowitz, 9/21/22, “The Tail Risk of Persistent Inflation”
This report is neither an offer to sell nor a solicitation to invest in any product offered by Xponance® and should not be considered as investment advice. This report was prepared for clients and prospective clients of Xponance® and is intended to be used solely by such clients and prospects for educational and illustrative purposes. The information contained herein is proprietary to Xponance® and may not be duplicated or used for any purpose other than the educational purpose for which it has been provided. Any unauthorized use, duplication or disclosure of this report is strictly prohibited.
This report is based on information believed to be correct, but is subject to revision. Although the information provided herein has been obtained from sources which Xponance® believes to be reliable, Xponance® does not guarantee its accuracy, and such information may be incomplete or condensed. Additional information is available from Xponance® upon request. All performance and other projections are historical and do not guarantee future performance. No assurance can be given that any particular investment objective or strategy will be achieved at a given time and actual investment results may vary over any given time.