
Market Review
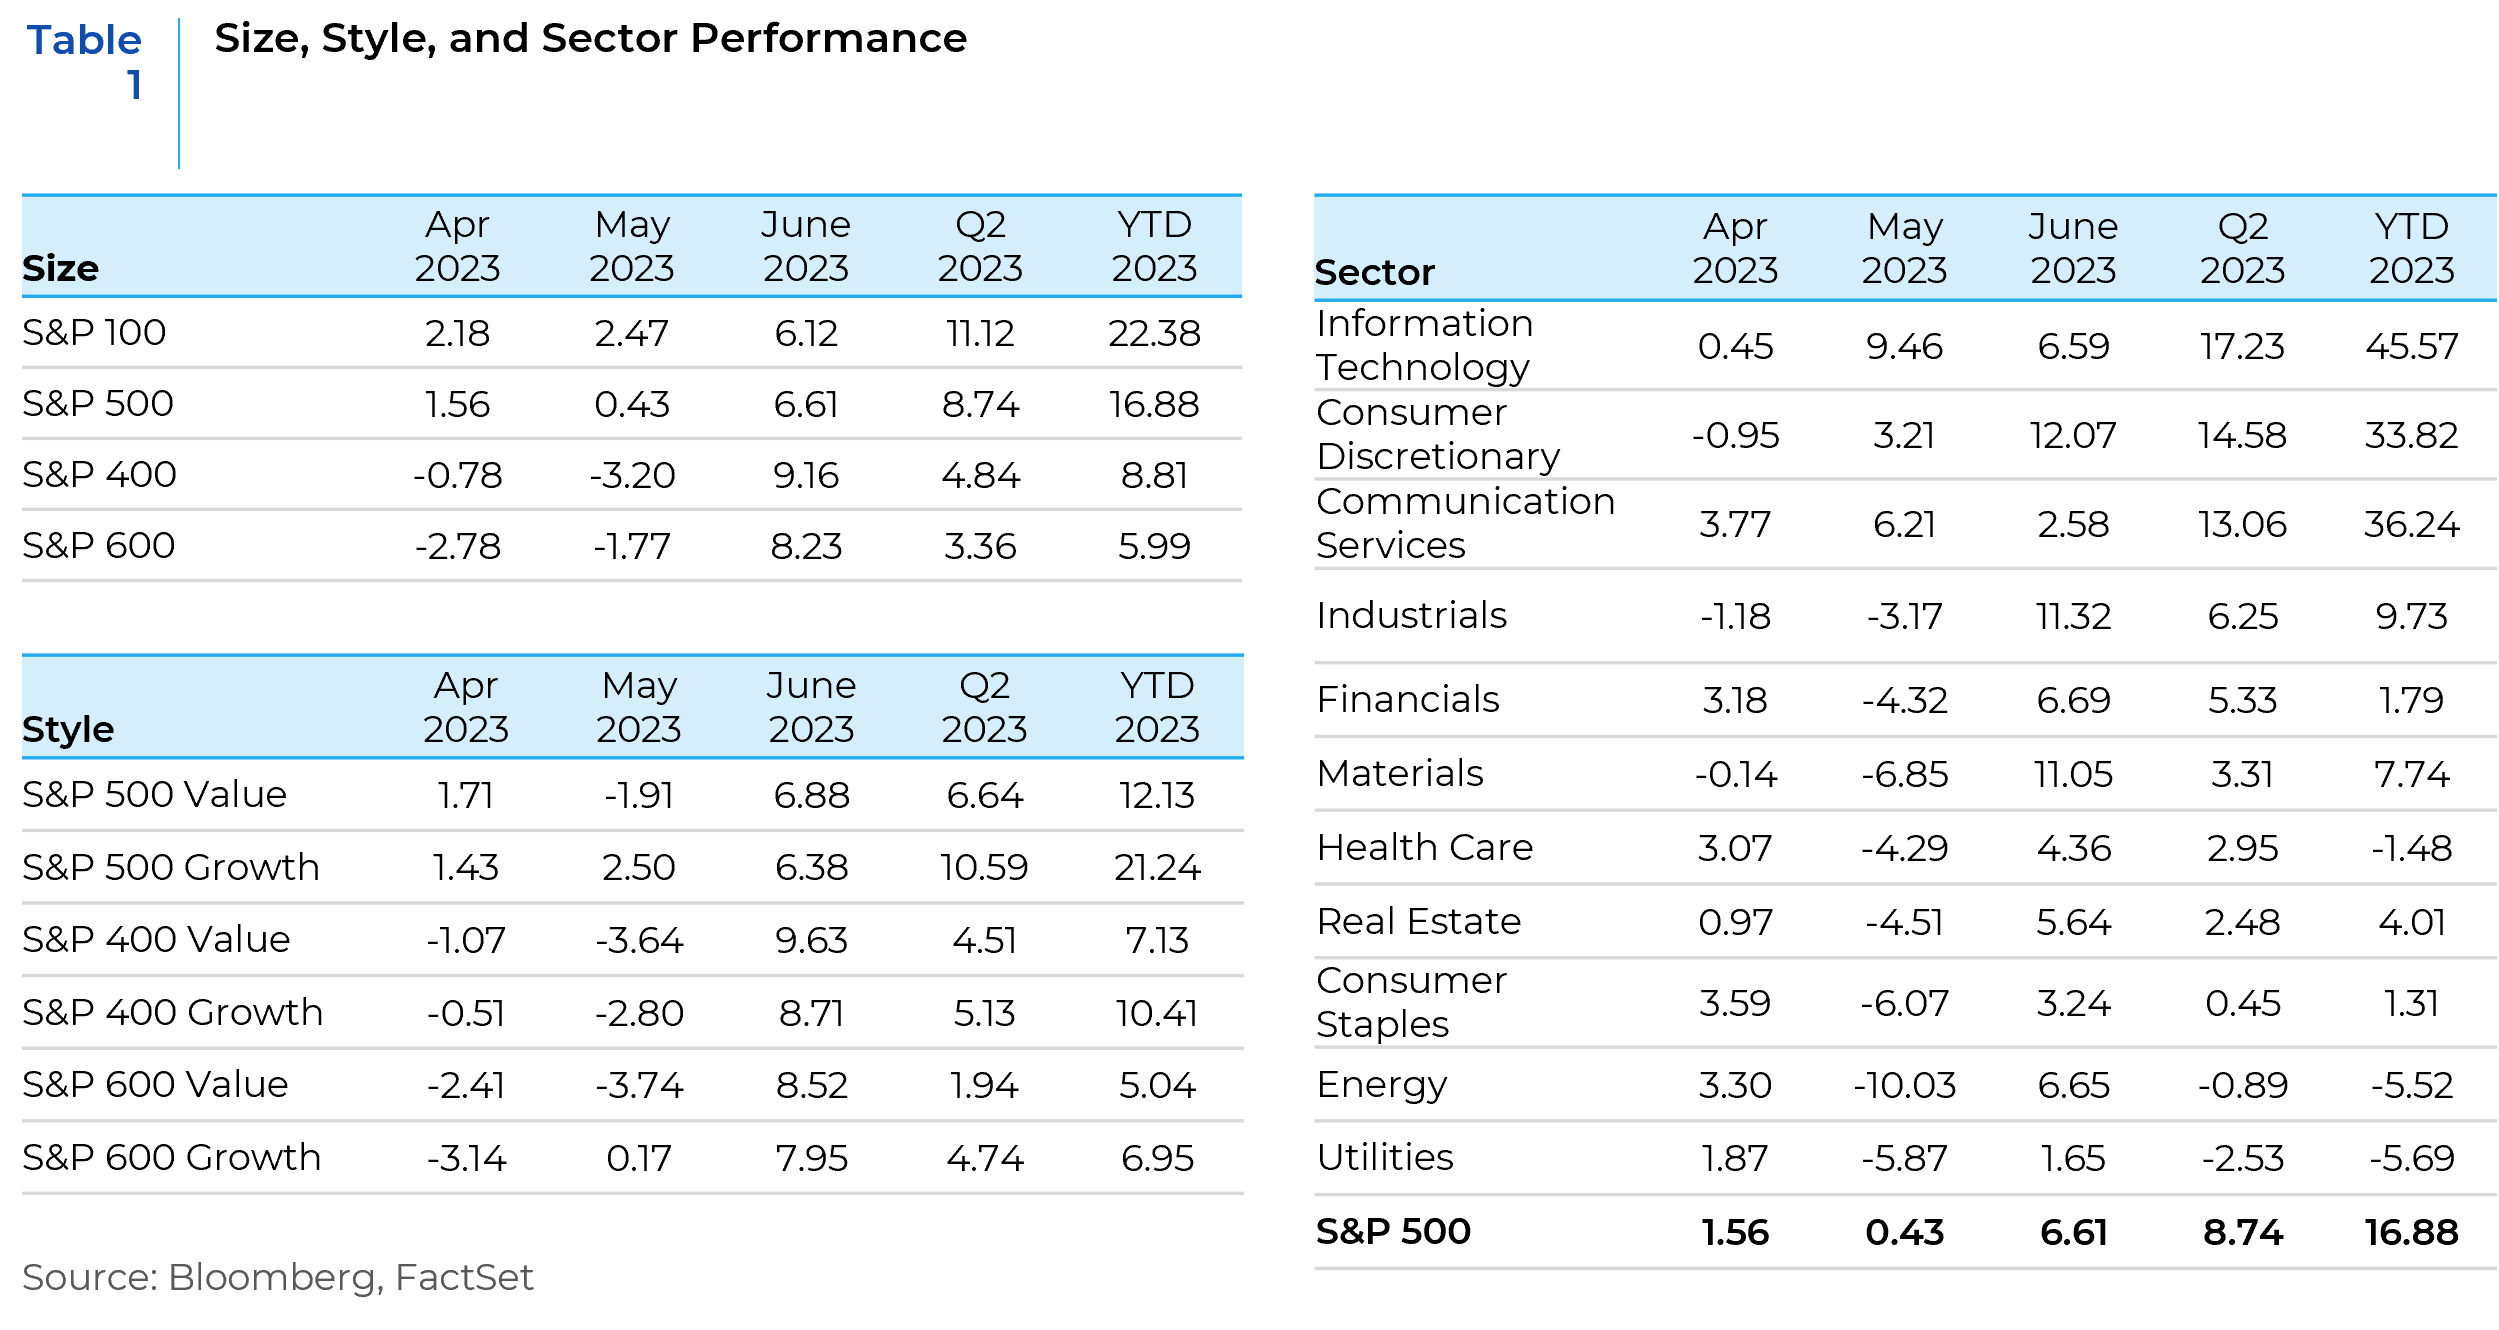
The second quarter of 2023 saw US equities climb higher powered by large cap growth companies leveraged to the AI (Artificial Intelligence) theme. A pickup in soft-landing expectations seemed to be among the more powerful tailwinds for equity markets. Labor market strength underpinned the broader consumer resilience theme. The soft-landing narrative was also supported by an improving housing market, despite the elevated rate backdrop. In addition, Q1 earnings and guidance came in above expectations, dampening some of the concerns about a meaningful reset to 2023 consensus estimates. The AI secular growth theme was a big bright spot, boosting performance for companies in the technology and communication services sectors. Despite the Q2 gains, there were plenty of bearish sentiment regarding even more rate hikes leading to a policy mistake, particularly given the lagged effects of monetary policy and the signaling from further yield curve inversion, collapsing money supply growth, and tightening lending standards. Other areas of caution included narrow market leadership, valuation, looming liquidity headwinds, and an underwhelming China recovery.
Market Outlook
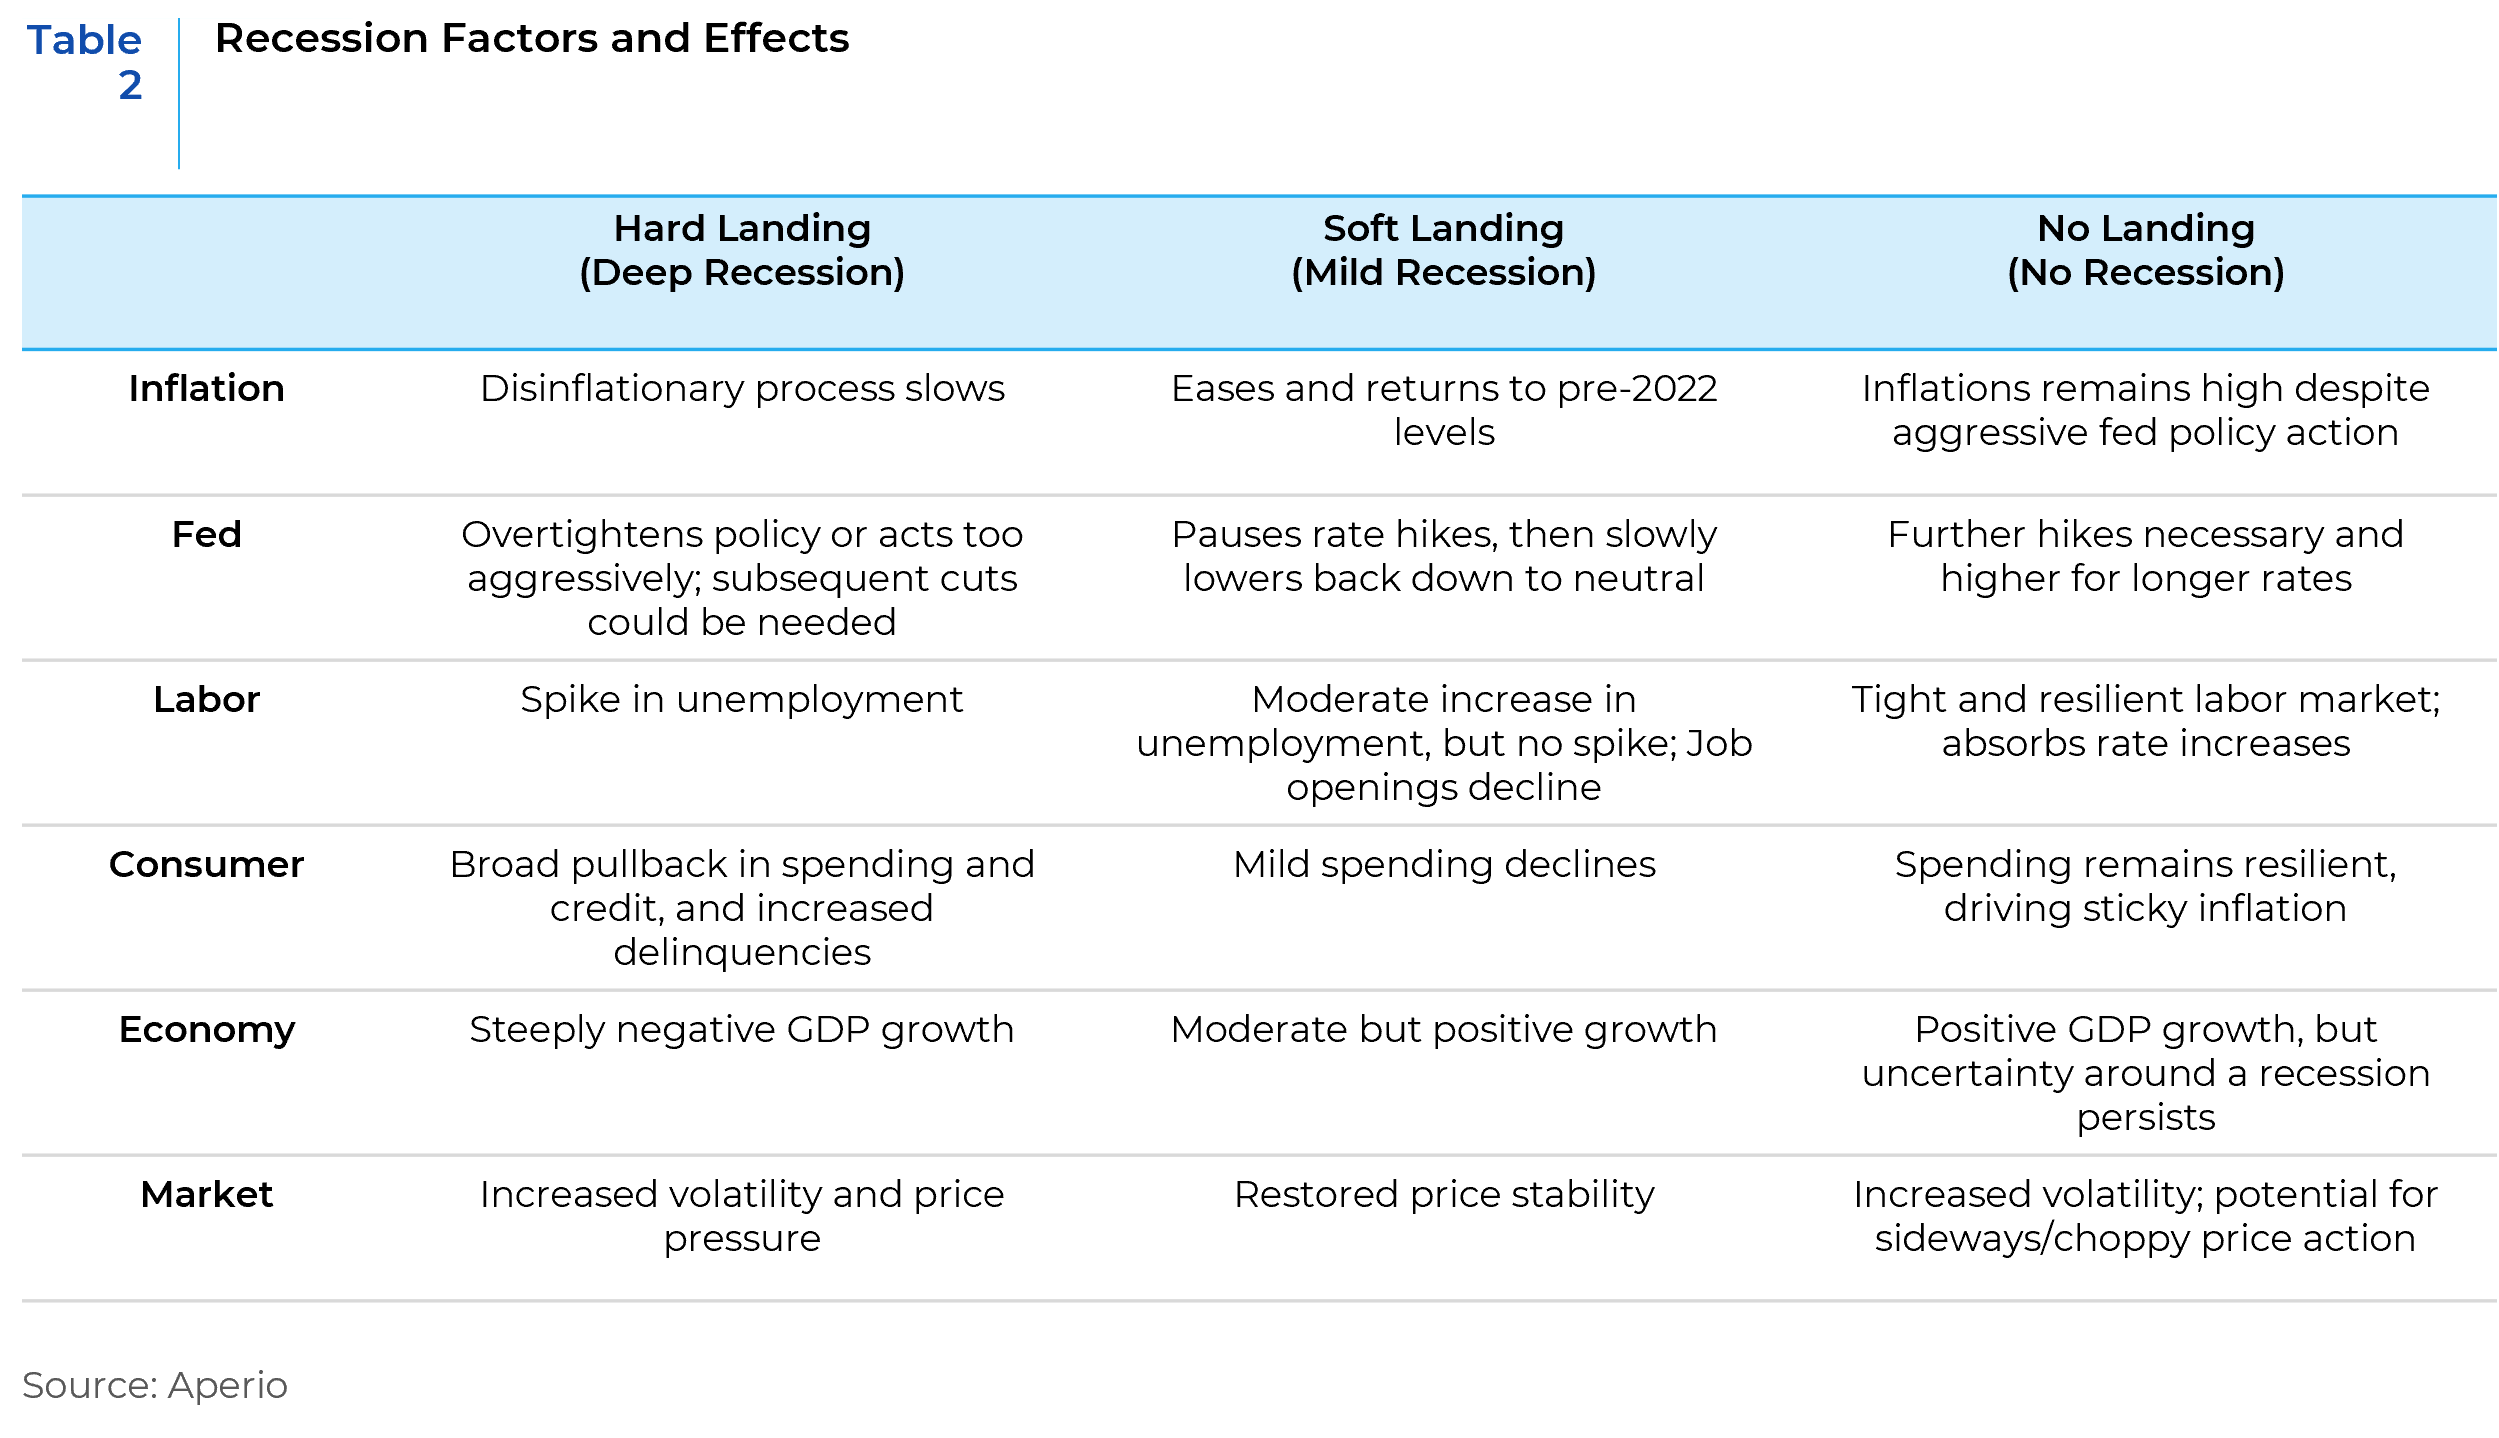
Amidst a general sense of macro uncertainty, the debate on recession rages on. While inflation has declined, it is still above the Fed’s target rate. Labor markets appear healthy although some cracks are starting to appear. The Fed is poised to raise rates further even as the yield curve remains inverted. Table 2 outlines three possible scenarios that can unfold in the coming months. While the hard landing and no recession scenarios have their proponents, the soft-landing scenario that includes the possibility of a mild recession seems to be gaining the most traction in the marketplace. Against the backdrop of mixed economic signals, most investors appear to be optimistic about the Fed’s ability to avoid a deep recession.
Inflation – Slowing but Still Elevated
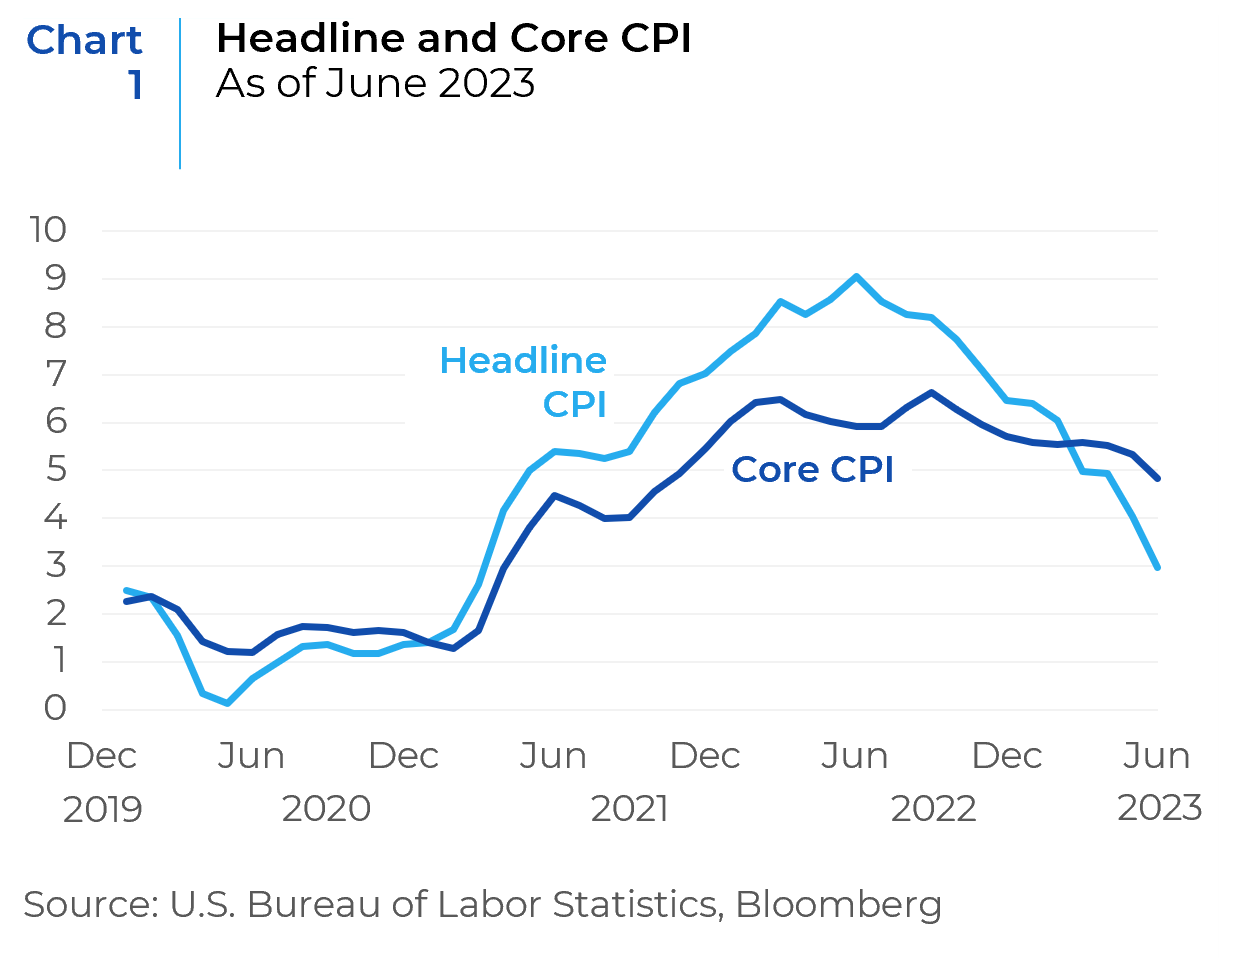
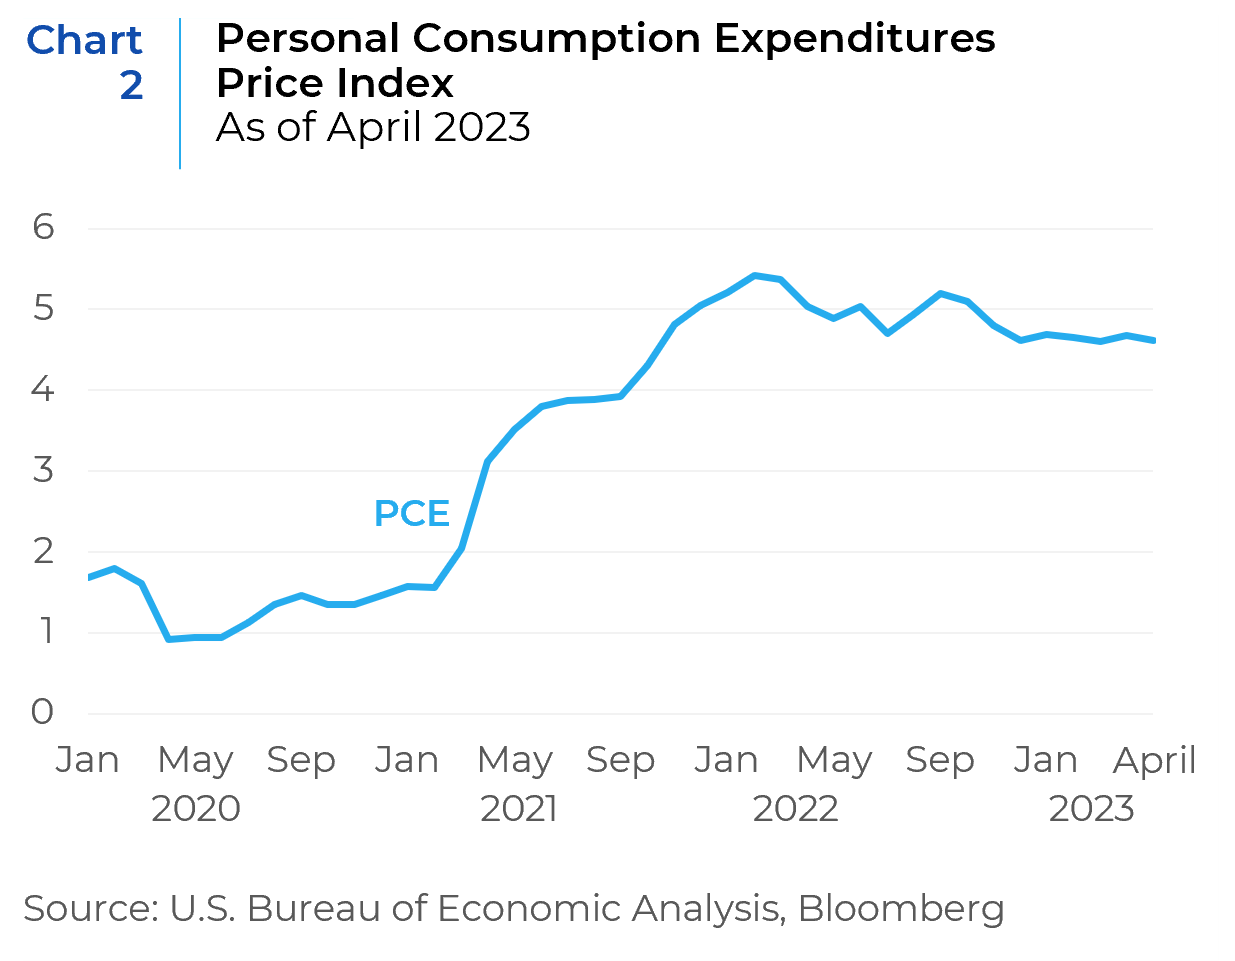
While the headline Consumer Price Index (CPI) YoY inflation peaked at 9.1% in June 2022, and moderated to 3.0% in June 2023, the Core CPI index remains elevated at 4.8% (Chart 1). The PCE Price index (Chart 2) also remains well above pre-pandemic levels, suggesting the presence of sustained inflationary pressure. The PCE Price index is the Federal Reserve’s preferred measure of inflation as they focus on core inflation and see it as a better predictor of future inflation than the headline CPI or overall inflation rate.
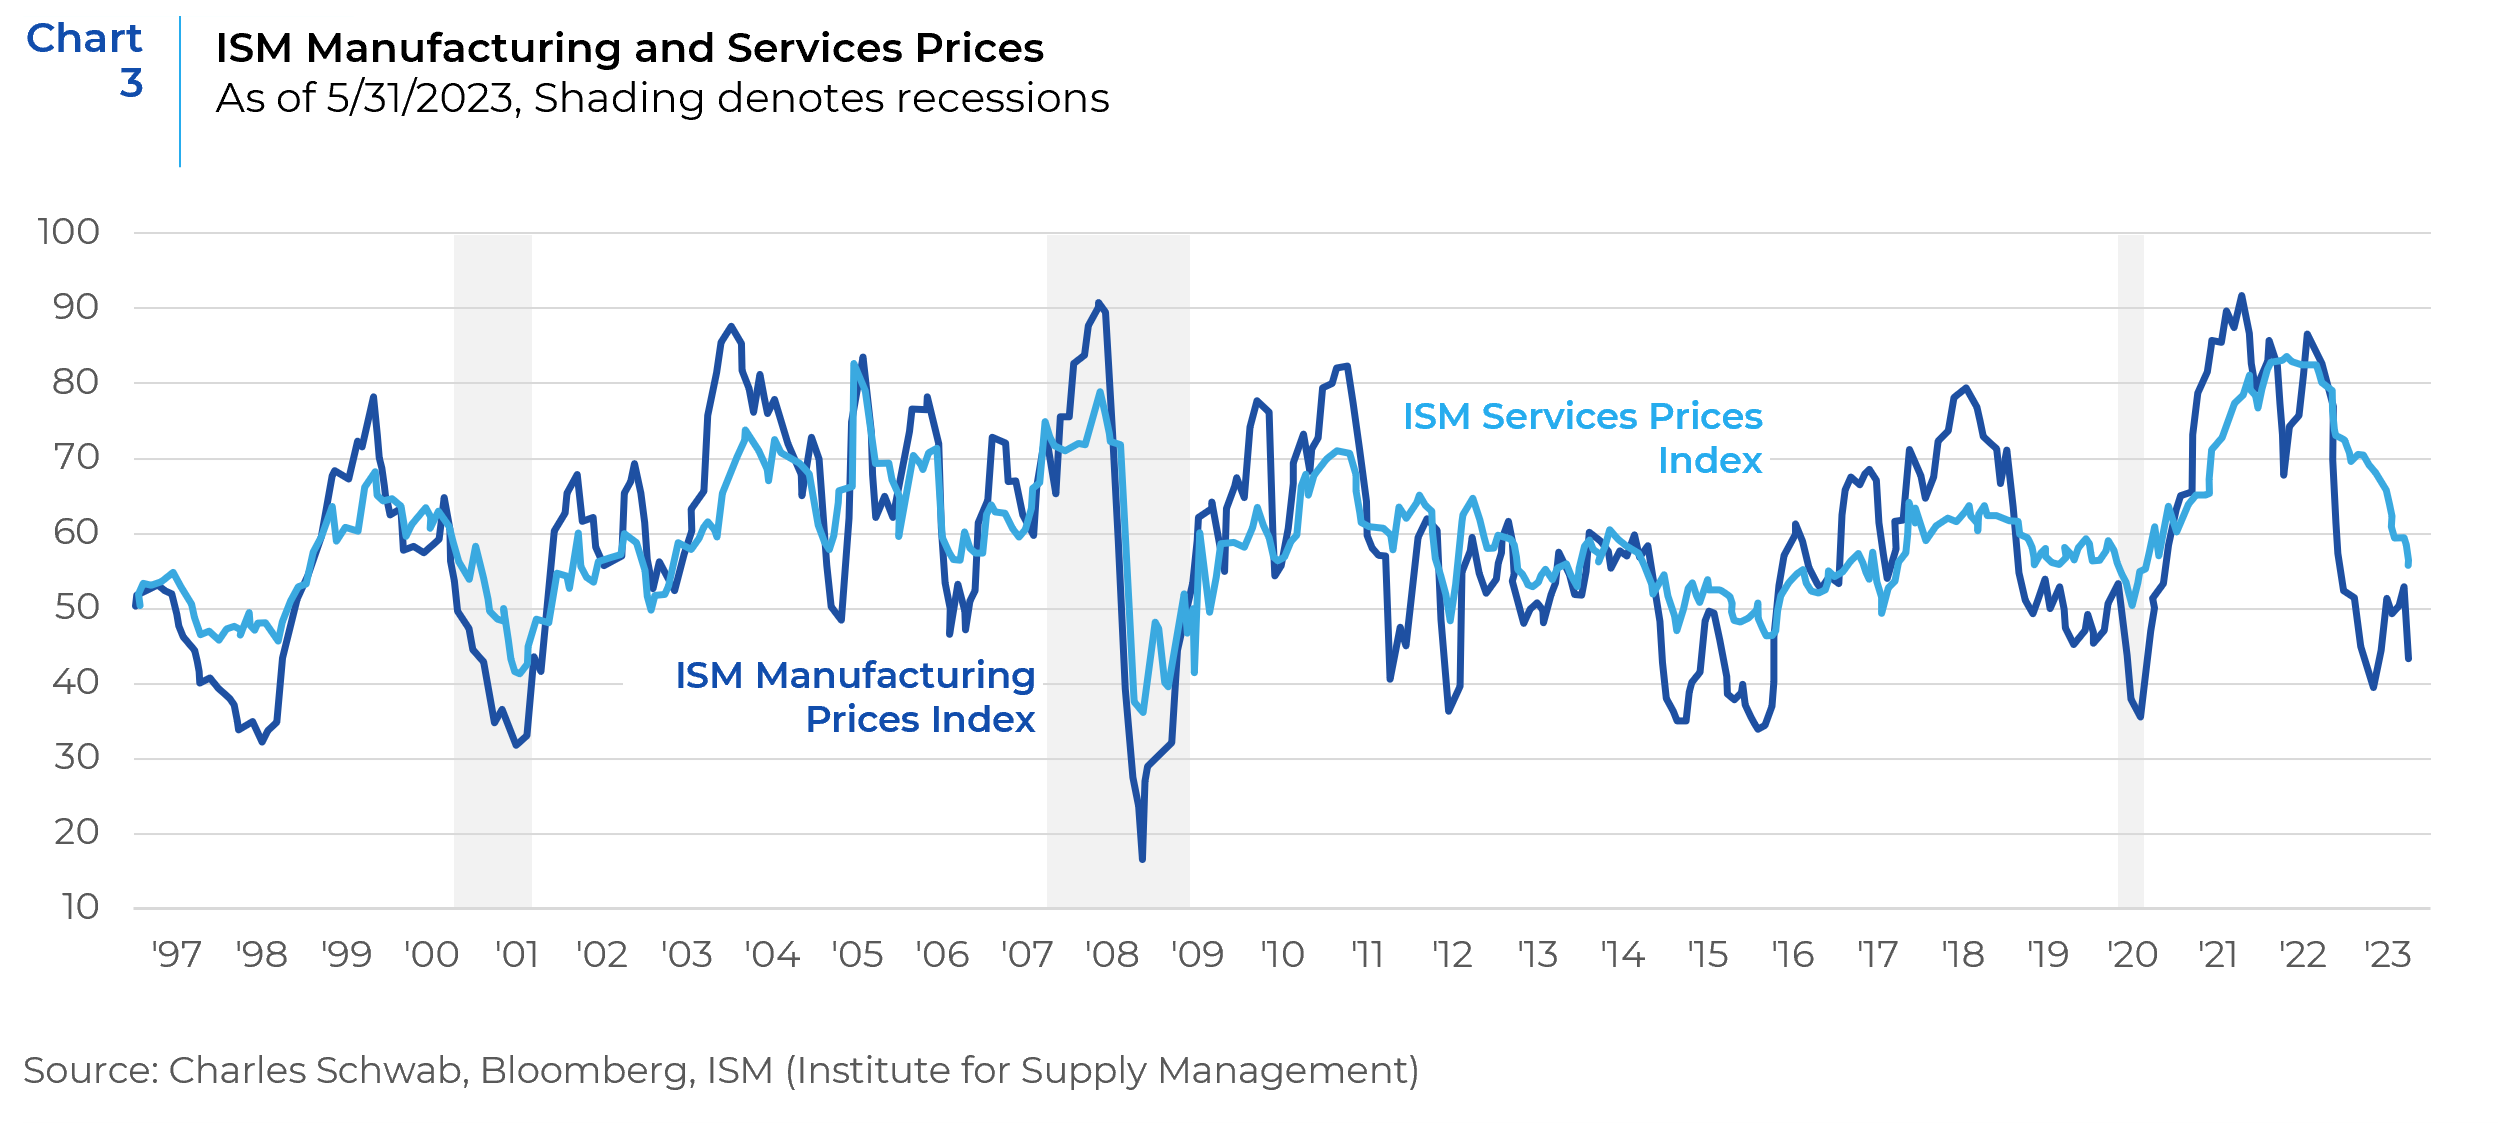
Evidence of slowing inflation can be seen in the ISM Price Indices (Chart 3). For example, prices within the manufacturing sector are contracting; services prices are easing but not yet contracting. While this bodes well for the direction of inflation, there is another aspect that needs to be taken into consideration. A significant decline in both ISM prices components has historically presaged a recession.
Labor Markets – Robust but Starting to Show Cracks
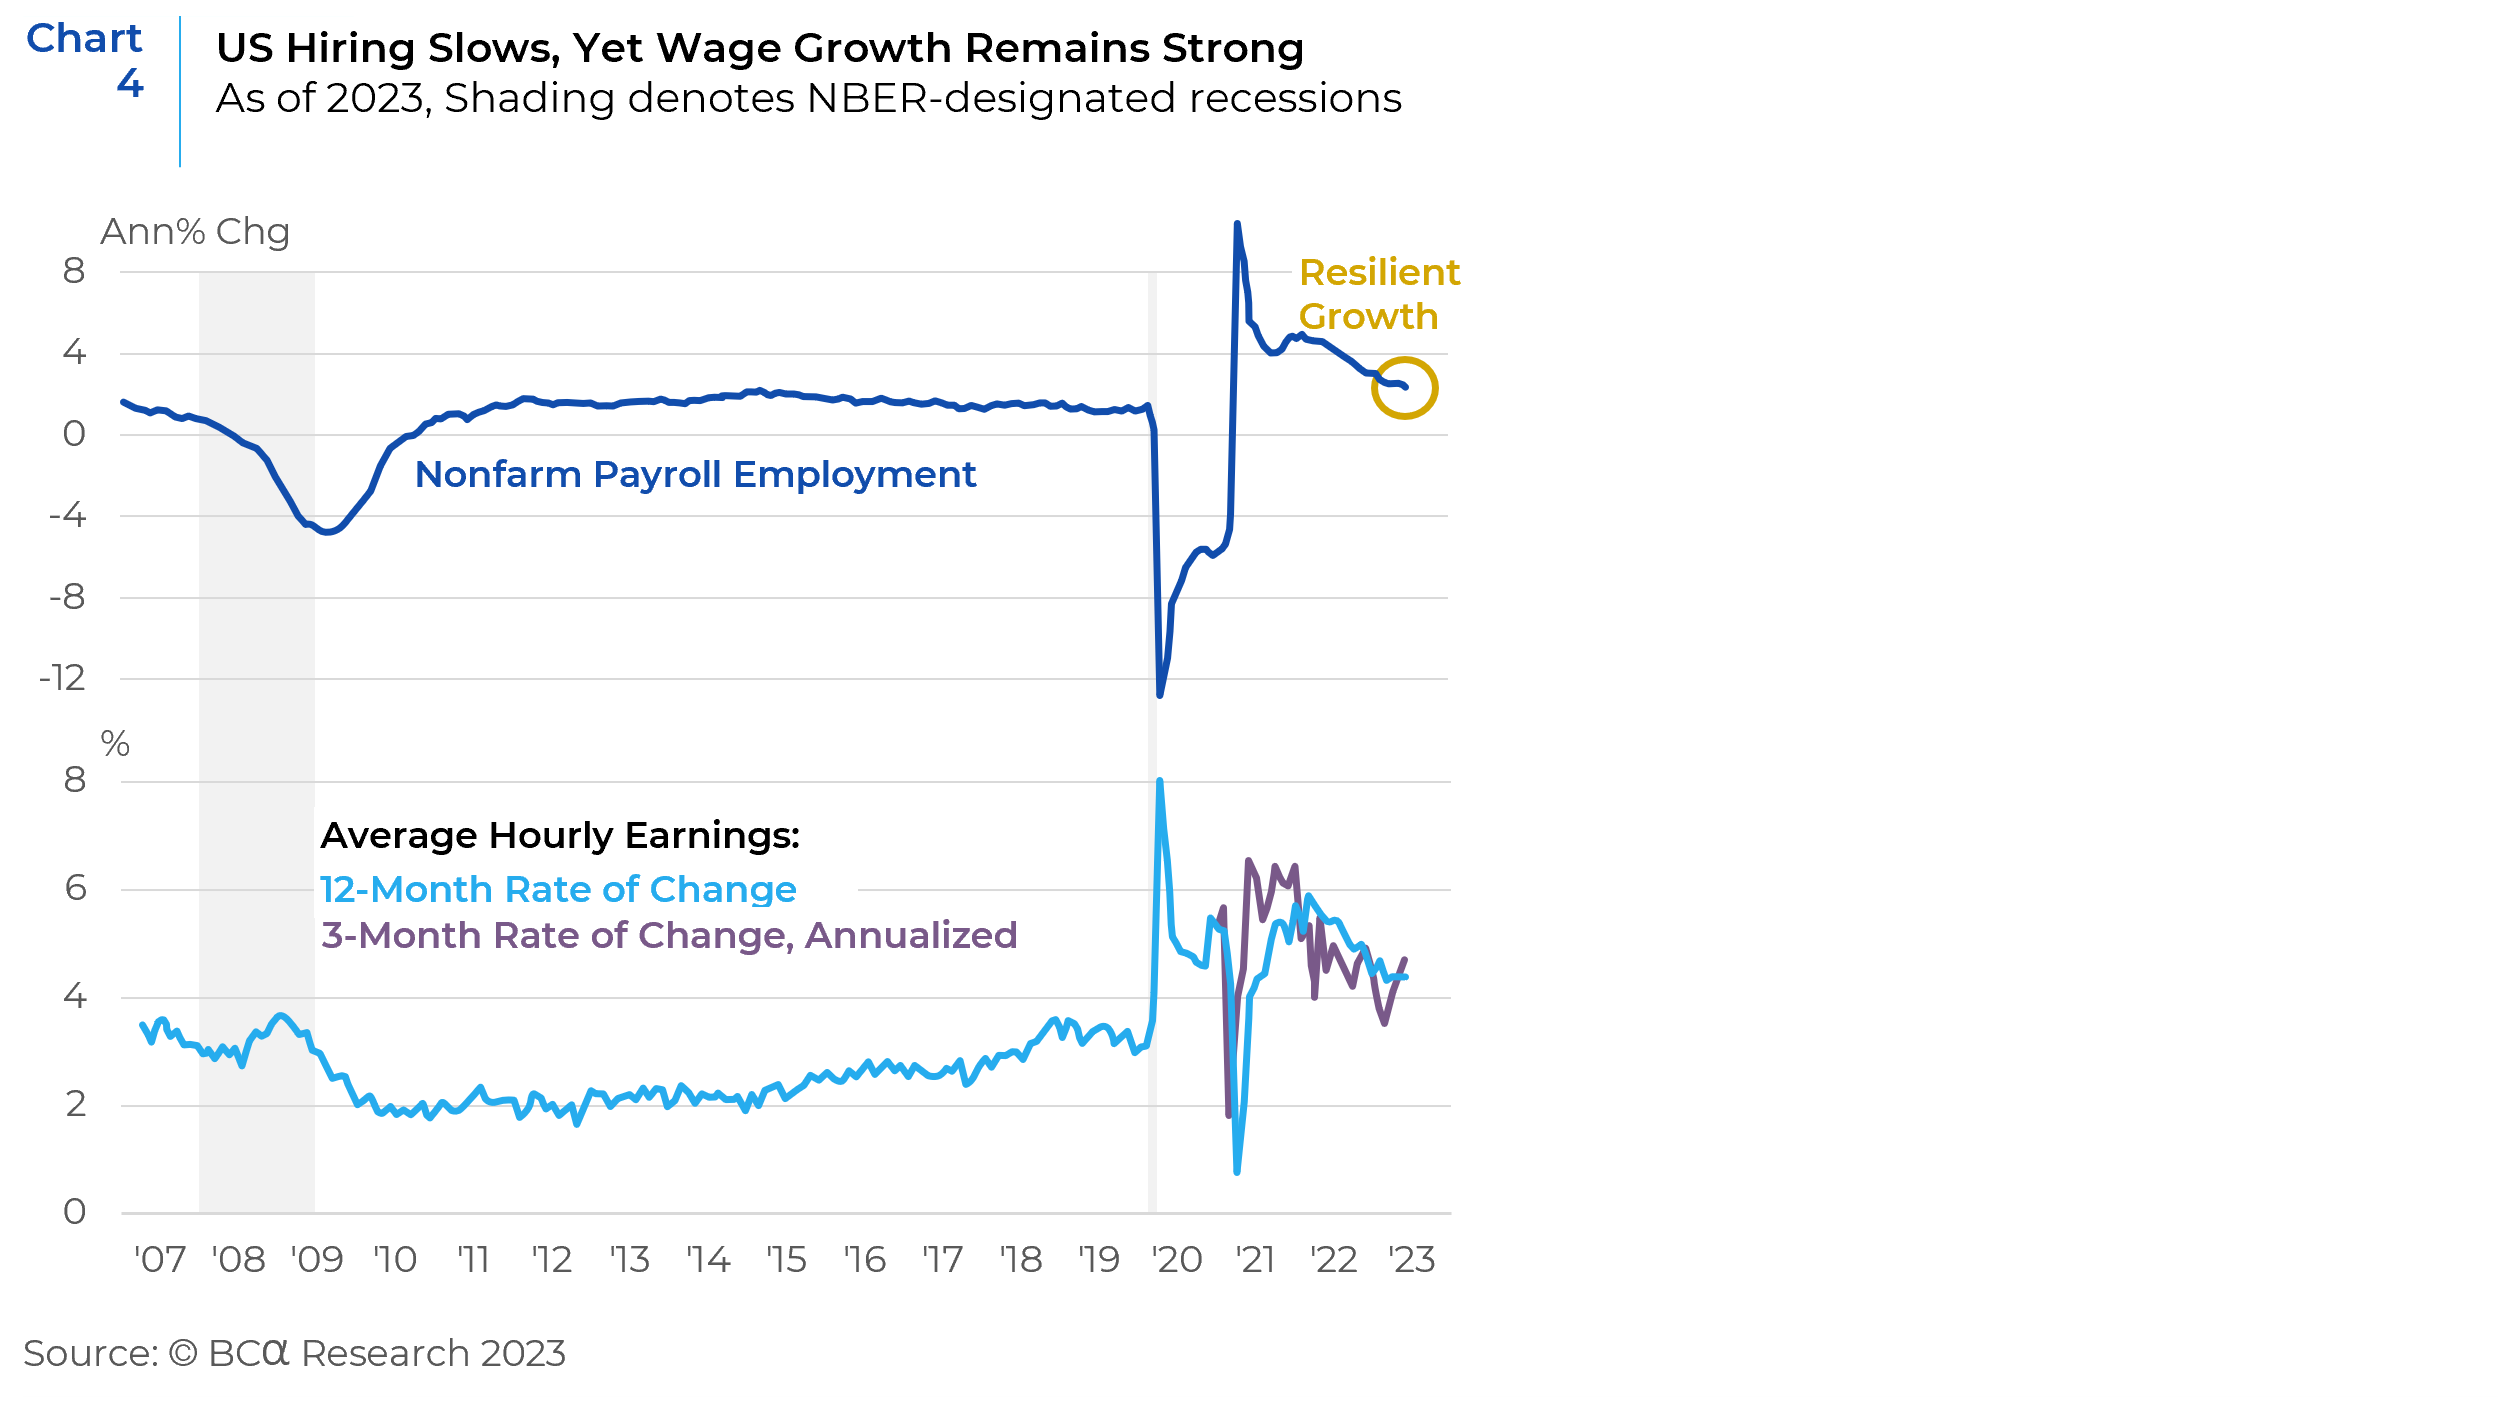
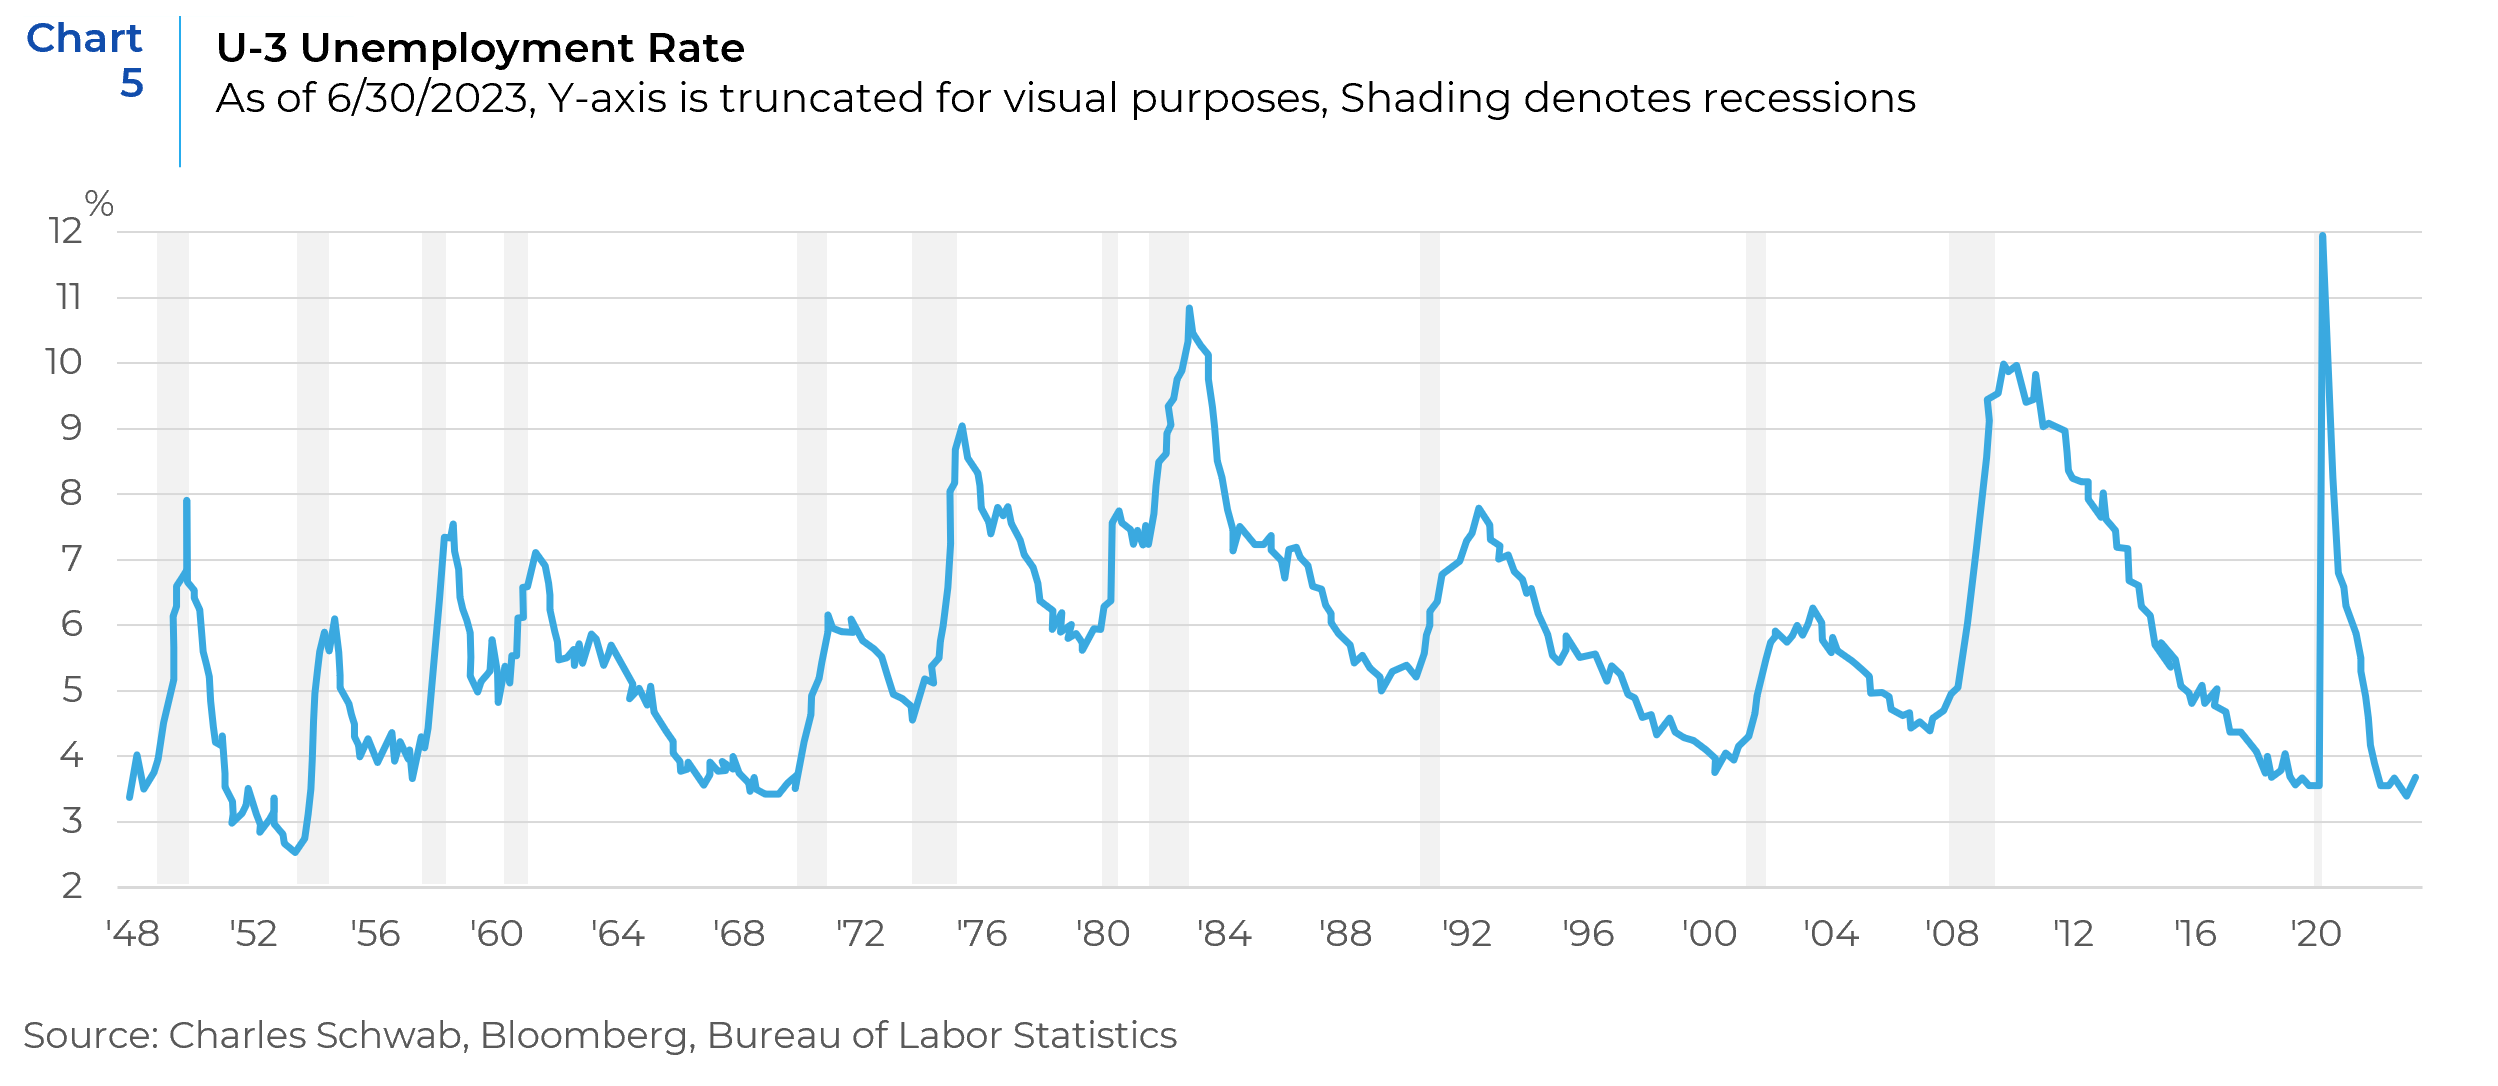
Labor markets continue to remain resilient which implies that the Fed is likely to maintain policy at restrictive levels. While hiring trends have softened, average hourly earnings are strong and continue to exert price pressure (Chart 4). The combination of solid wage growth and a low unemployment rate suggests the Fed’s job is not done (Chart 5).
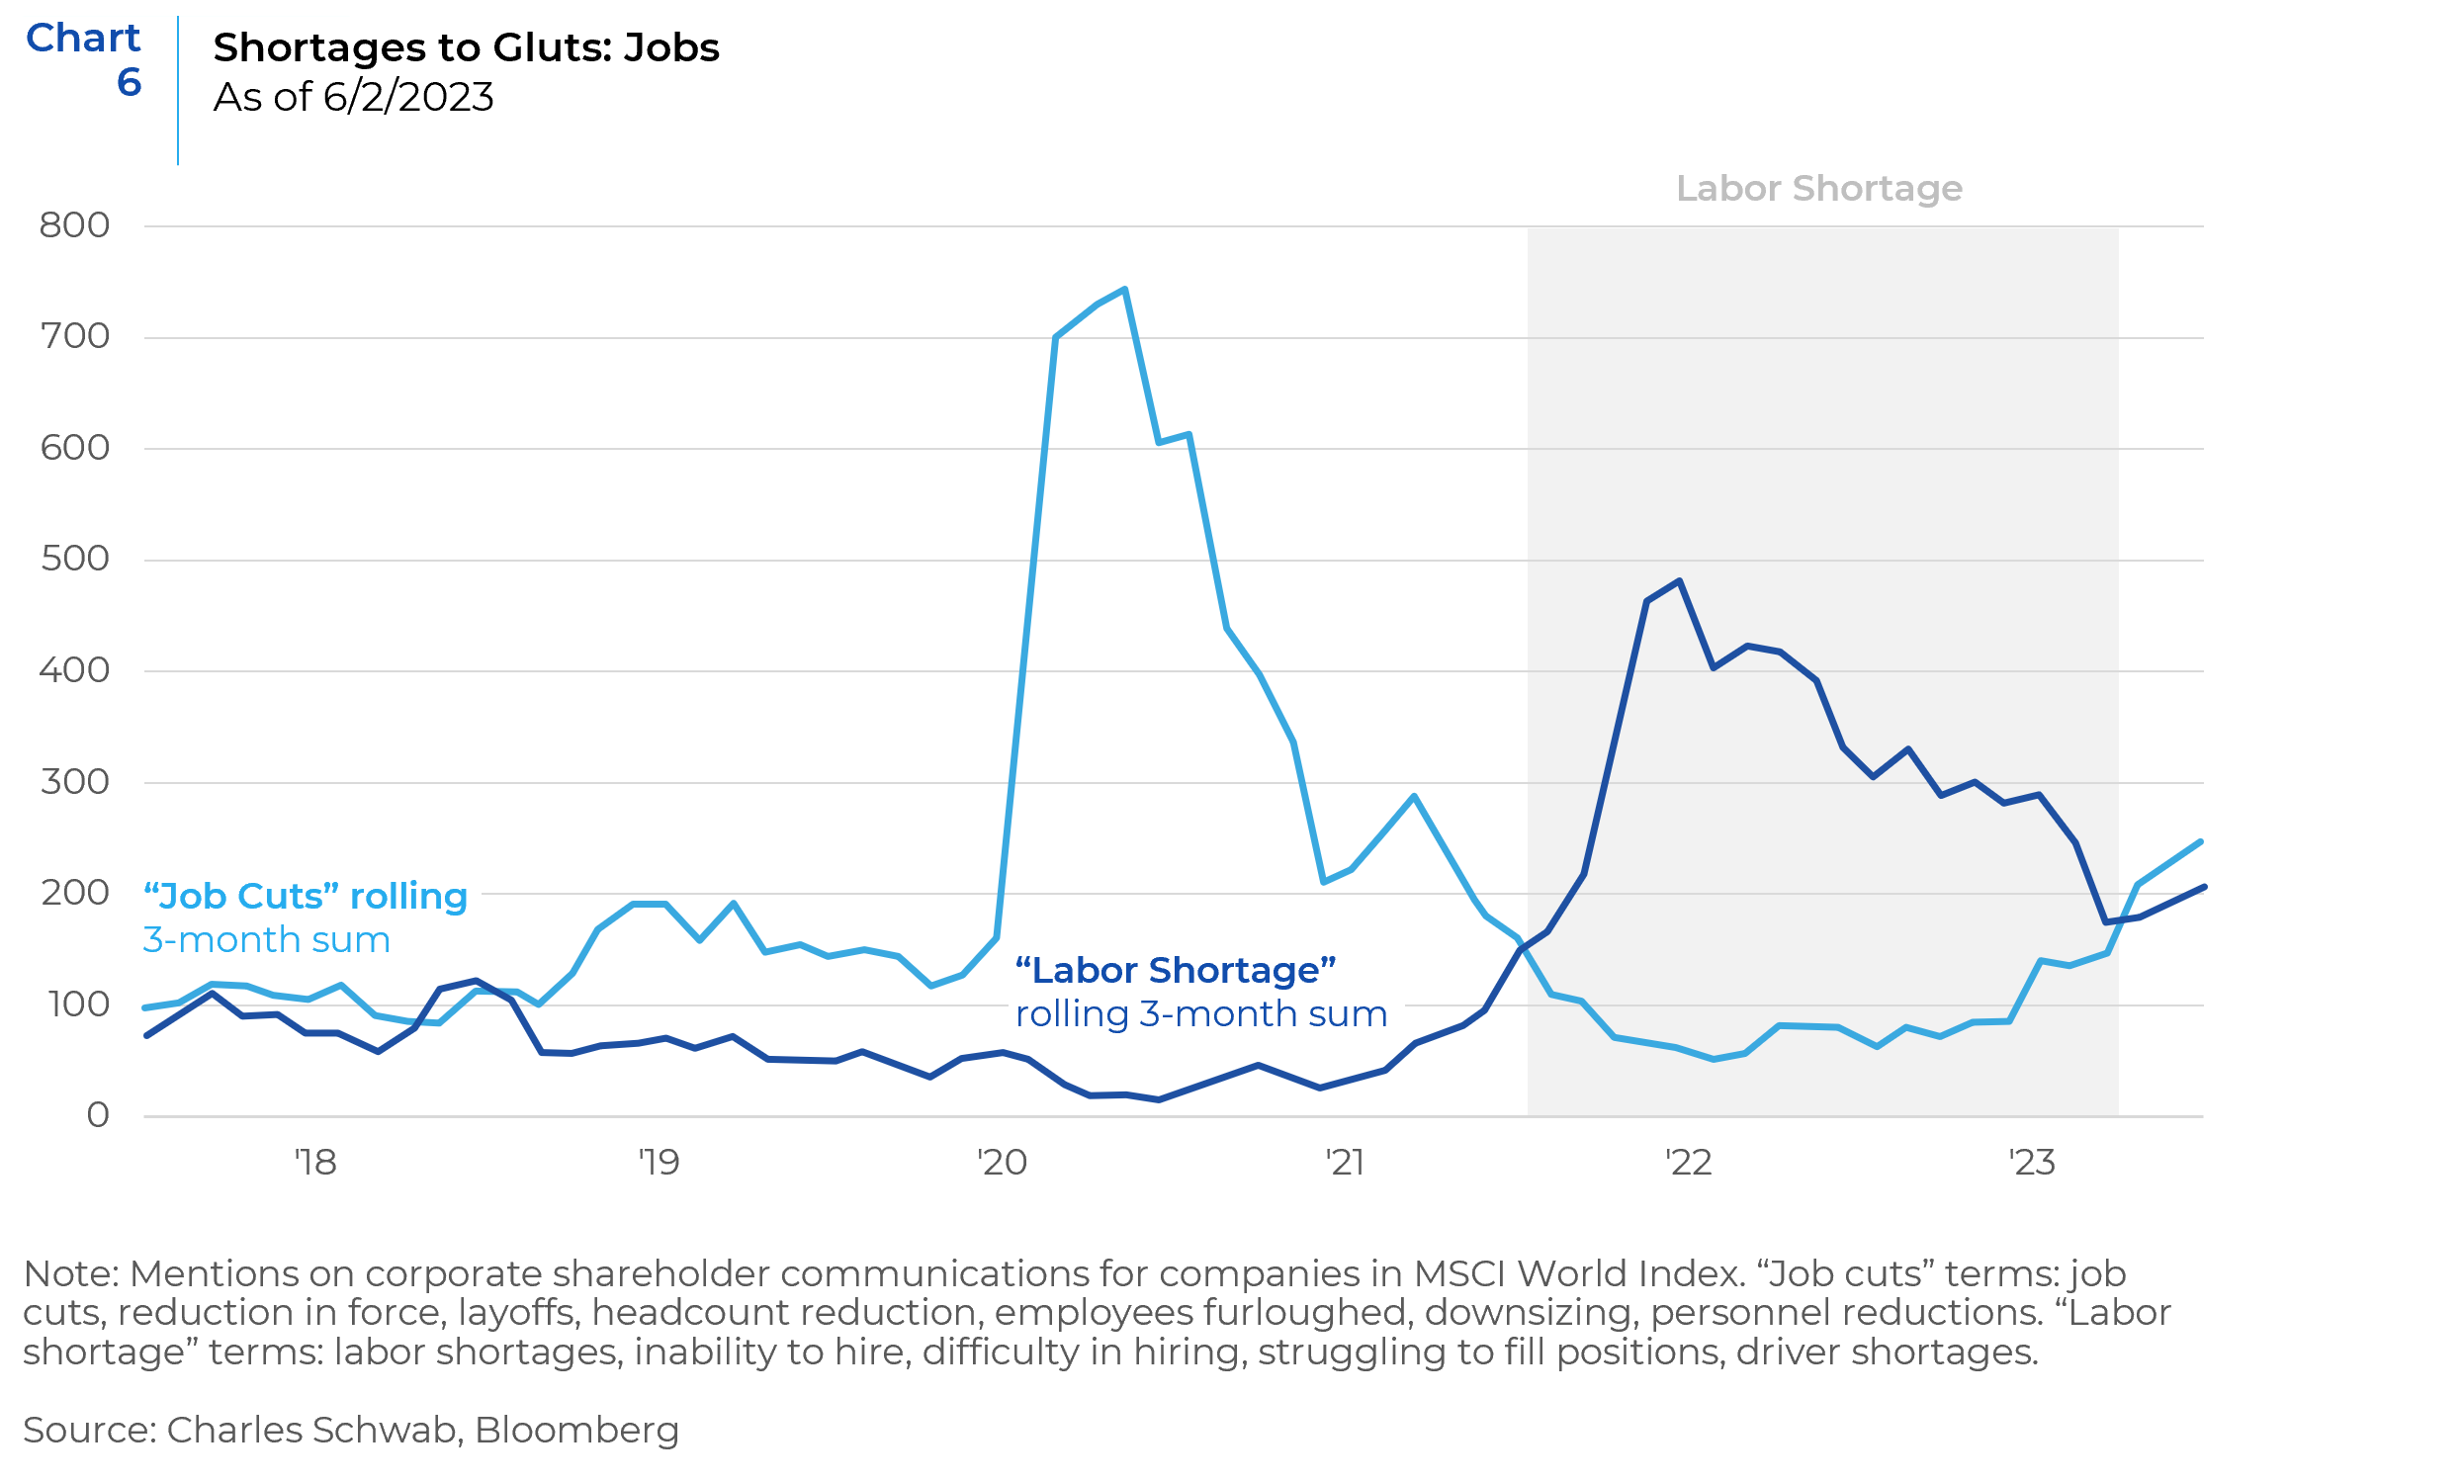
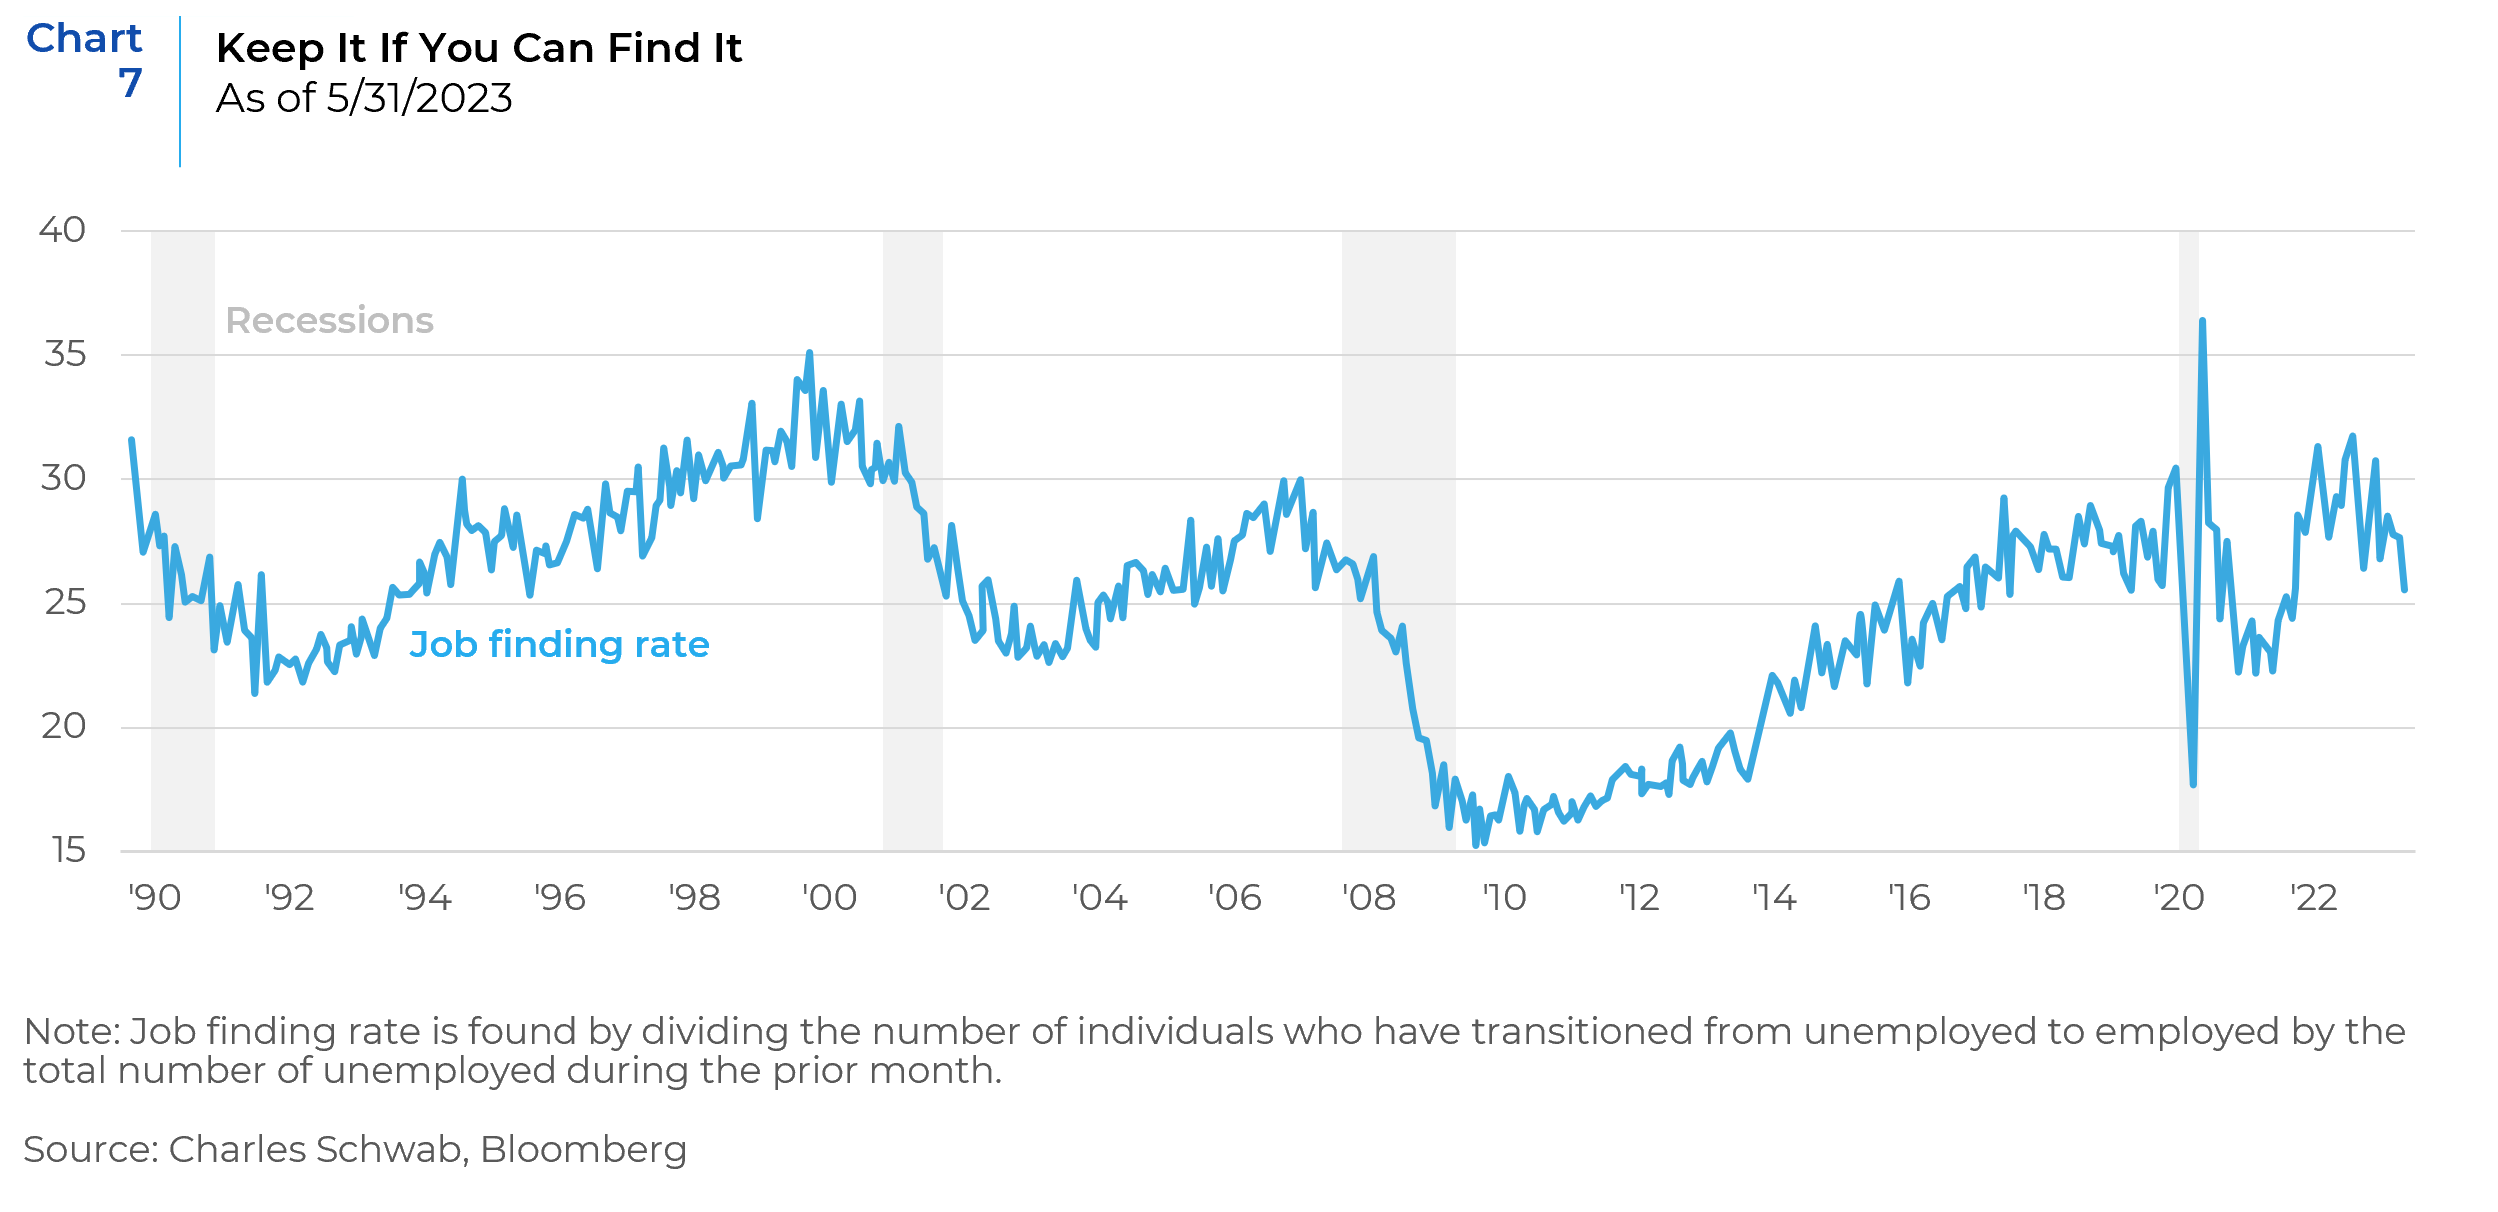
However, the first cracks in the labor markets are starting to appear. Job cuts are trending up and labor shortage numbers are trending down (Chart 6). In addition, the job-finding rate—which shows how many individuals who were previously unemployed are now able to find a job—has weakened and is at its lowest since September 2021 (Chart 7). That’s consistent with the average in the years leading up to the pandemic, but the magnitude of the decline from the recent peak is increasingly reminiscent of recessionary behavior. If the rate continues to move lower and jobless claims move higher, the cracks in the labor market may start to widen, giving way to weaker payroll growth.
Economic Growth – Growing but Starting to Slow
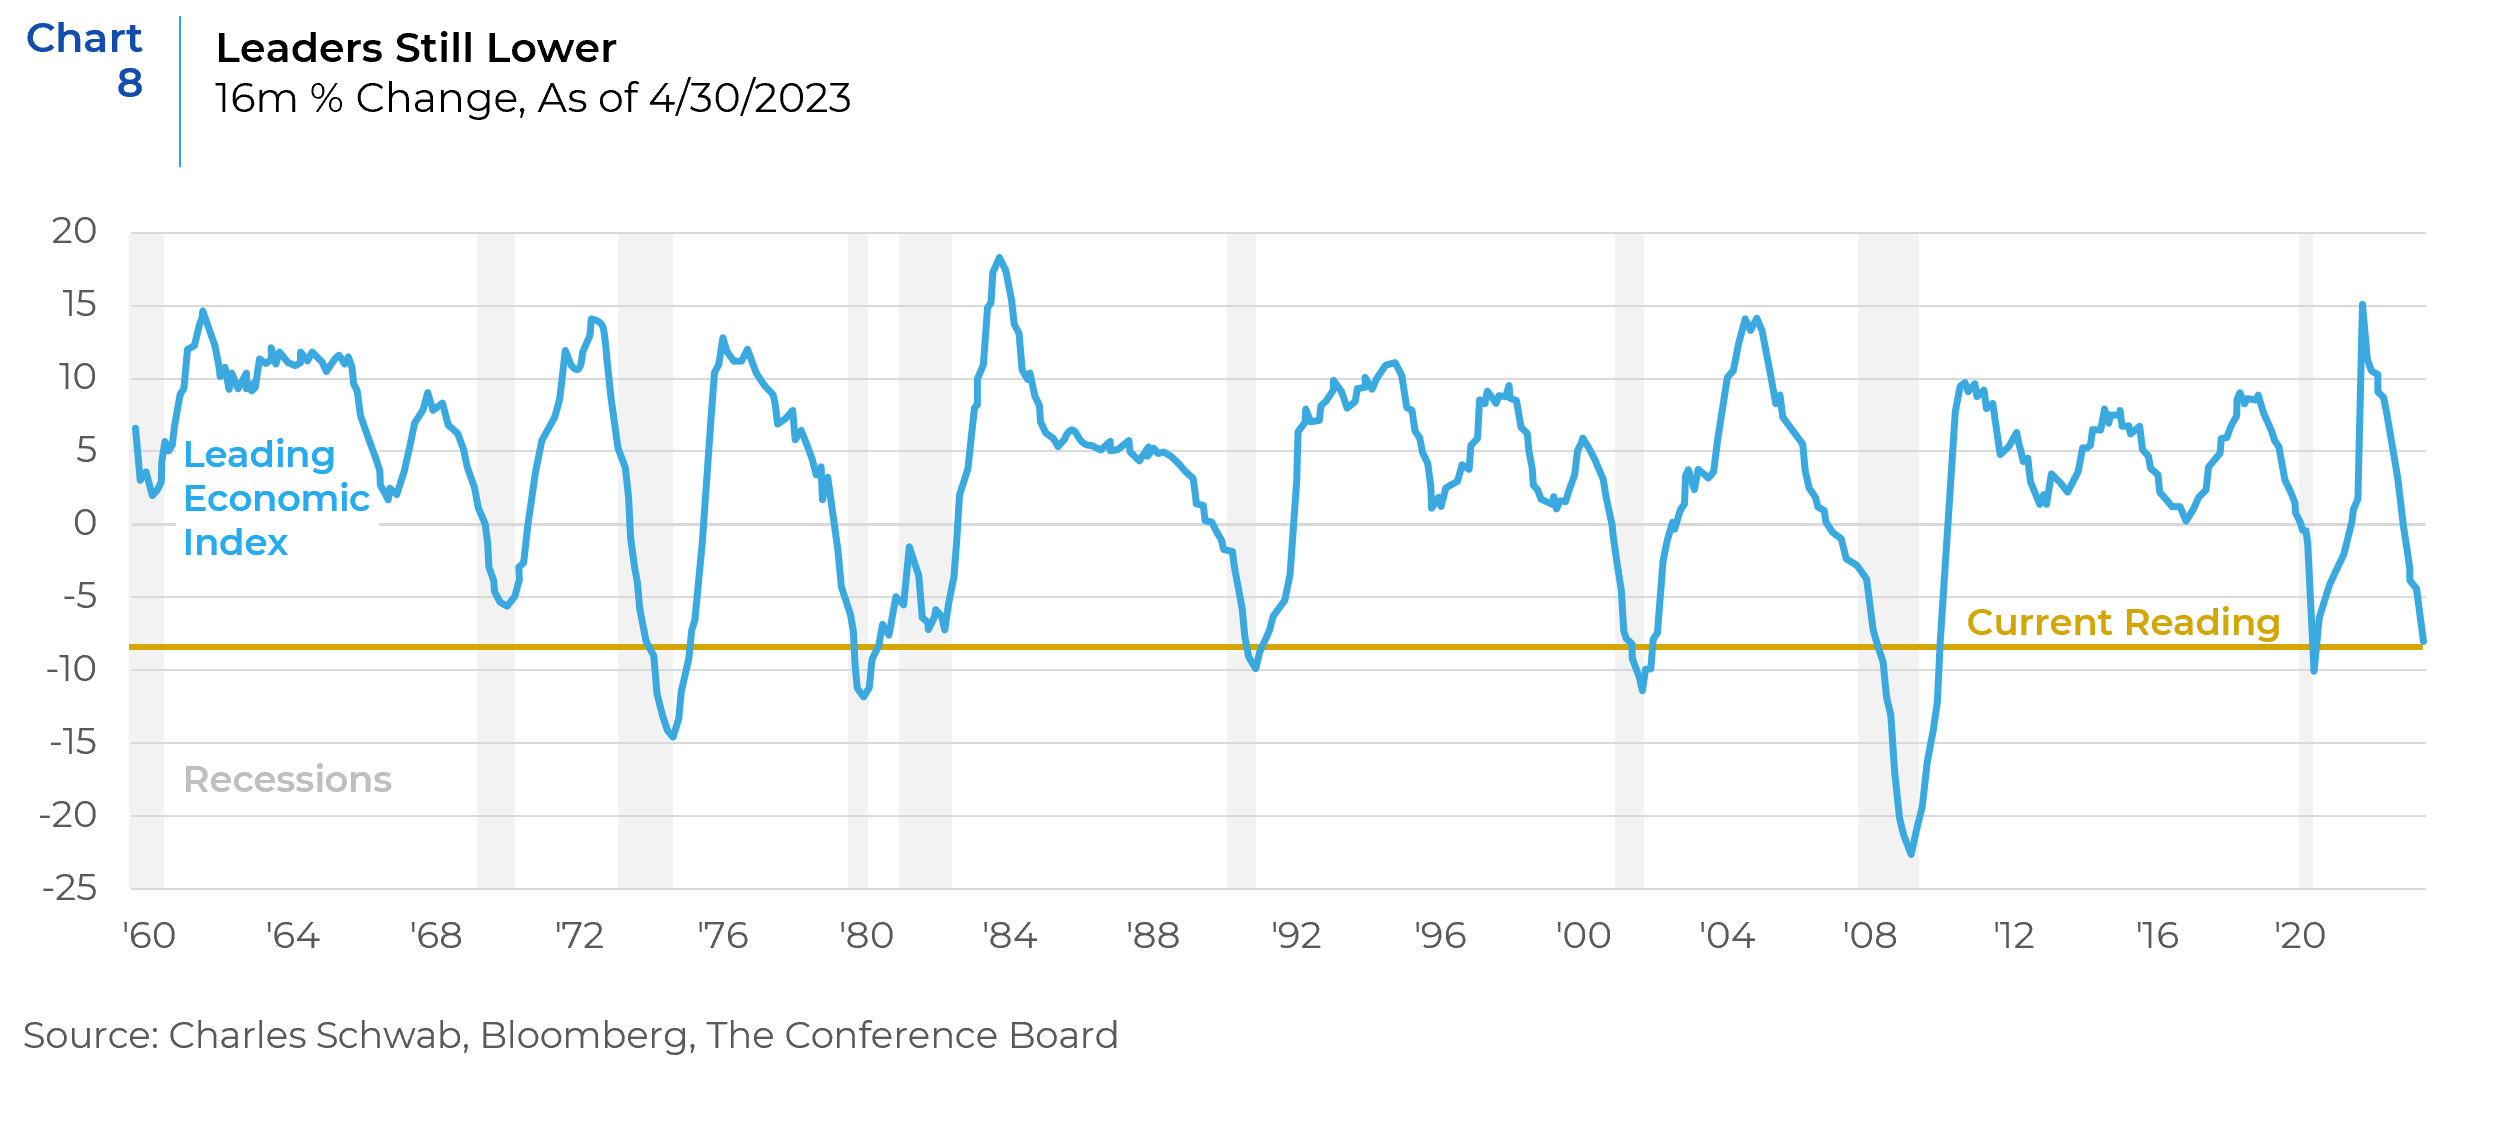
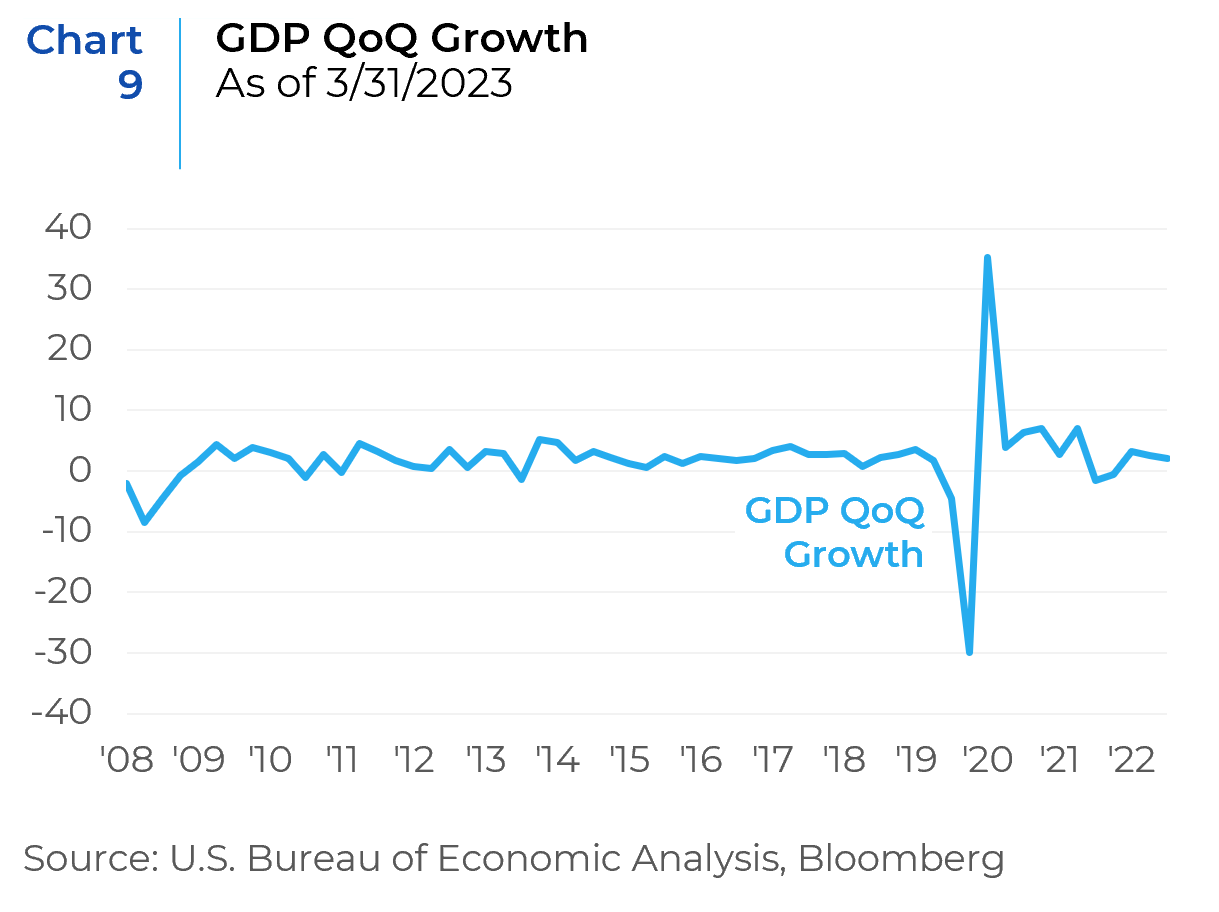
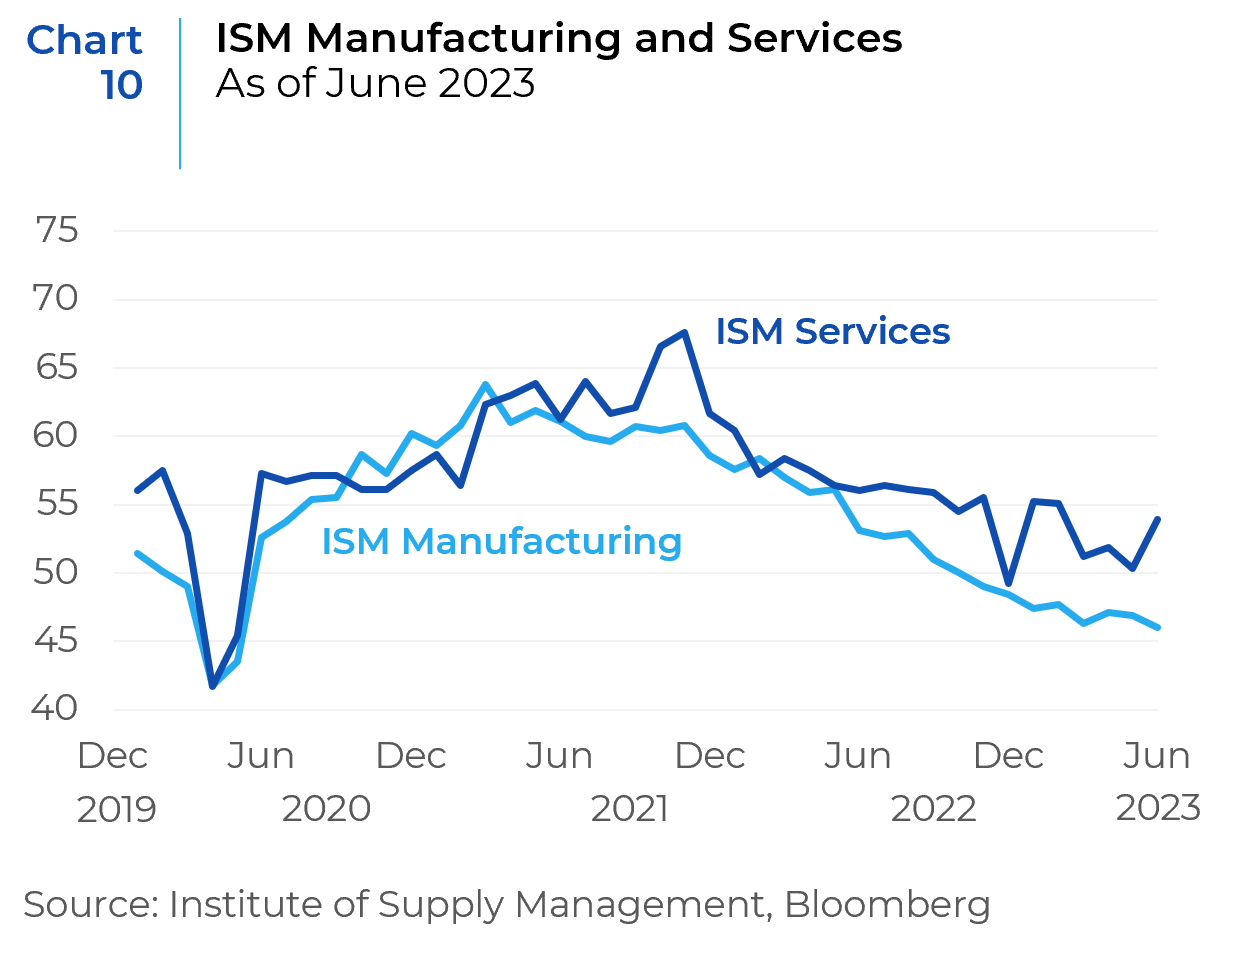
The Conference Board’s Leading Economic Index (LEI)—which historically has a solid track record of leading economic tops and bottoms—is down nearly 10% from its peak 16 months ago (Chart 8). The GDP growth rate has been falling since the end of 2020, standing at 2.0% as of the last data point (Chart 9). The ISM Manufacturing and ISM Services indices have also dropped, indicating a slowing manufacturing and service sector (Chart 10). All these indicators suggest that while the economy is still growing, the rate of growth is starting to slow.
Yield Curve – Continuing to Signal Recession
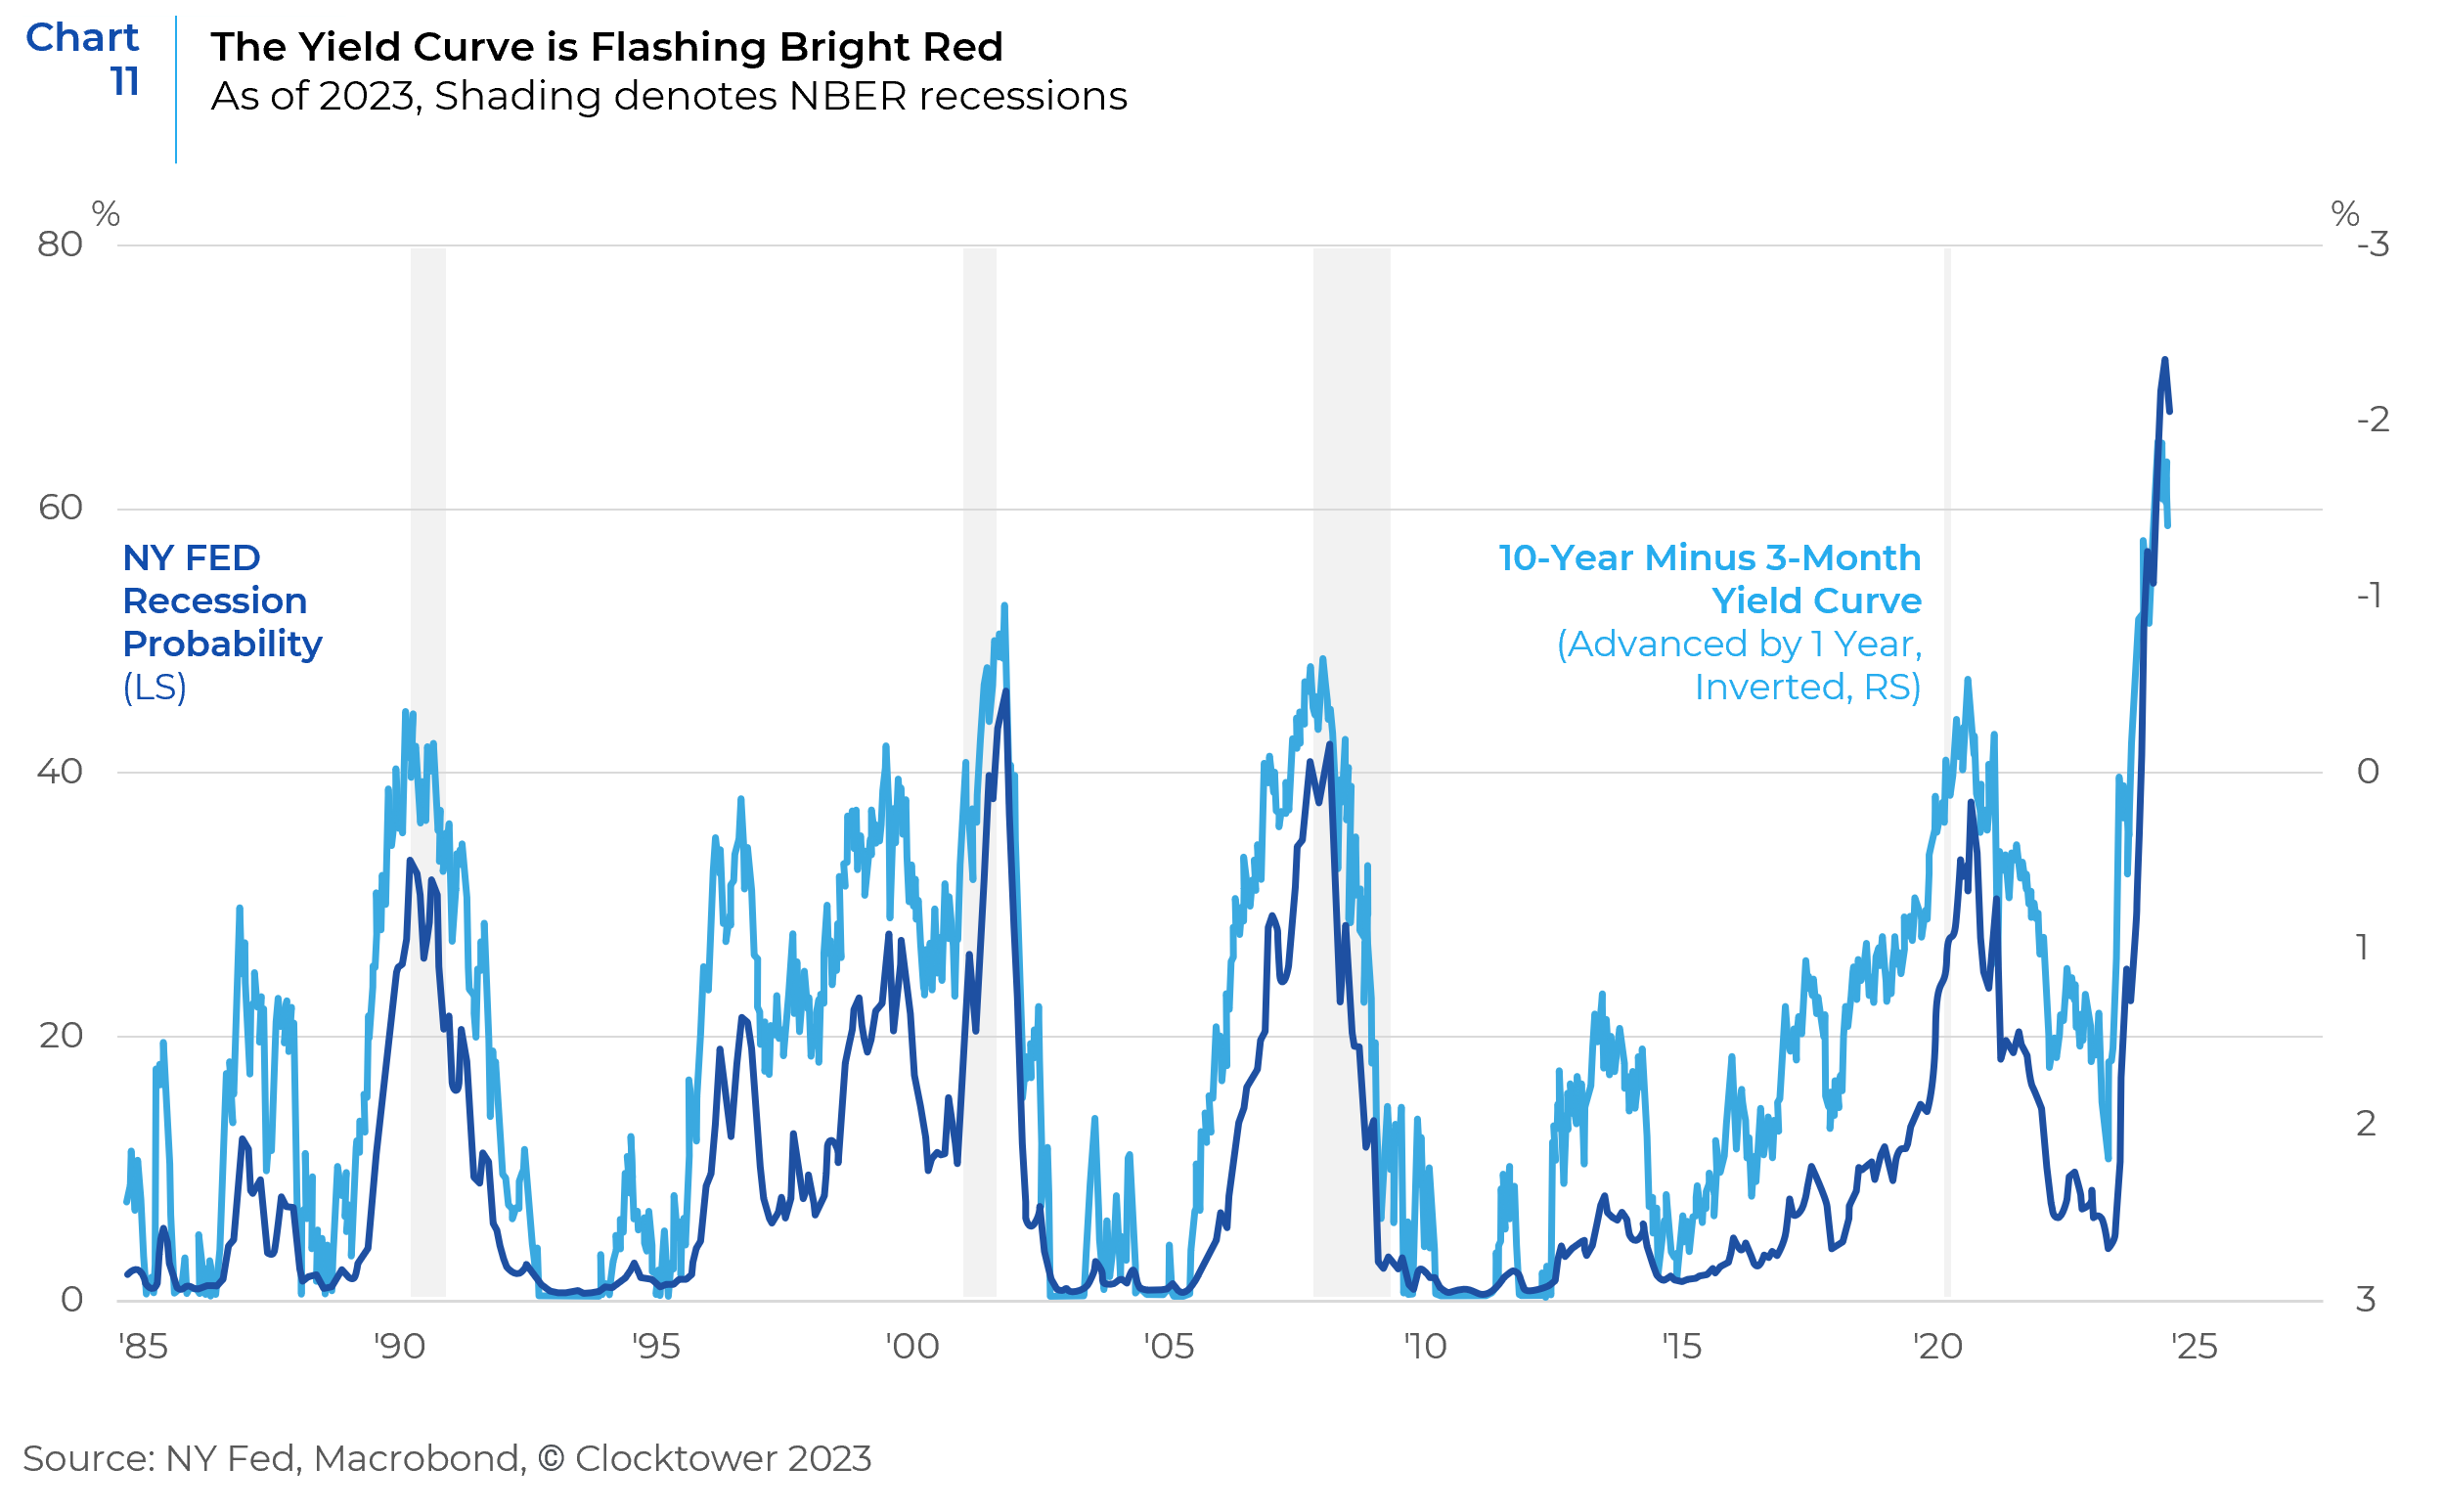
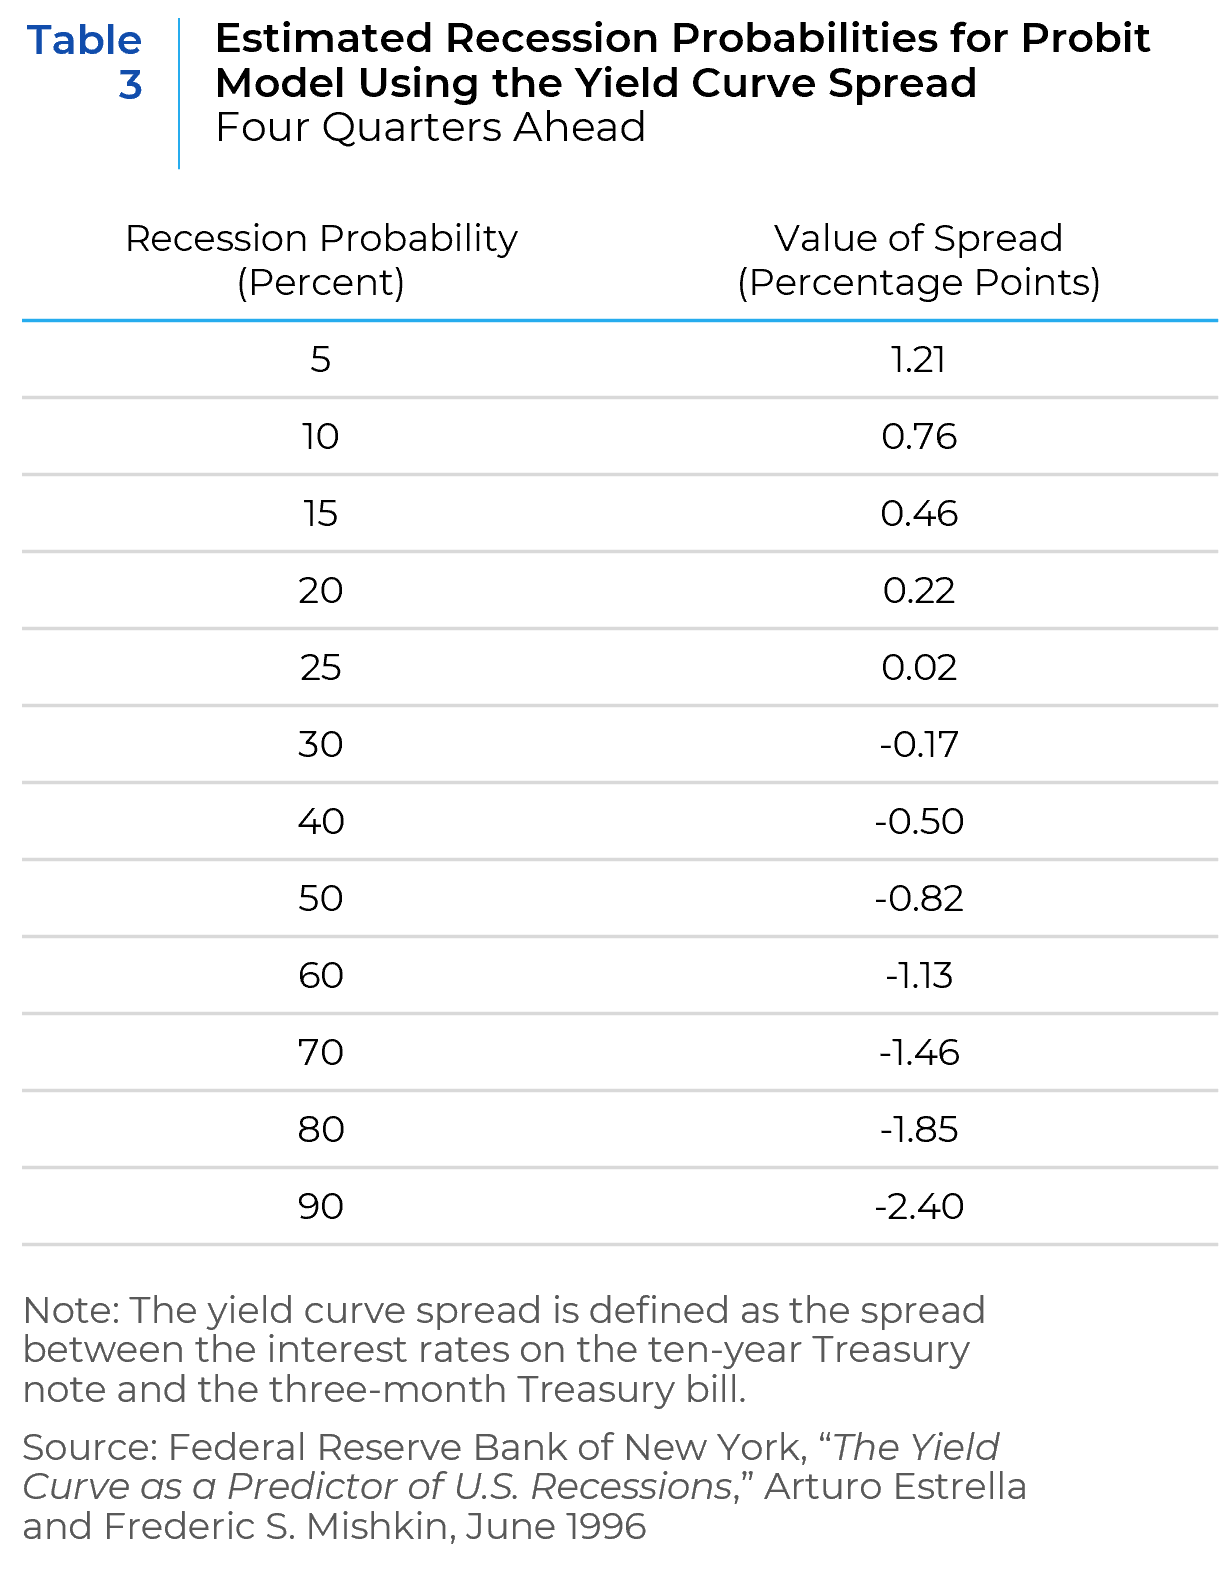
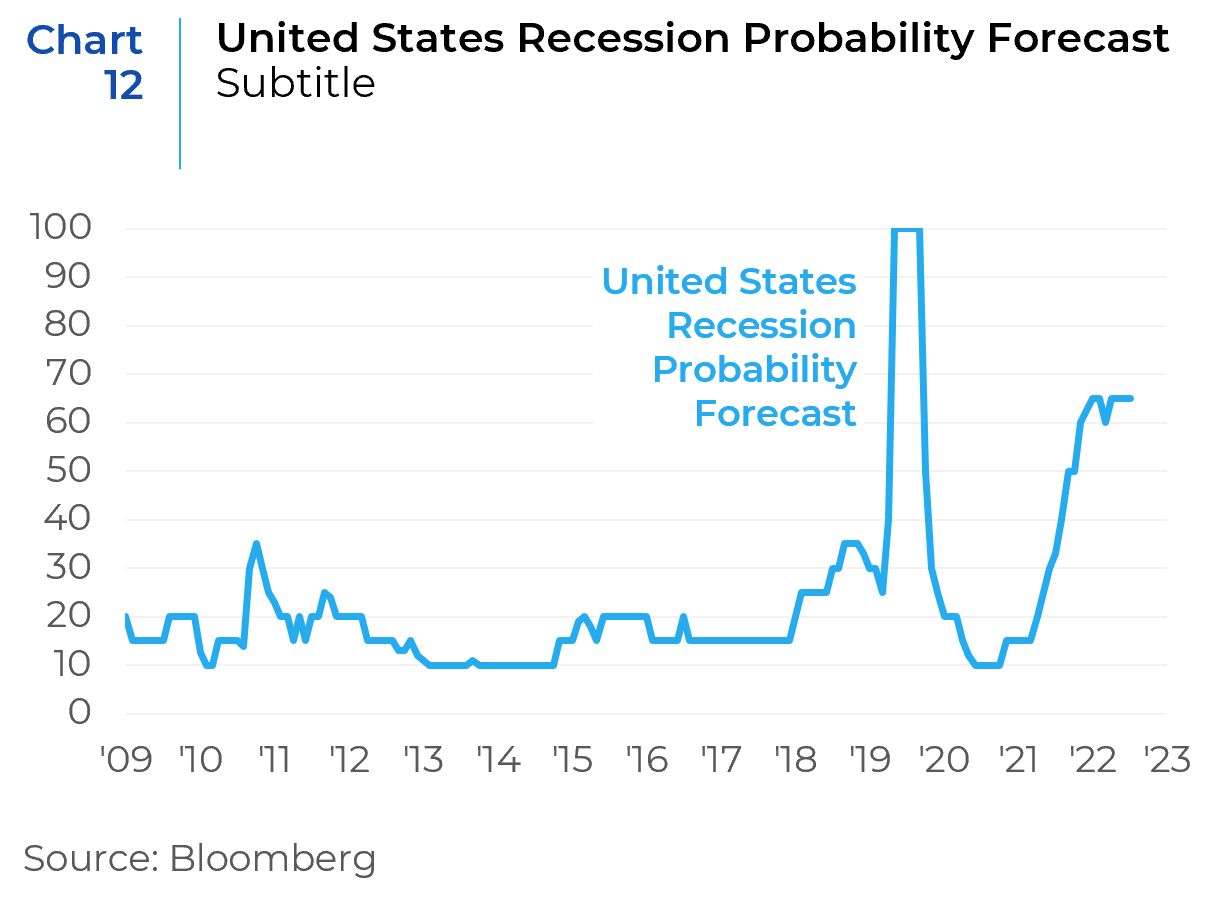
The yield curve has remained inverted at historically high levels (Chart 11). Table 3 shows the probability of a recession depending on the slope of the yield curve. As of June 30th, the spread between the three-month bill and the 10-year note had widened to 1.48%, indicating a probability of recession of around 70%. That’s consistent with a Bloomberg survey of analysts that puts the probability of one occurring within the next 12 months at 65% (Chart 12).
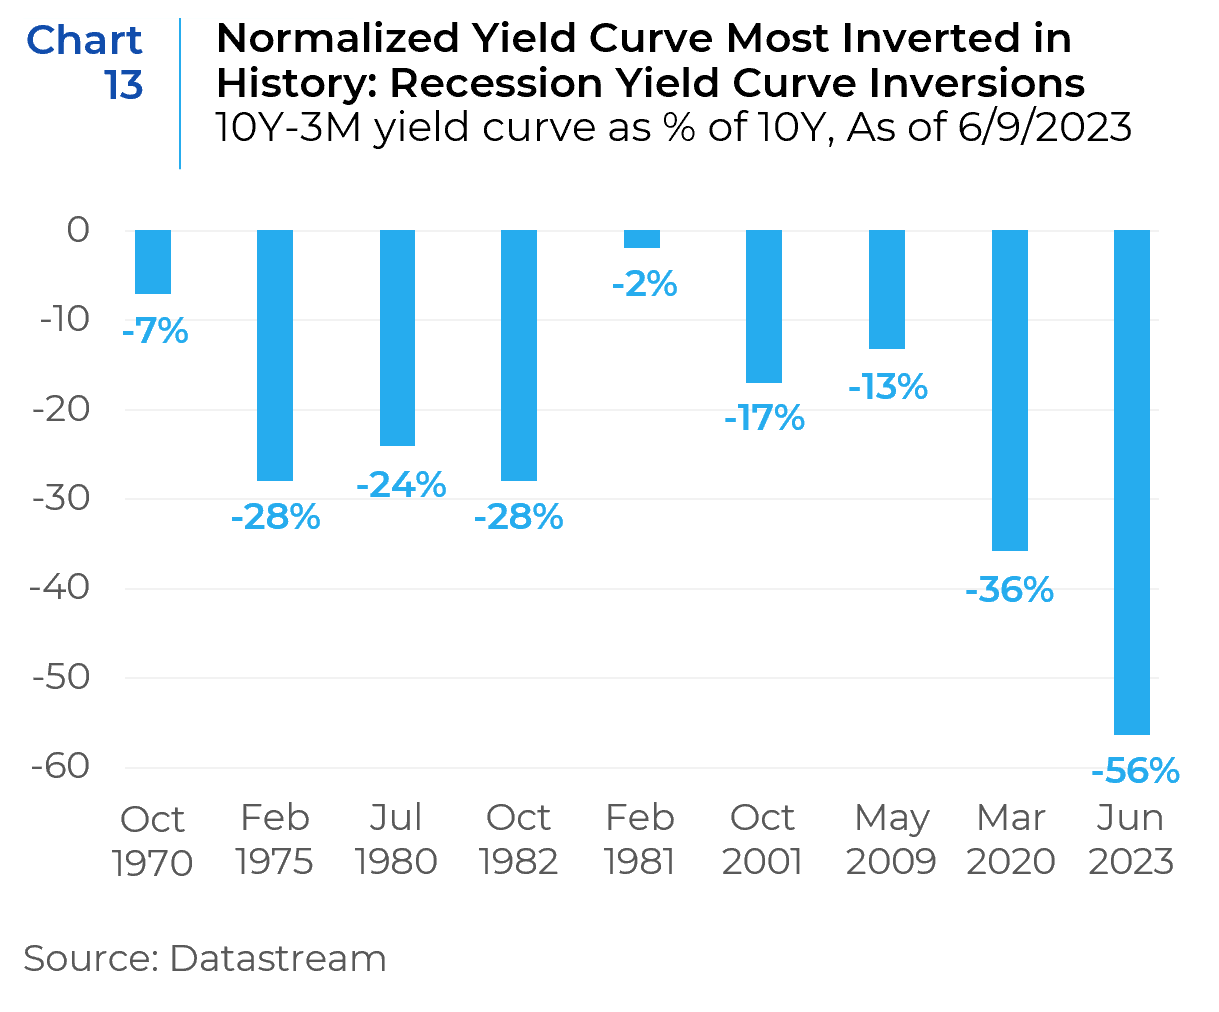
While some discussions suggest that the US may avoid recession, several indicators still point to heightened recession risks. The Treasury yield curve, across its various definitions, is at an unprecedented level of inversion. Though the yield curve is at its deepest inversion in 60 years (Chart 13), the timing of a potential US recession remains uncertain as yield curve inversions tend to be a longer-term leading indicator and recent economic data suggests the economy is still on firm footing.
Market Concentration & Artificial Intelligence (AI)
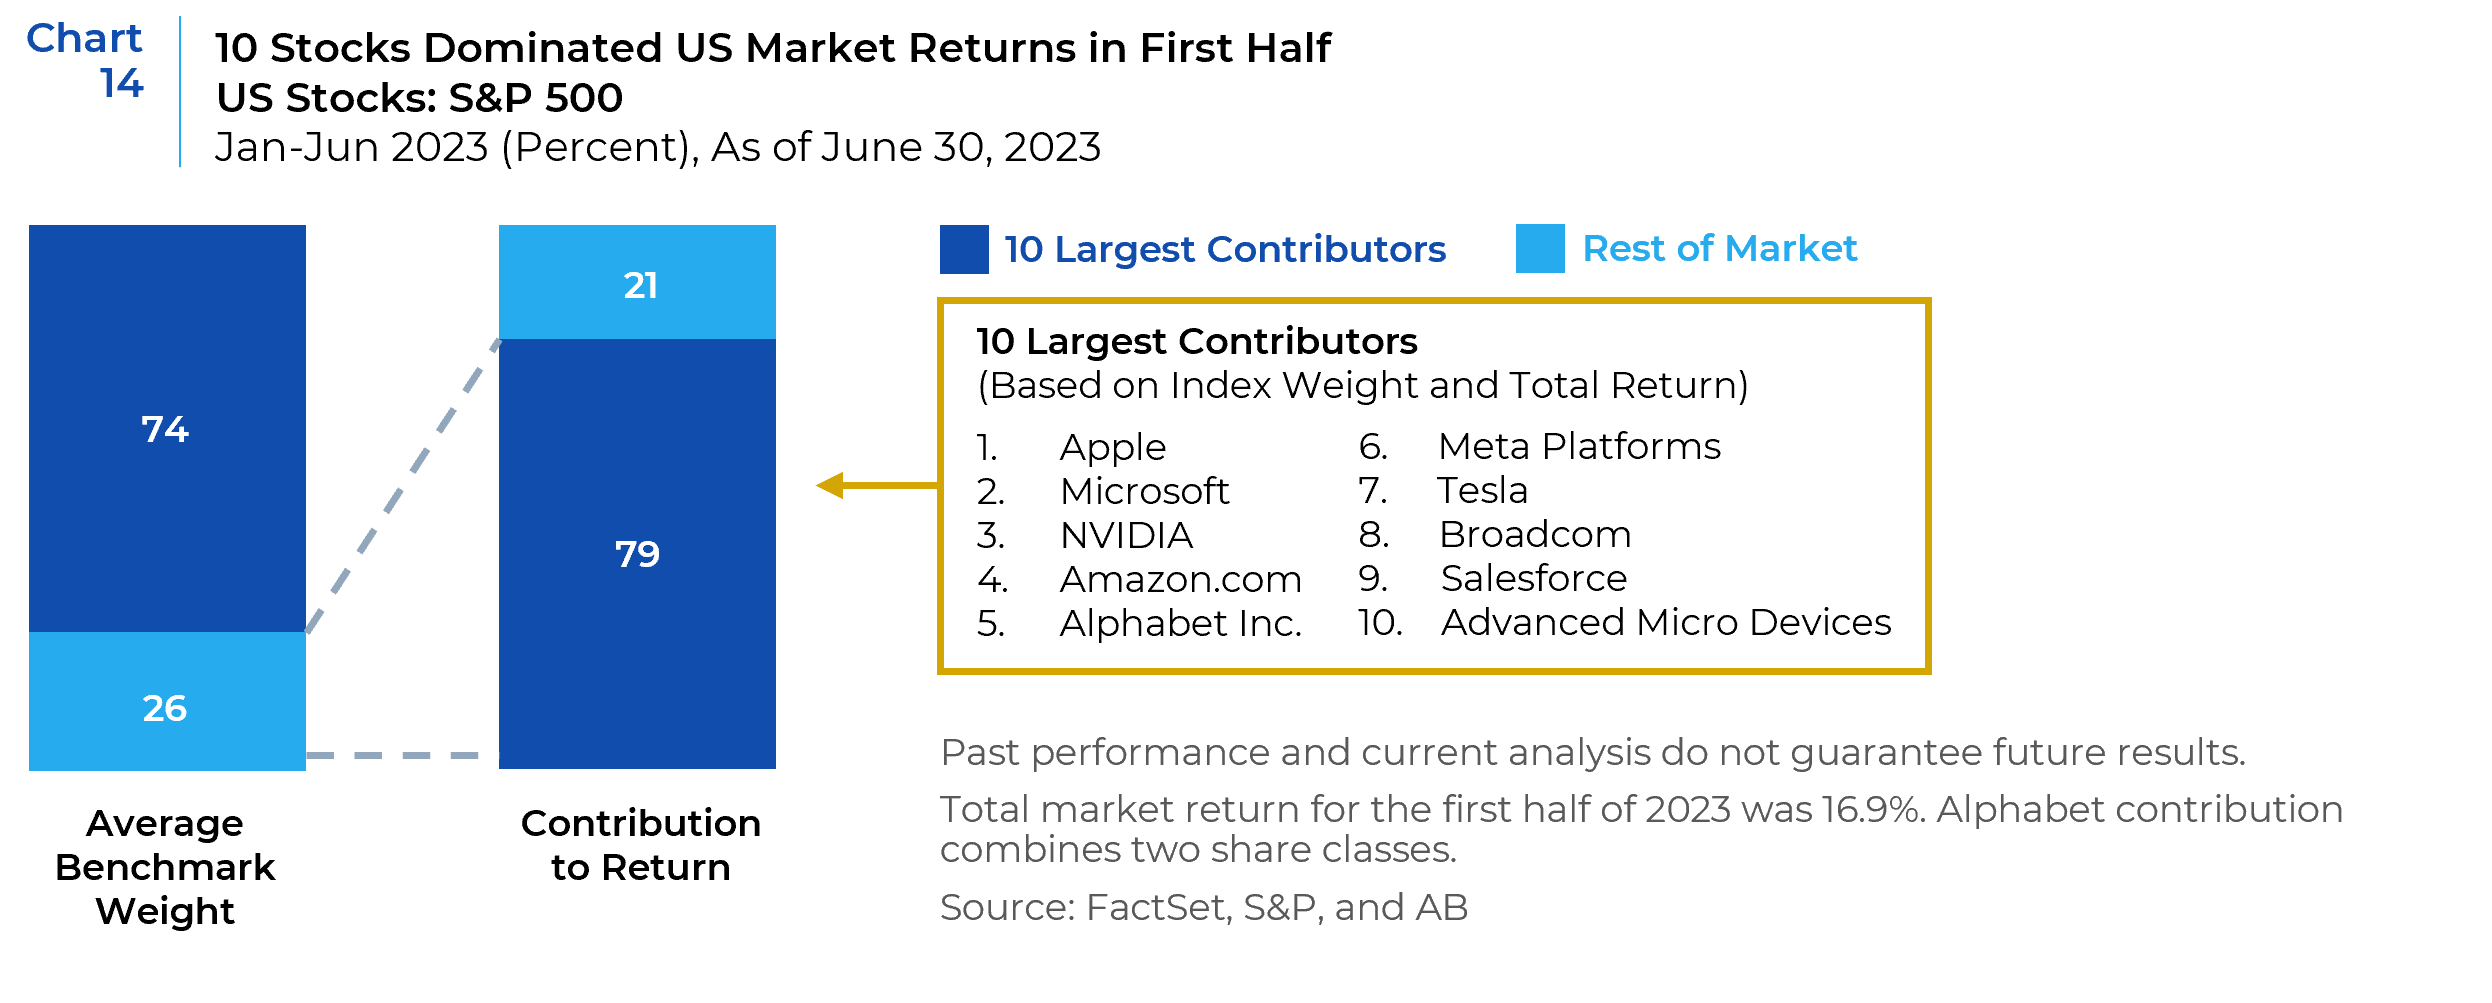
During the first half of 2023, 10 US stocks accounted for 79% of the S&P 500’s gains (Chart 14). This group, including NVIDIA, Microsoft, Apple, and Alphabet Inc., is widely seen as a direct beneficiary of generative AI’s potential to transform business productivity. NVIDIA—which posted the strongest total returns in the first half—manufactures powerful graphics processing units (GPUs) that are the backbone of the AI revolution.
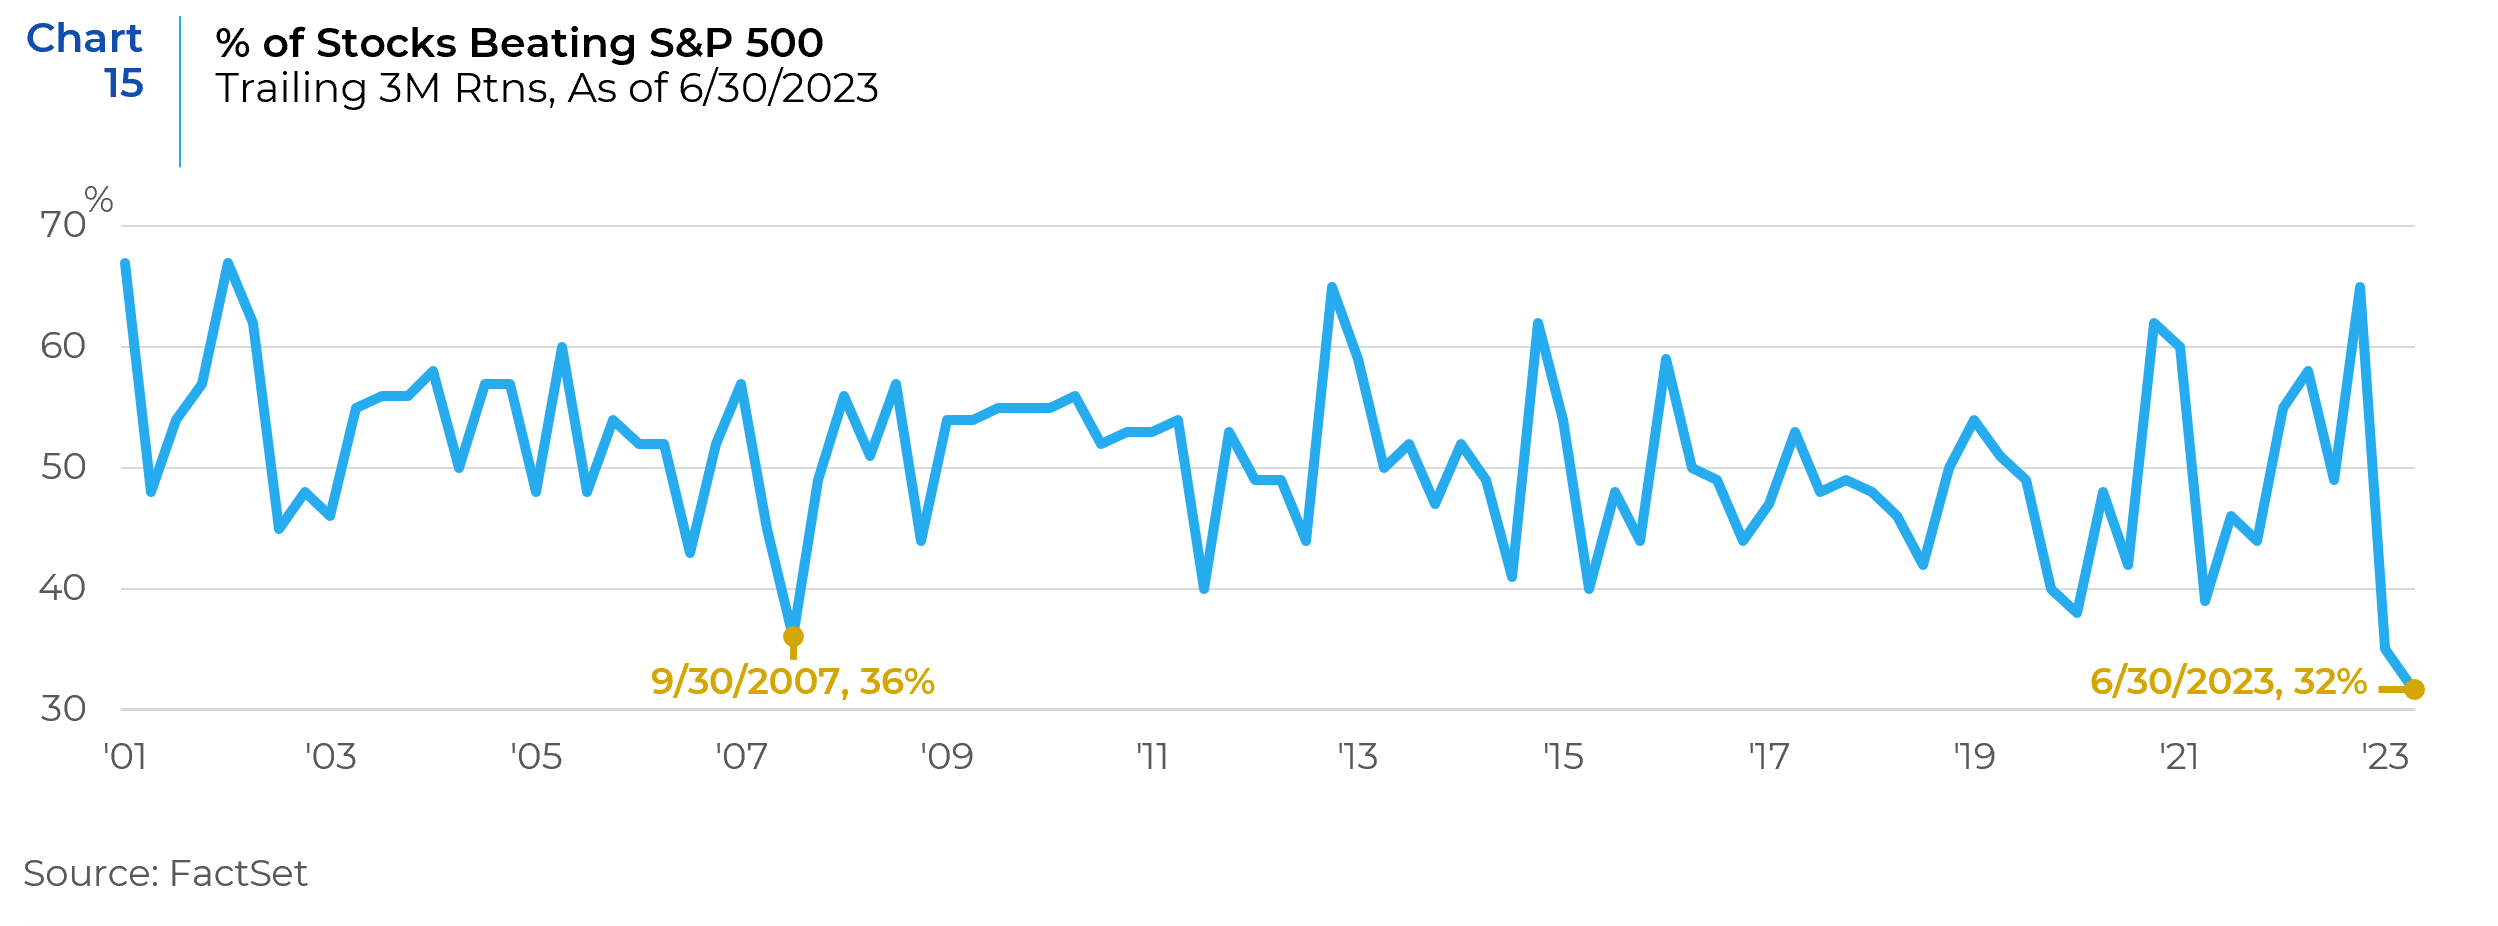
It’s not uncommon for the largest cap stocks to dominate performance among cap-weighted indexes like the S&P 500 or Nasdaq; but when the majority of member stocks are underperforming the index, concentration risks become elevated. As shown in Chart 15 below, as of the end of the second quarter, a record low of only 32% of S&P 500 stocks outperformed the overall index over the prior three months.
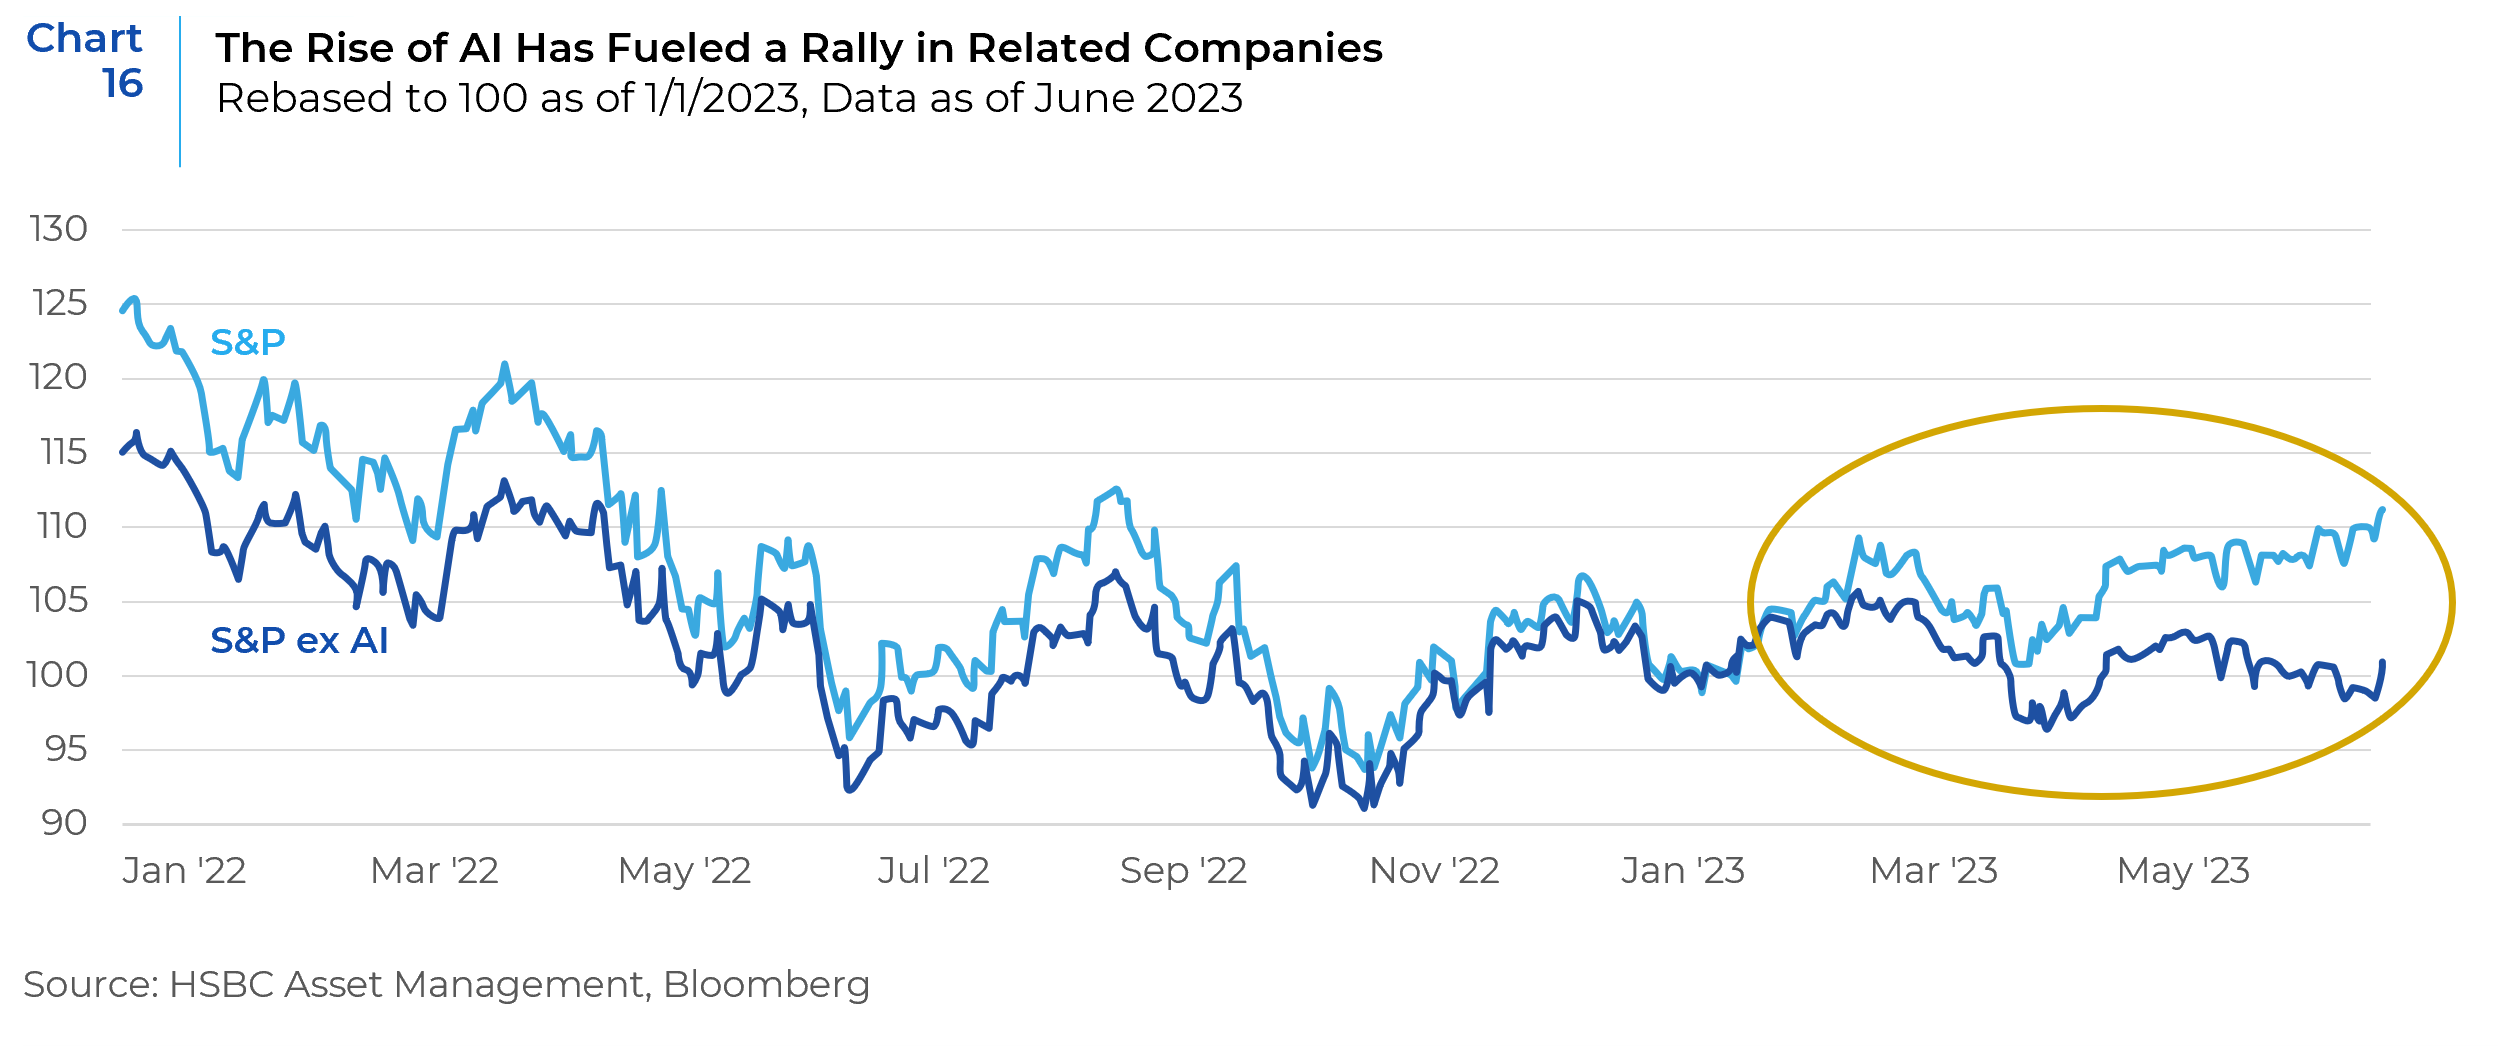
The extremely narrow rally among US stocks reflects investor concerns over the Fed’s attempts to slow the economy, which raises anxiety about the sustainability of earnings. The perceived AI winners are especially popular because they are seen to have structural engines for sustained growth that can traverse periods of macroeconomic difficulty with relative ease (Chart 16). Portfolios that had less than market exposure to these stocks suffered disappointing returns relative to the market. While Investors who held all these stocks at or above market weights have benefited from the trend, market concentration also creates risks. Investors who piled into the small group of AI-fueled names could get burned if valuations stretch too far, sentiment shifts and returns rapidly reverse.
The euphoria around Artificial General Intelligence (AGI) and Large Language Models (LLMs) and the hardware and software needed to develop and maintain them appear to be the primary catalysts for the extreme concentration in market leadership. In a paper entitled Generative AI – Hope, Harrowing or Hubris?, our CIO discussed the economic and industry implications of AGI. Perhaps AGI will dominate our economy for the next five or ten years in a way that justifies the market’s allocation of capital to these companies. Perhaps these companies and their AI prospects are the only bright spots in an otherwise stagnant and directionless US economy. Or it could be that allocating to high-growth, expensive tech is a reflex investors have developed because of a perceived margin of safety in these liquid tech mega caps, conditioned as we have all become to the expectation that when needed, central banks will provide unlimited liquidity to stabilize risky asset markets. This cycle has repeated itself with increased intensity and frequency since the turn of the century.
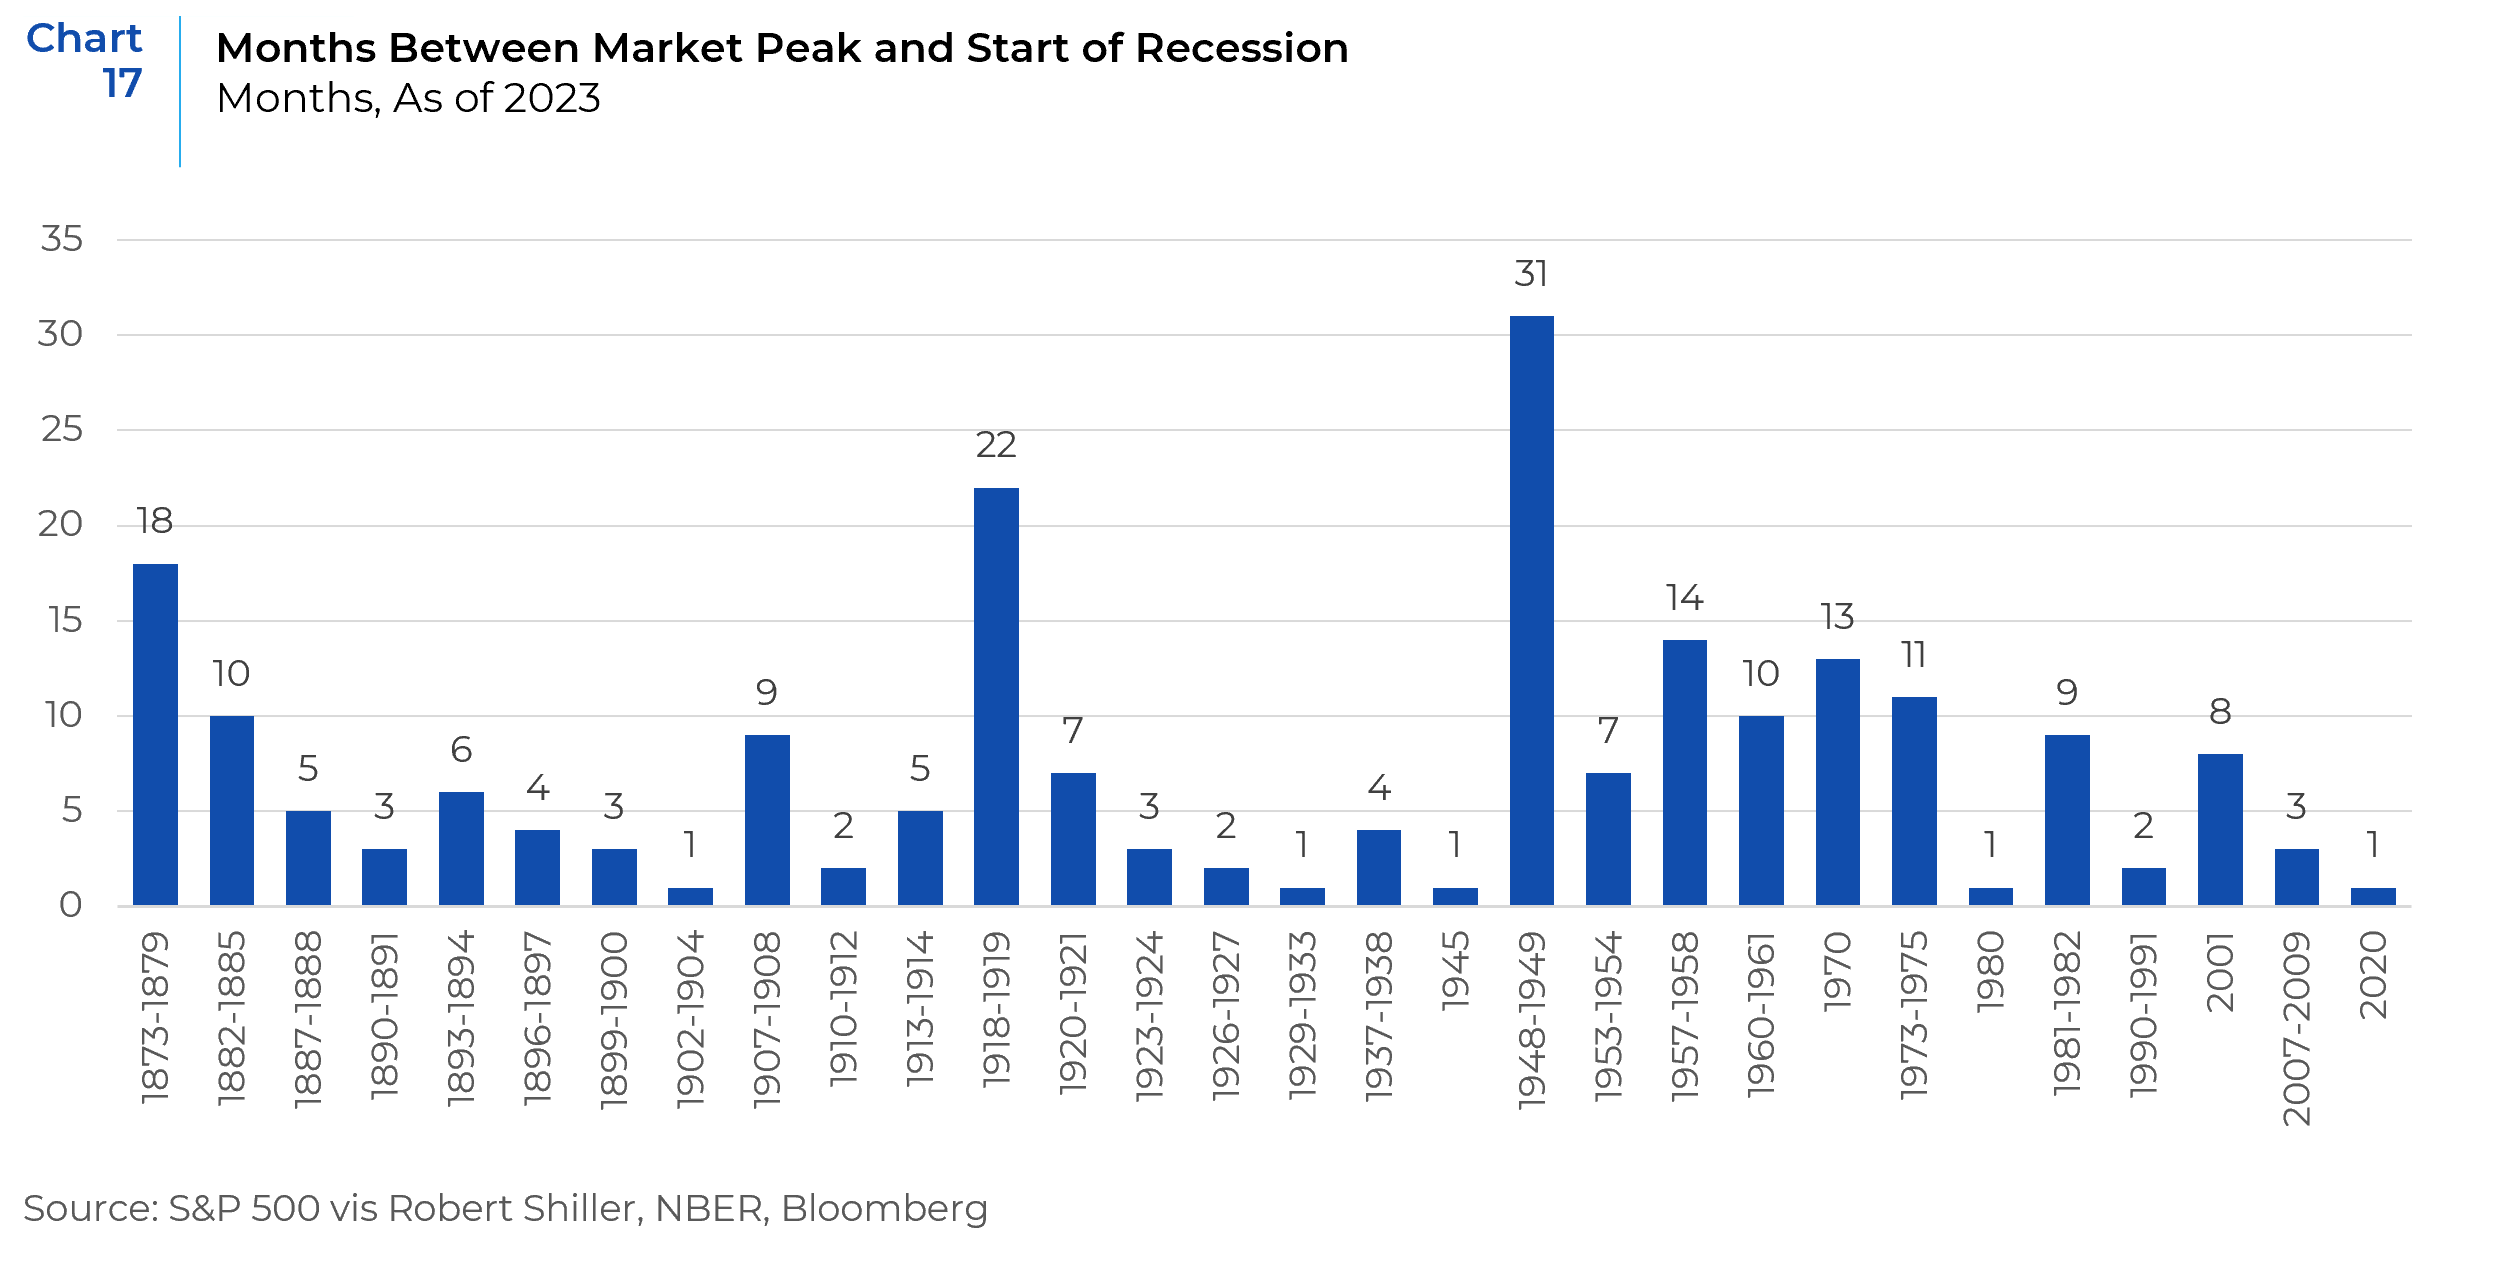
In conclusion, the data appears to be pointing to an economic slowdown. Based on the yield curve alone, history would suggest that the U.S. economy could be headed into a recession over the next several quarters, but it may not be too severe. The data points to a slowing economy but the depth of the slowdown will be strongly influenced by the Fed’s ability to judge at which point they need to stop raising rates and perhaps even start cutting them. Equity markets peak about six months before the start of a recession, on average (Chart 17). A recession in late 2023 or the first half of 2024 could begin to be reflected in financial markets in the second half of 2023.
References: Bloomberg, FactSet, Qontigo, BCA Research, Alpine Macro, Charles Schwab, Aperio, Clocktower
This report is neither an offer to sell nor a solicitation to invest in any product offered by Xponance® and should not be considered as investment advice. This report was prepared for clients and prospective clients of Xponance® and is intended to be used solely by such clients and prospects for educational and illustrative purposes. The information contained herein is proprietary to Xponance® and may not be duplicated or used for any purpose other than the educational purpose for which it has been provided. Any unauthorized use, duplication or disclosure of this report is strictly prohibited.
This report is based on information believed to be correct, but is subject to revision. Although the information provided herein has been obtained from sources which Xponance® believes to be reliable, Xponance® does not guarantee its accuracy, and such information may be incomplete or condensed. Additional information is available from Xponance® upon request. All performance and other projections are historical and do not guarantee future performance. No assurance can be given that any particular investment objective or strategy will be achieved at a given time and actual investment results may vary over any given time.