
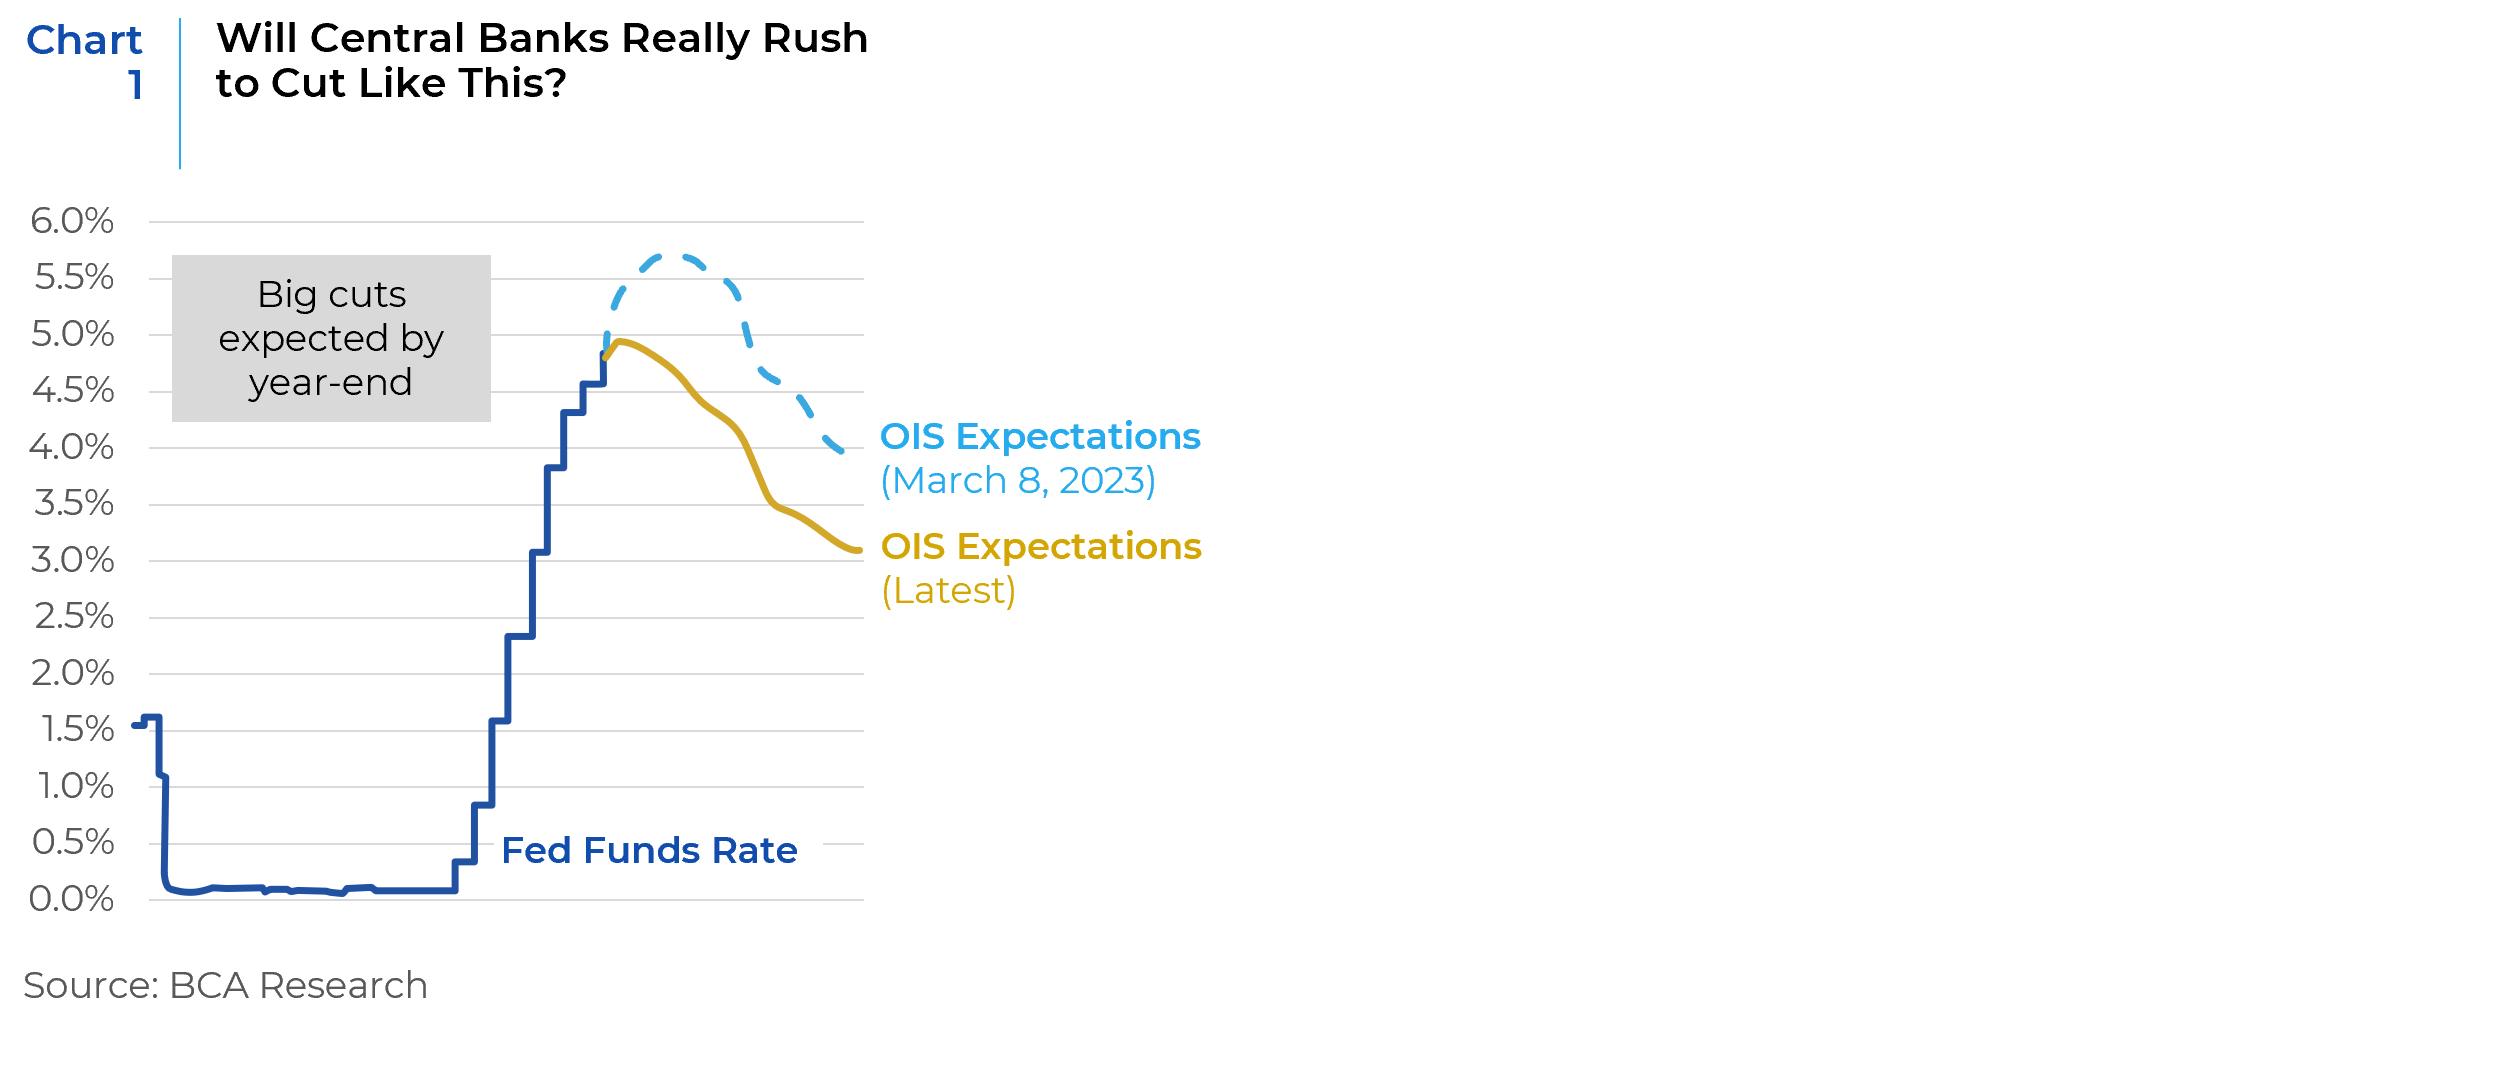
Banking sector turmoil grabbed the headlines in March with the focus on liquidity pressures at regional banks from deposit flight. To restore depositor confidence, the Fed implemented an emergency liquidity facility which appears to have contained the contagion. While the banking failures in US and Europe last month are unlikely to morph into a full-blown meltdown of the financial system because banks are in much better shape than in 2008 or 2011, events will likely lead to a further tightening in bank lending standards which would challenge vulnerable market segments as commercial real estate debt, venture capital, and leverage loans, and increase the probability of a recession. The market is now discounting that FOMC will ease in the second half of 2023 (Chart 1). These expectations have provided a tailwind for growth and long duration plays, which in turn provided some broader market support. The government response to the banking turmoil and some related M&A helped stabilize the sector late in the quarter and helped to underpin the broader market.
Recession – The Most Likely Scenario
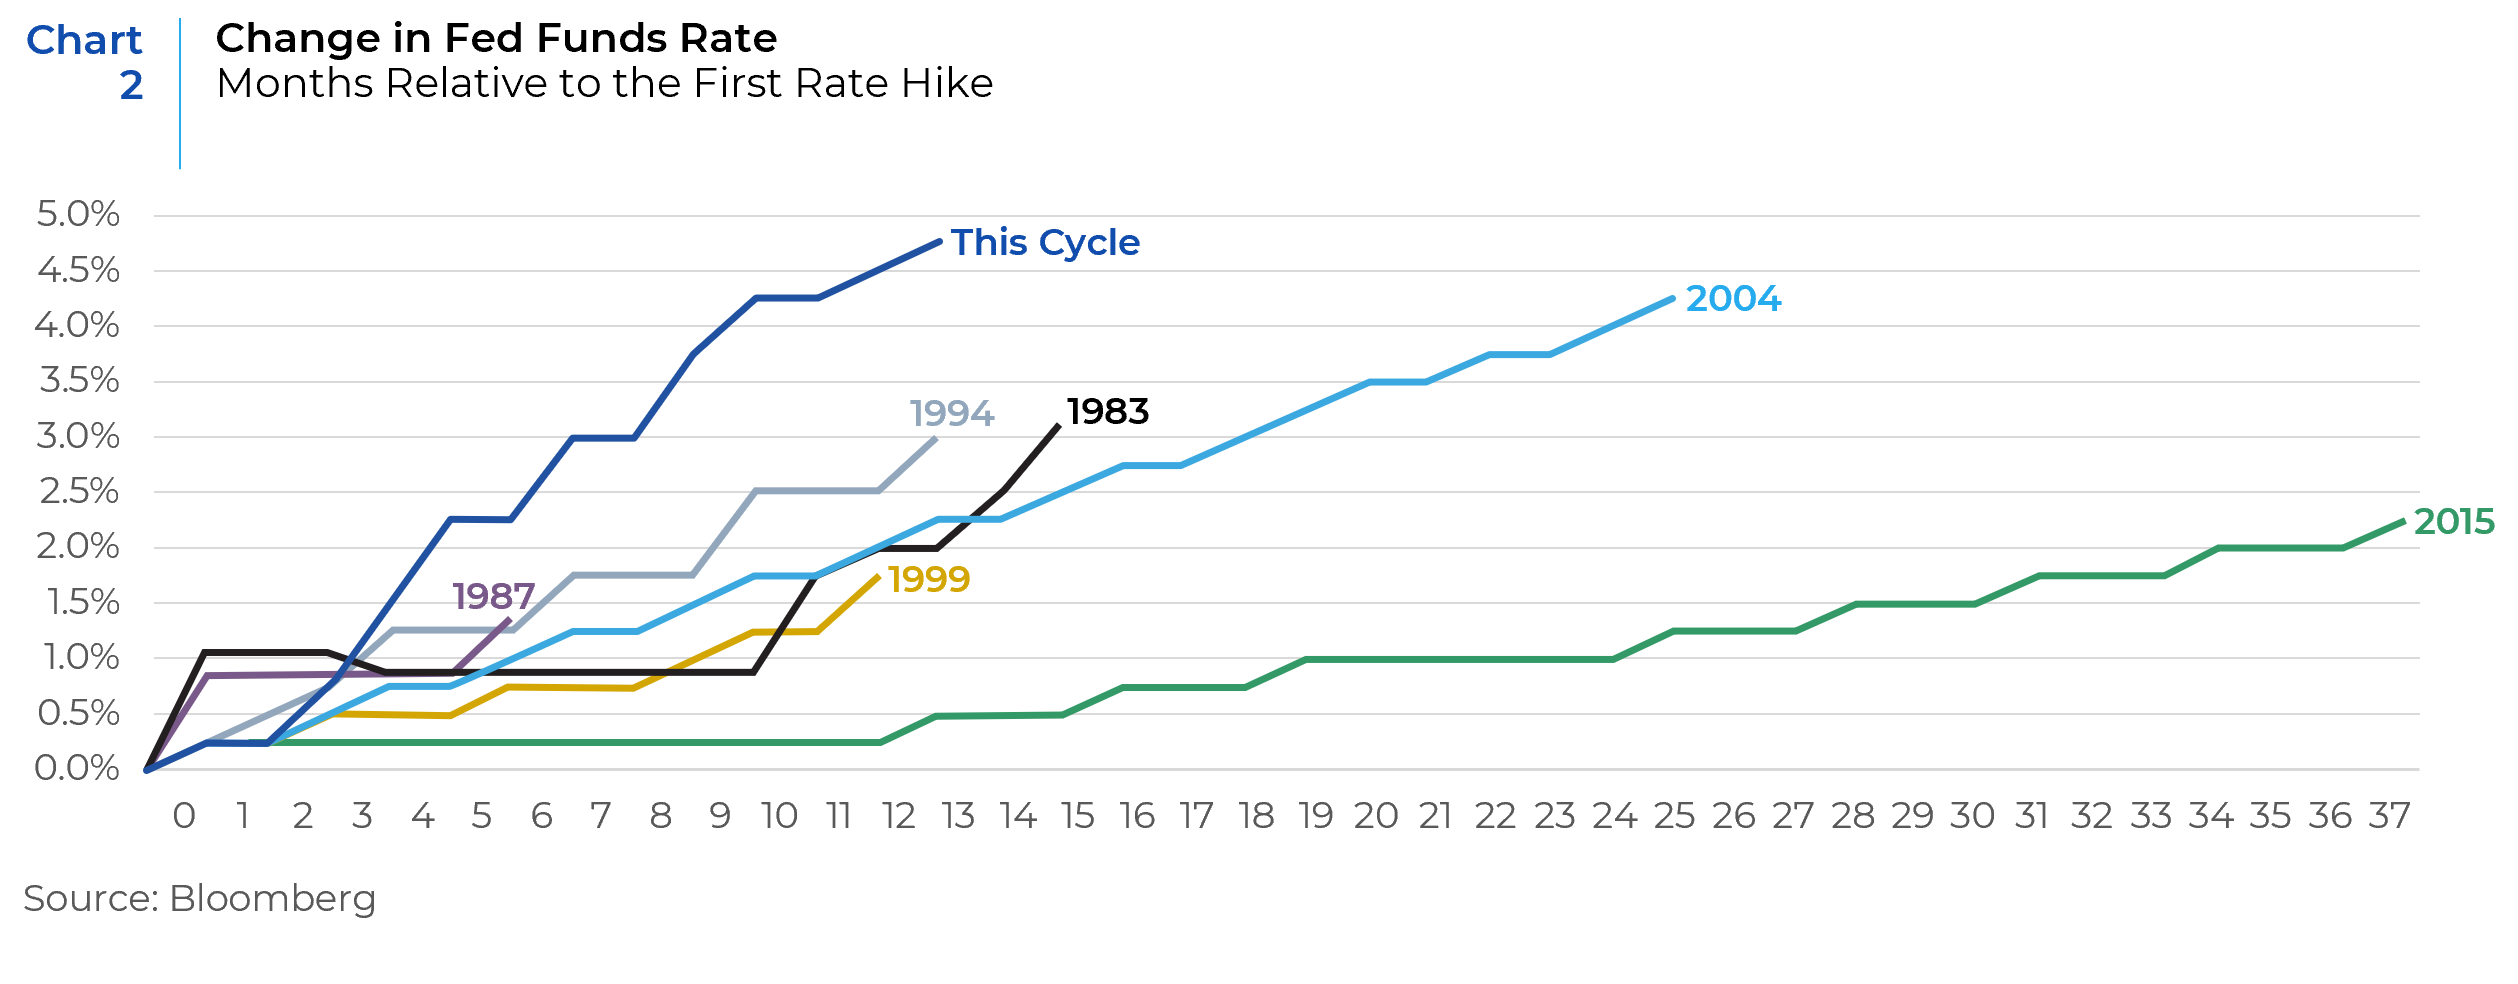
Recession has now become the economic scenario most likely to unfold in late 2023 and into the first half of 2024. The compounded effects of consecutive Fed rate hikes (Chart 2), high inflation, supply chain disruptions, and soaring interest rates is starting to thwart growth. Tighter financial conditions, in response to elevated inflation, will also take a toll on consumer spending and corporate sentiment. These factors make recession the most likely economic outcome in the coming months. However, the depth and timing of the downturn remain uncertain, largely due to the long and variable lag associated with monetary policy’s economic effects. Persistently high inflation hasn’t afforded the Fed the time to gauge the economic impact of previous rate hikes, putting growth at risk. While core goods prices have been declining, core services costs — particularly rent and labor — remain elevated and should keep inflation well above the Fed’s target. In addition, deglobalization trends and labor force shortages likely will keep structural inflation firm through the year.
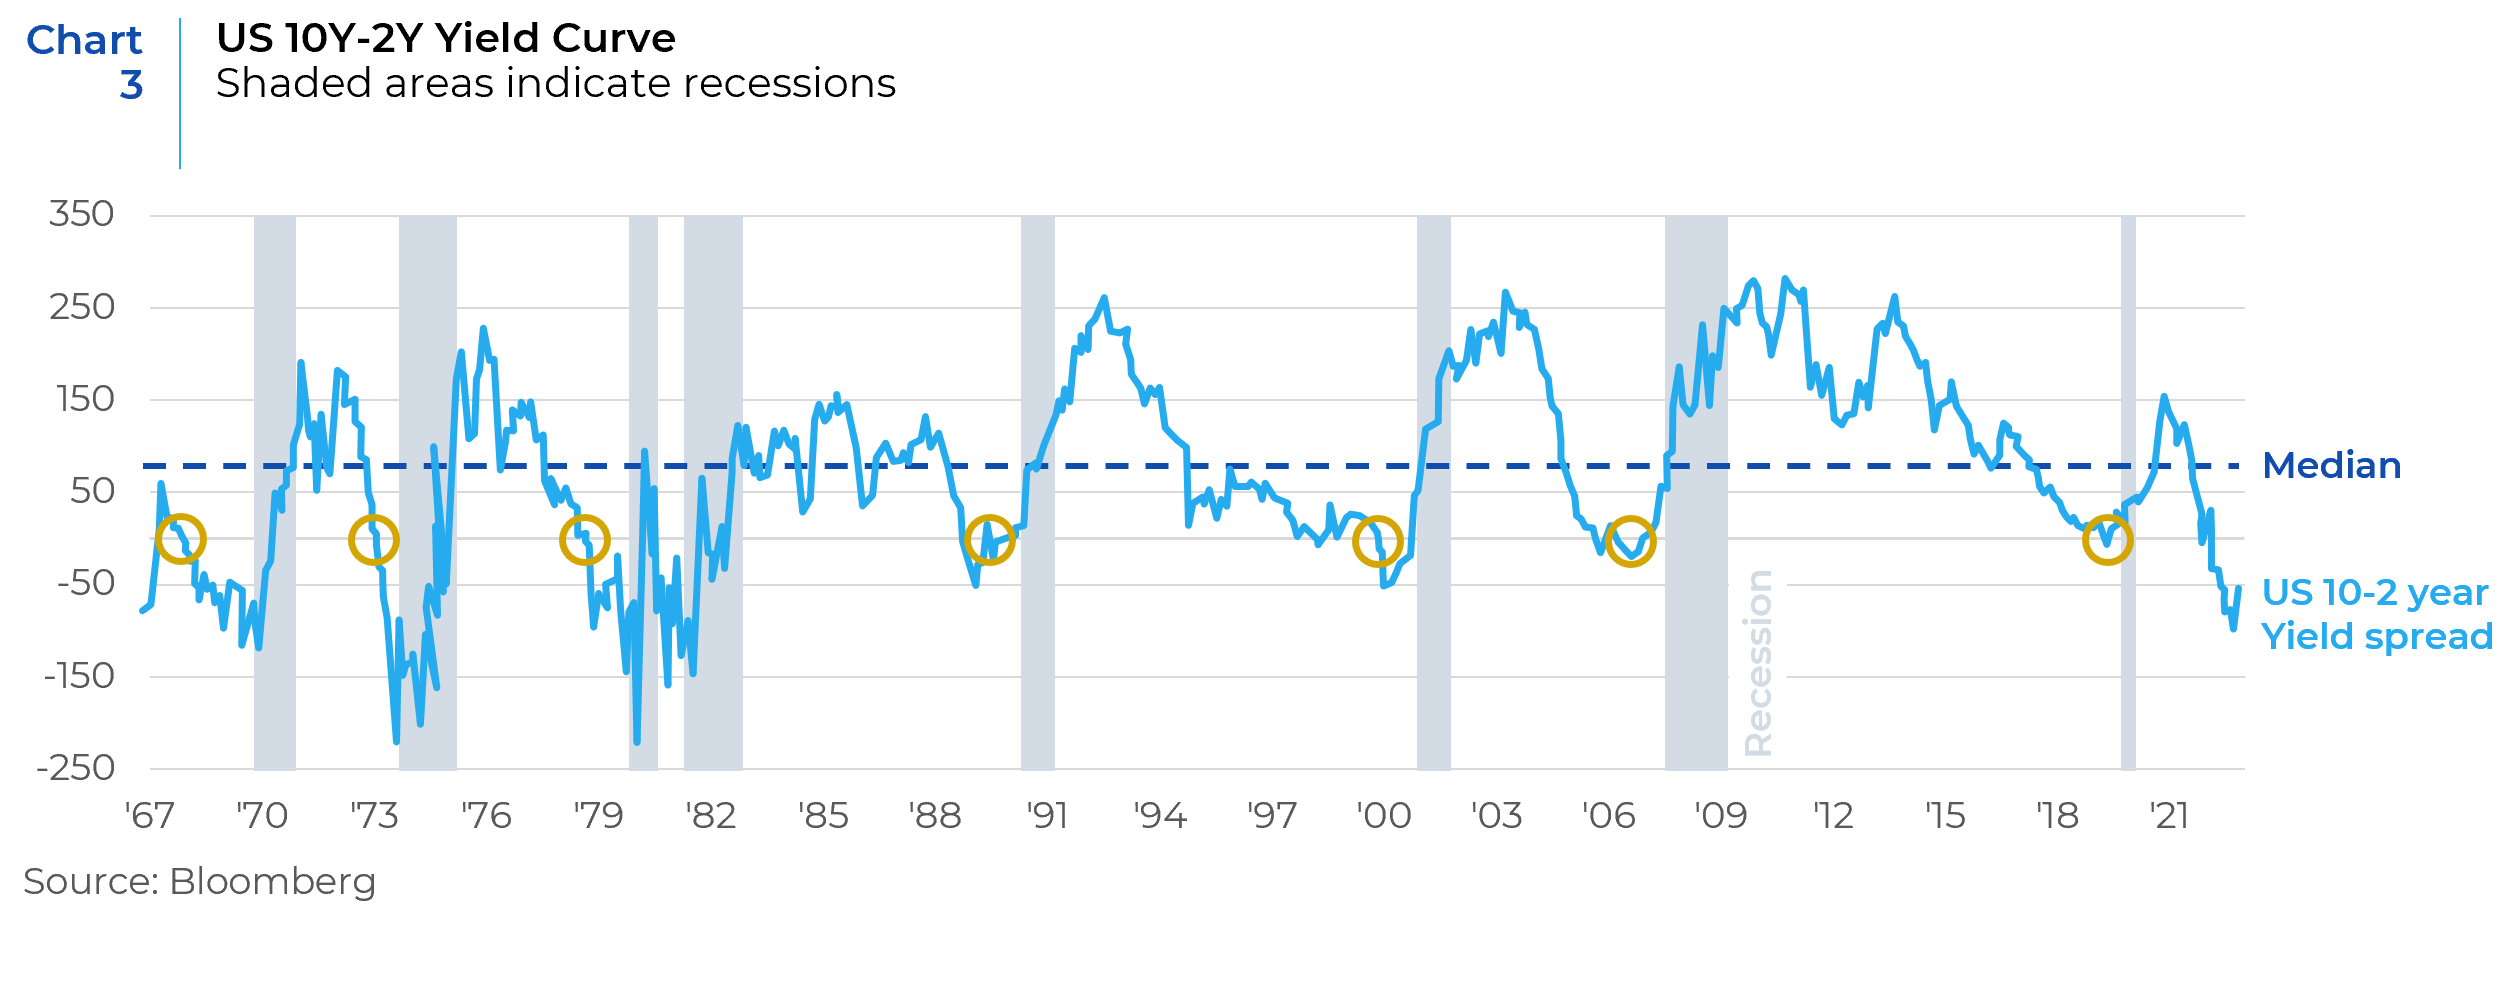
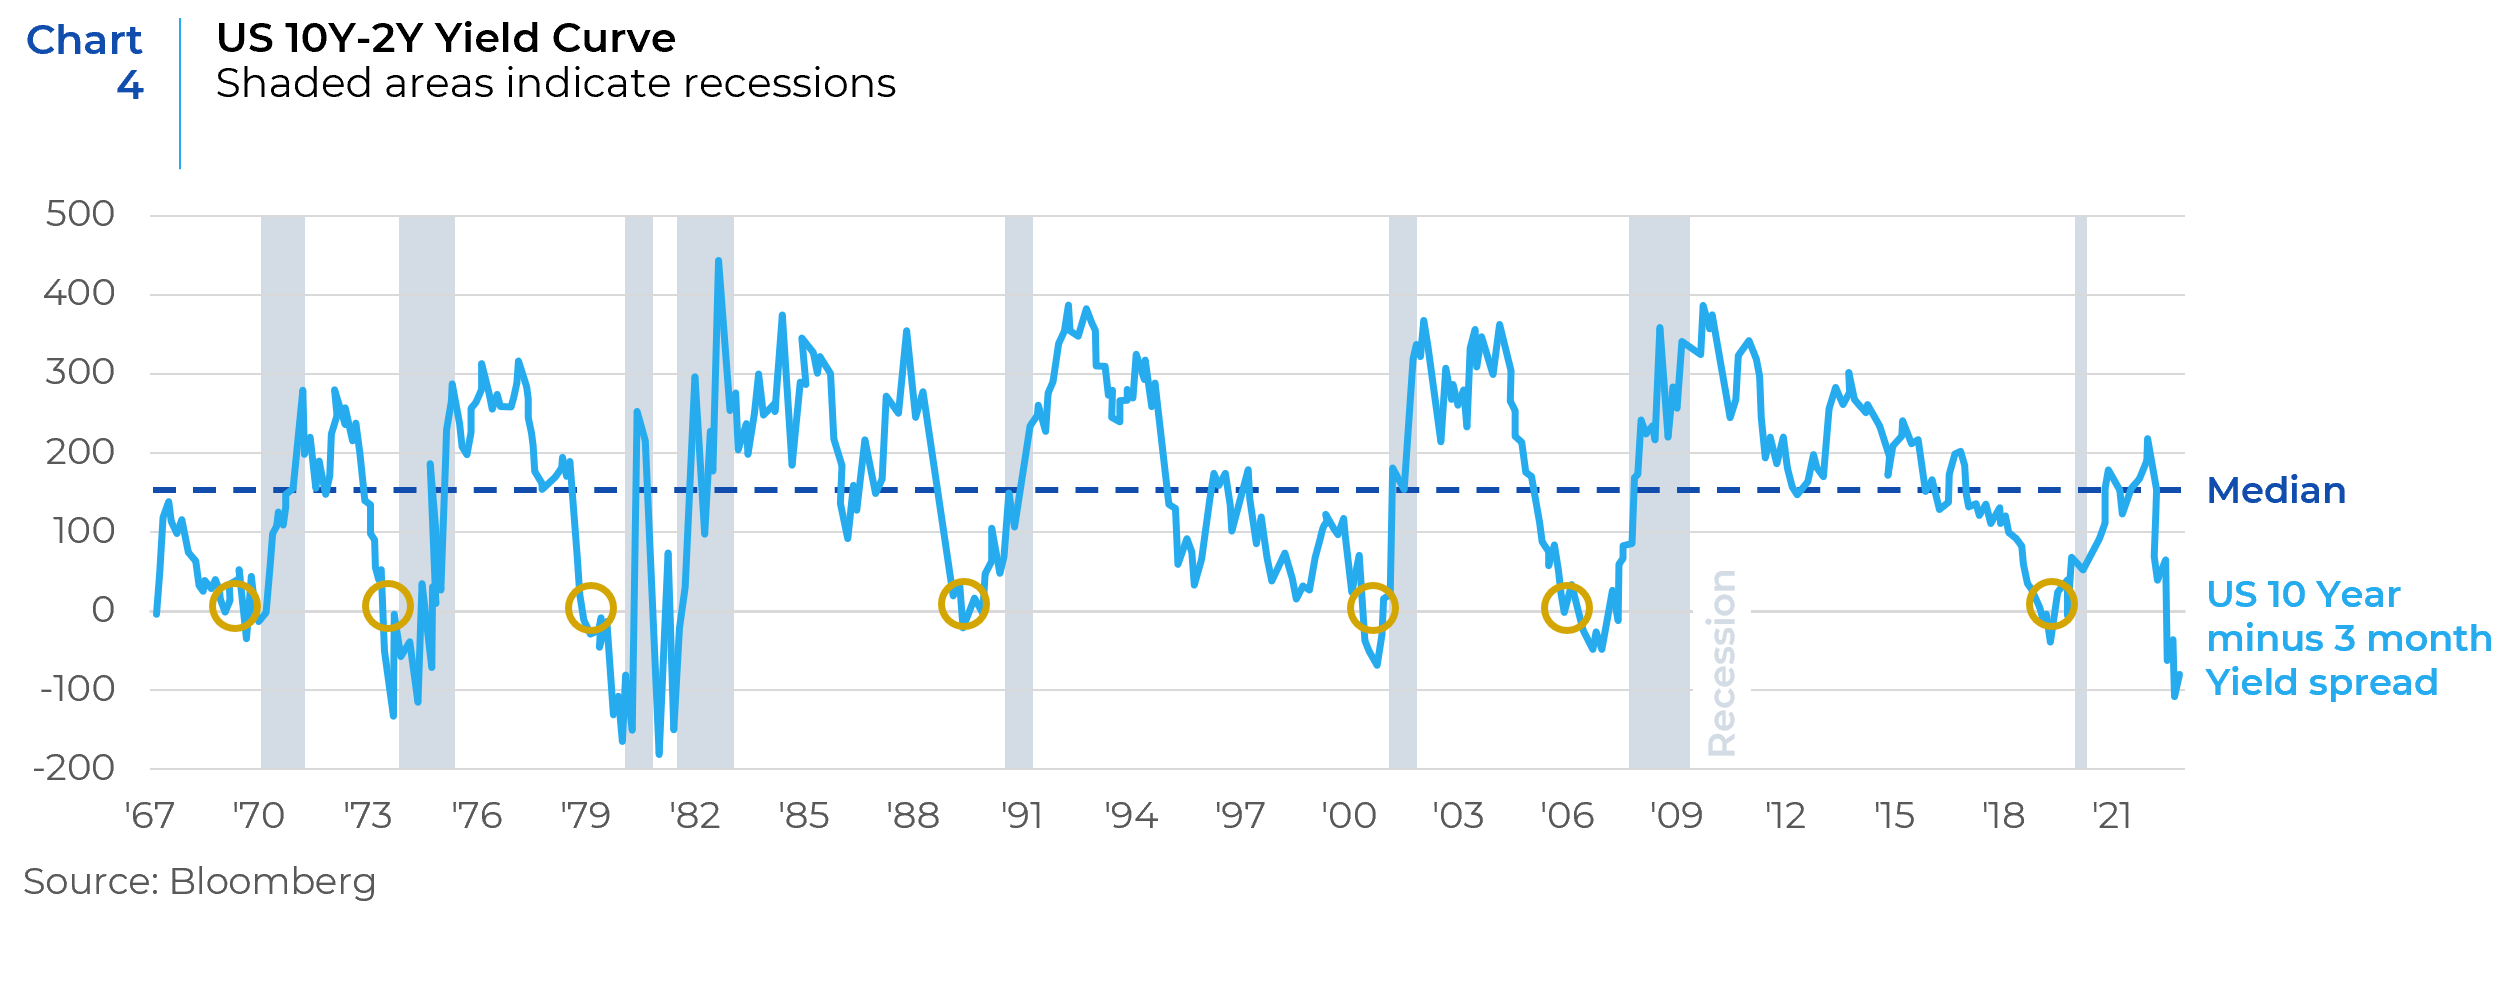
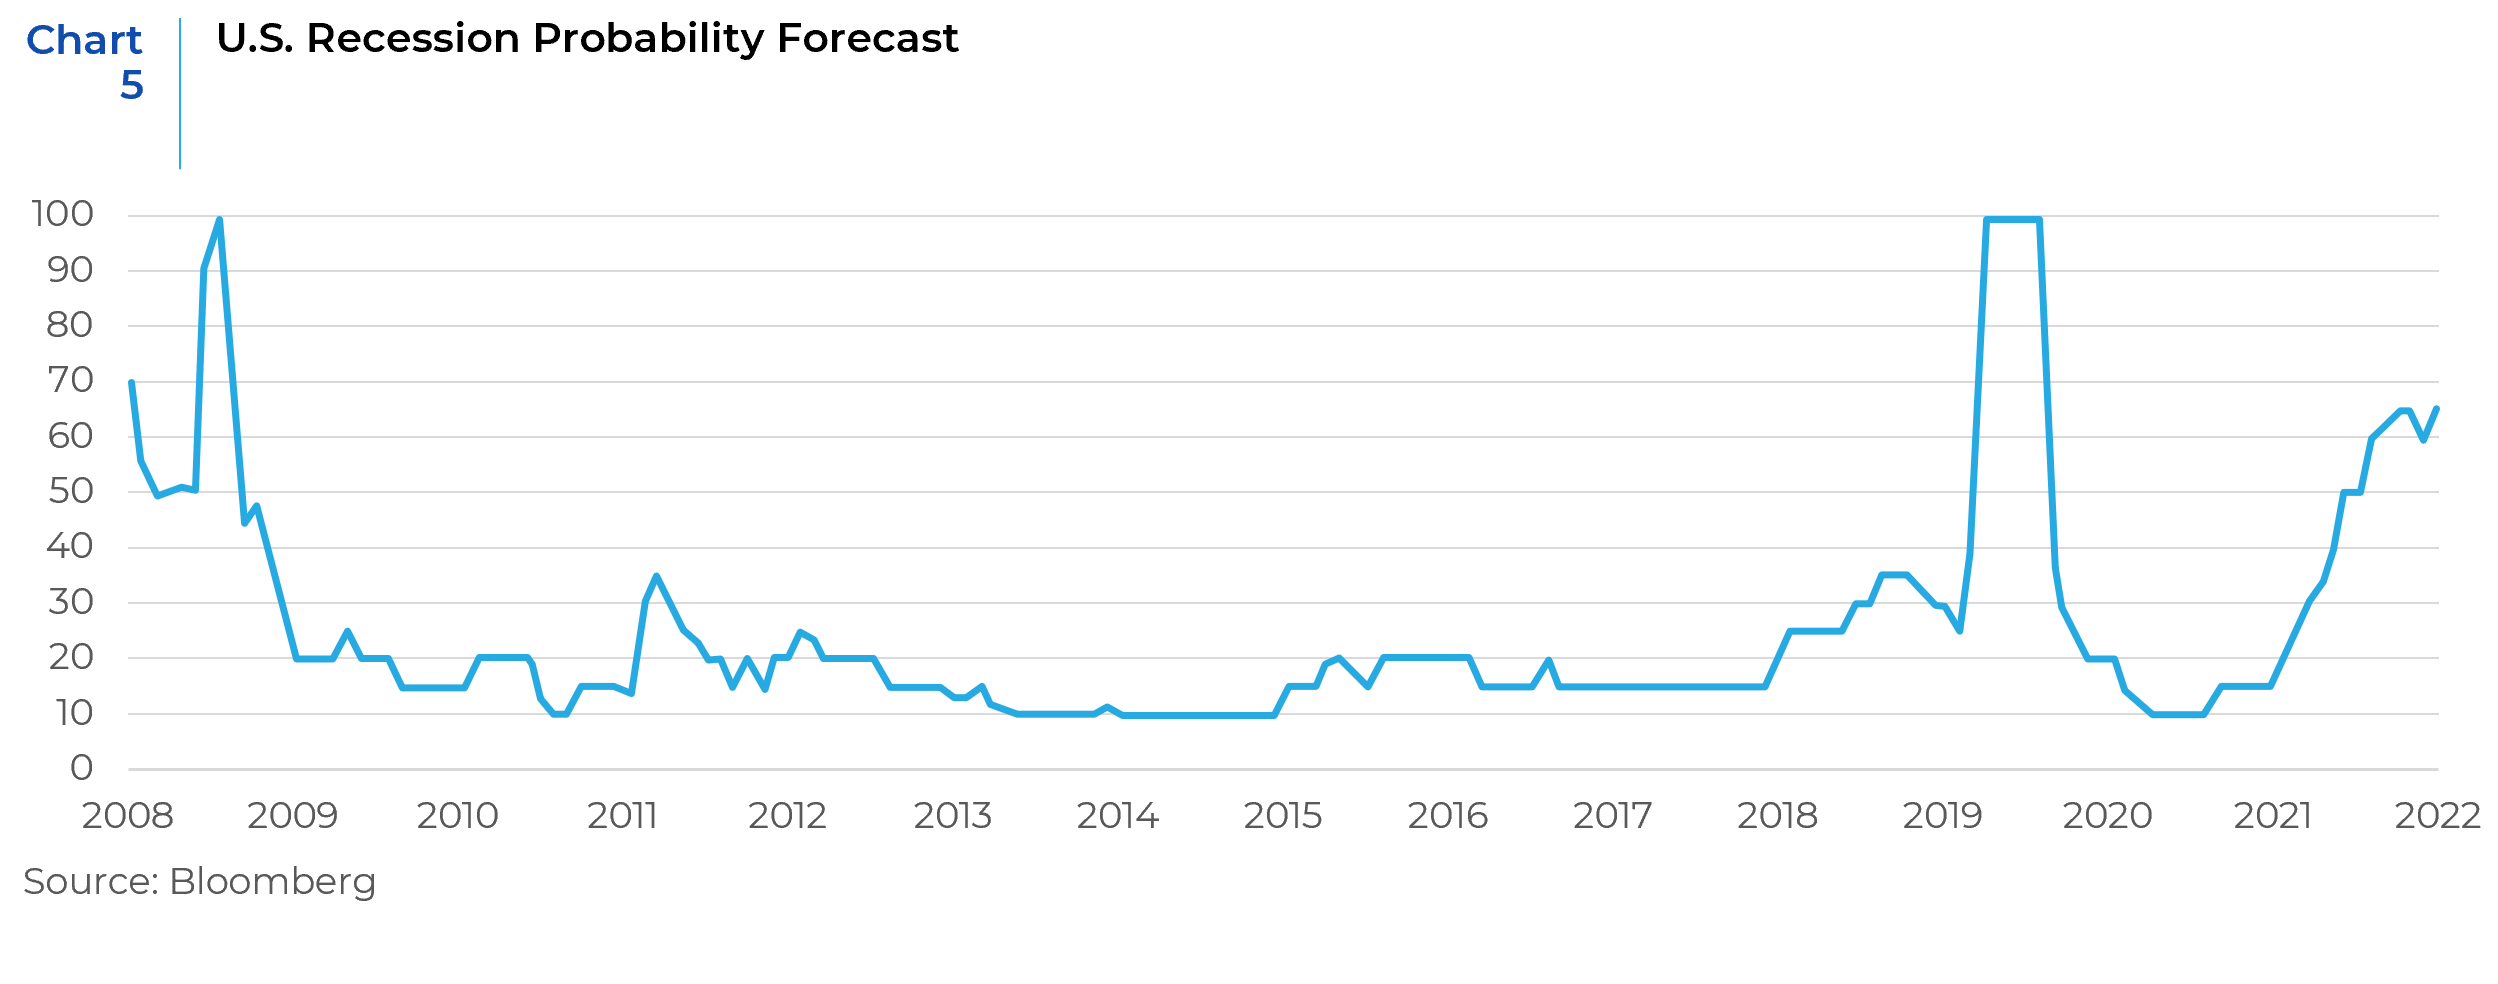
Inversions in the yield curve are also sending recessionary signals. The US 10Y/2Y yield curve, which has been a reliable recession indicator in the past, has been inverted for almost a year now (Chart 3). That is typically a time to peak equity levels. US 10Y/3M yield spreads, another reliable recession indicator, is also inverted (Chart 4). The probability of the U.S. economy slipping into a recession has increased over the last few months and now stands at 65% (Chart 5).
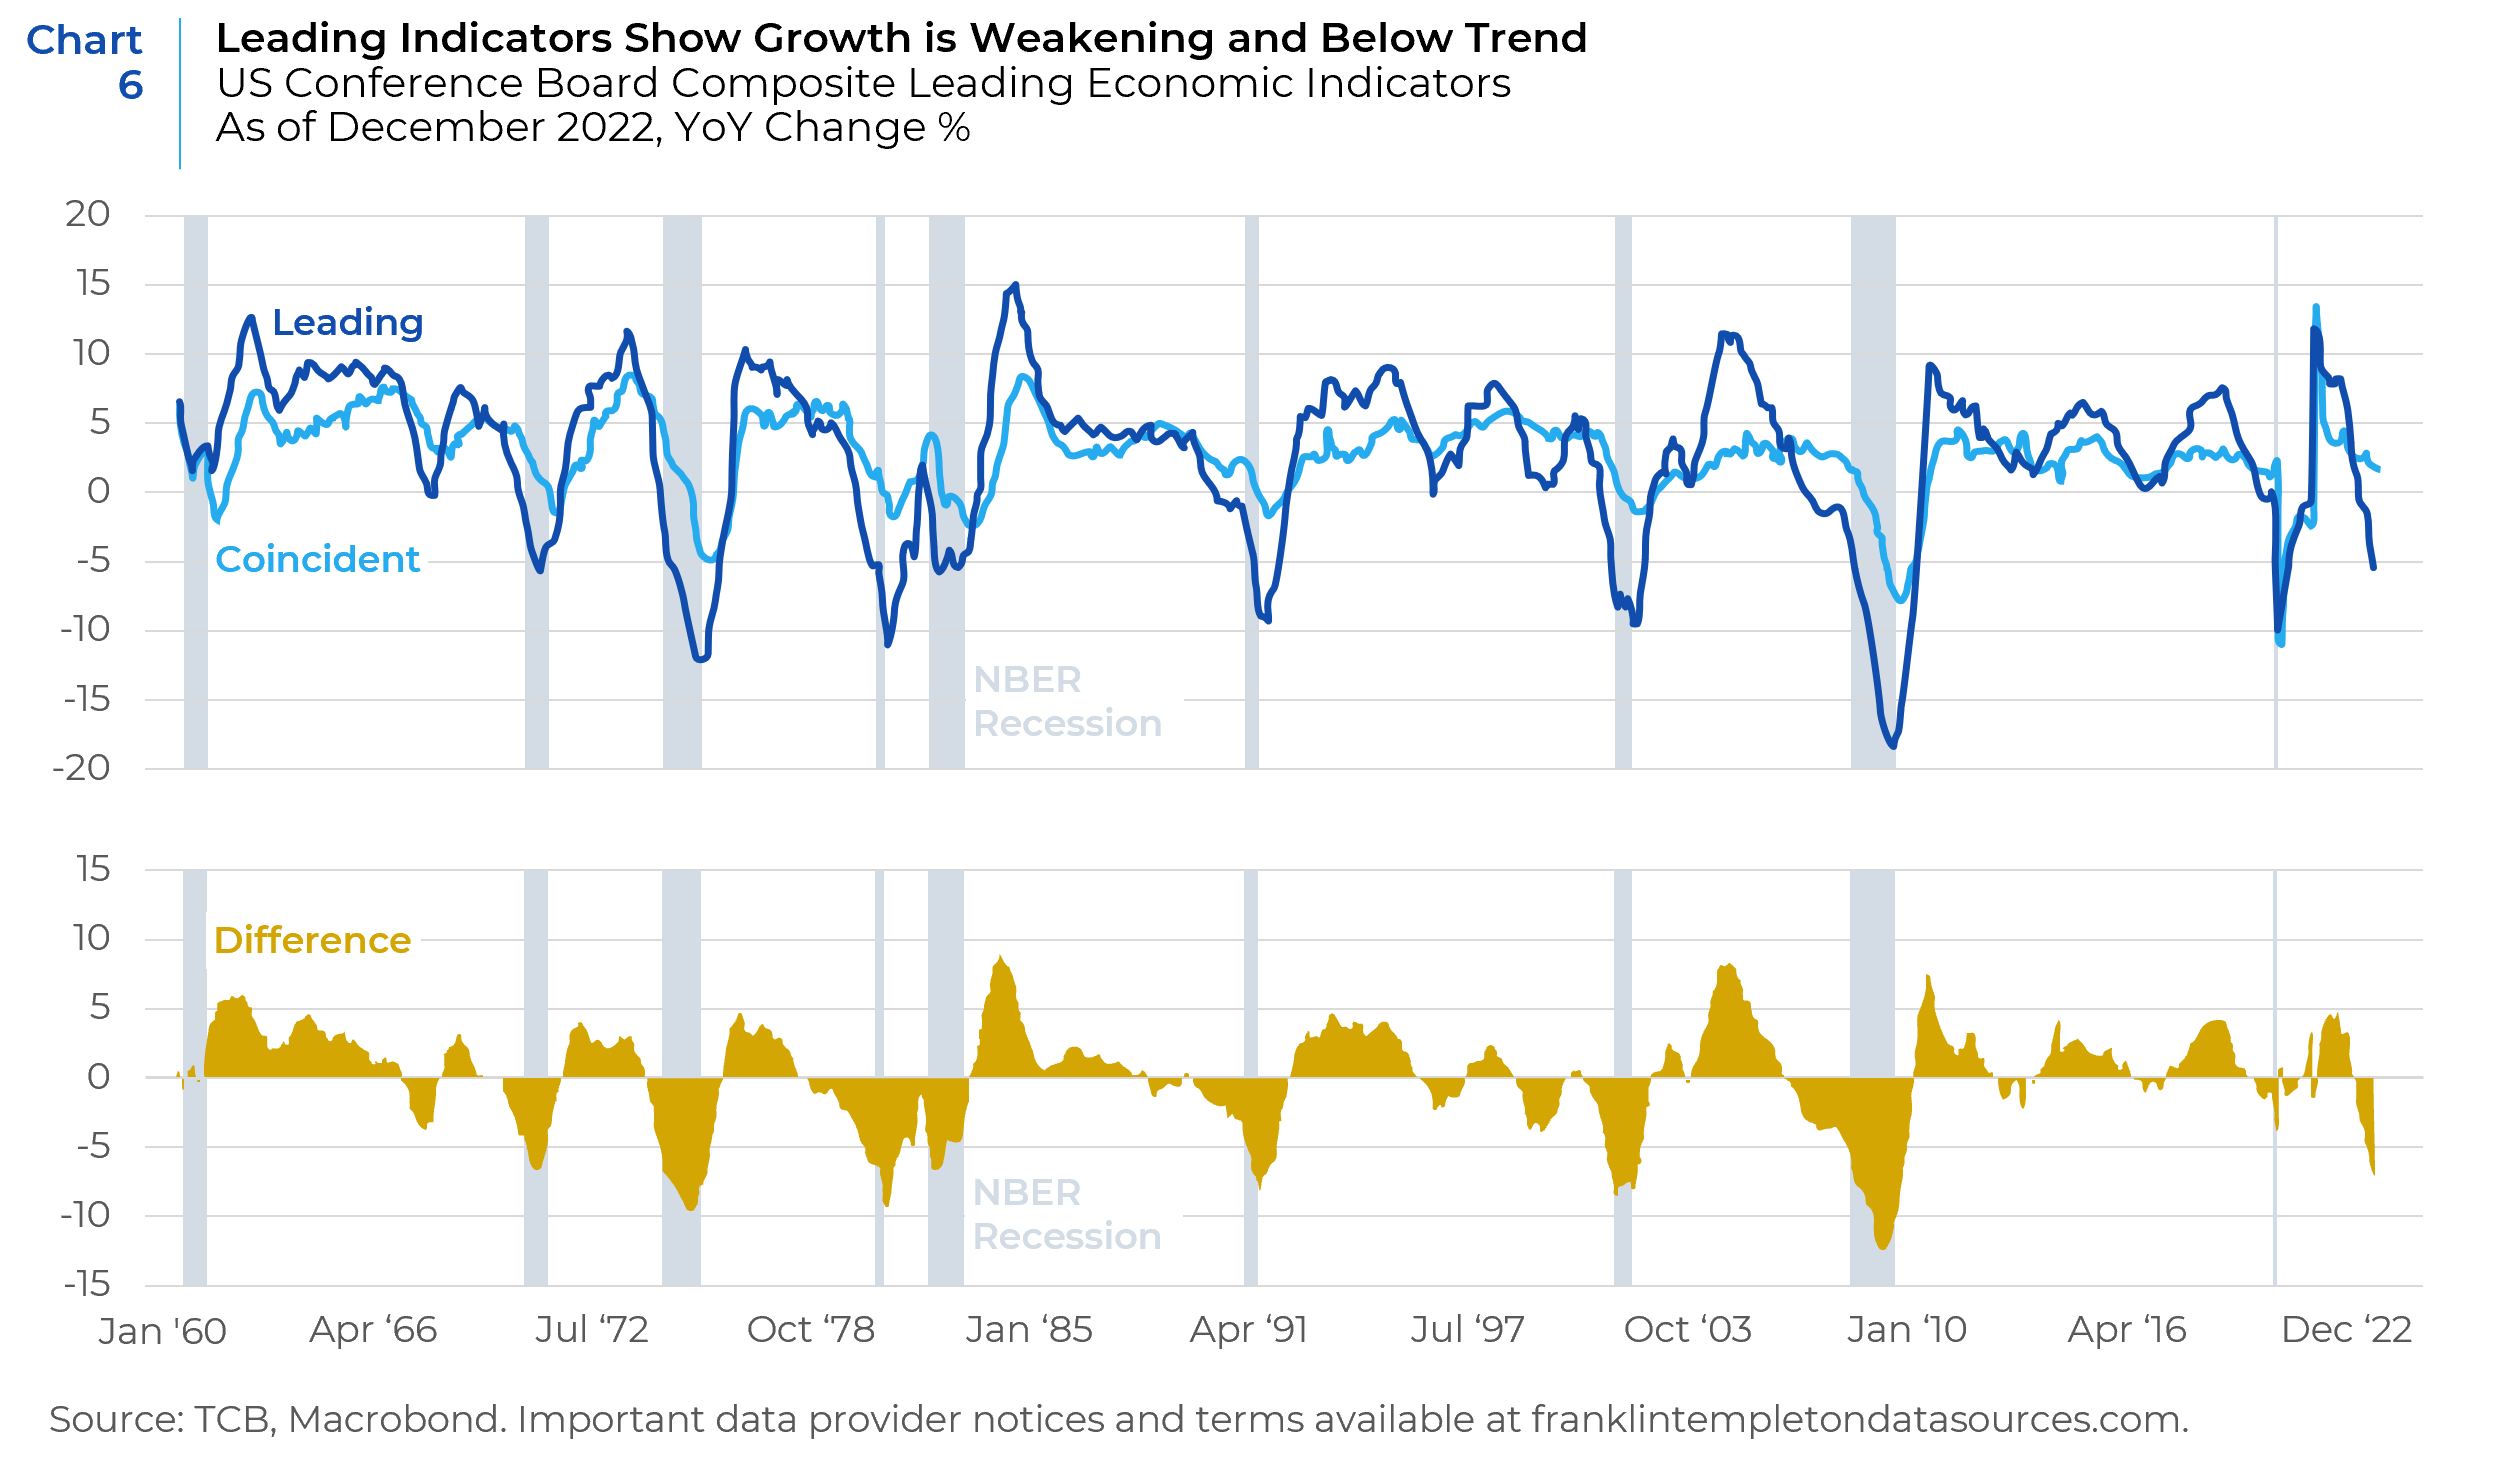
Leading indicators suggest a period of weak growth (Chart 6) ahead of us, even though current activity has held up reasonably well thus far.
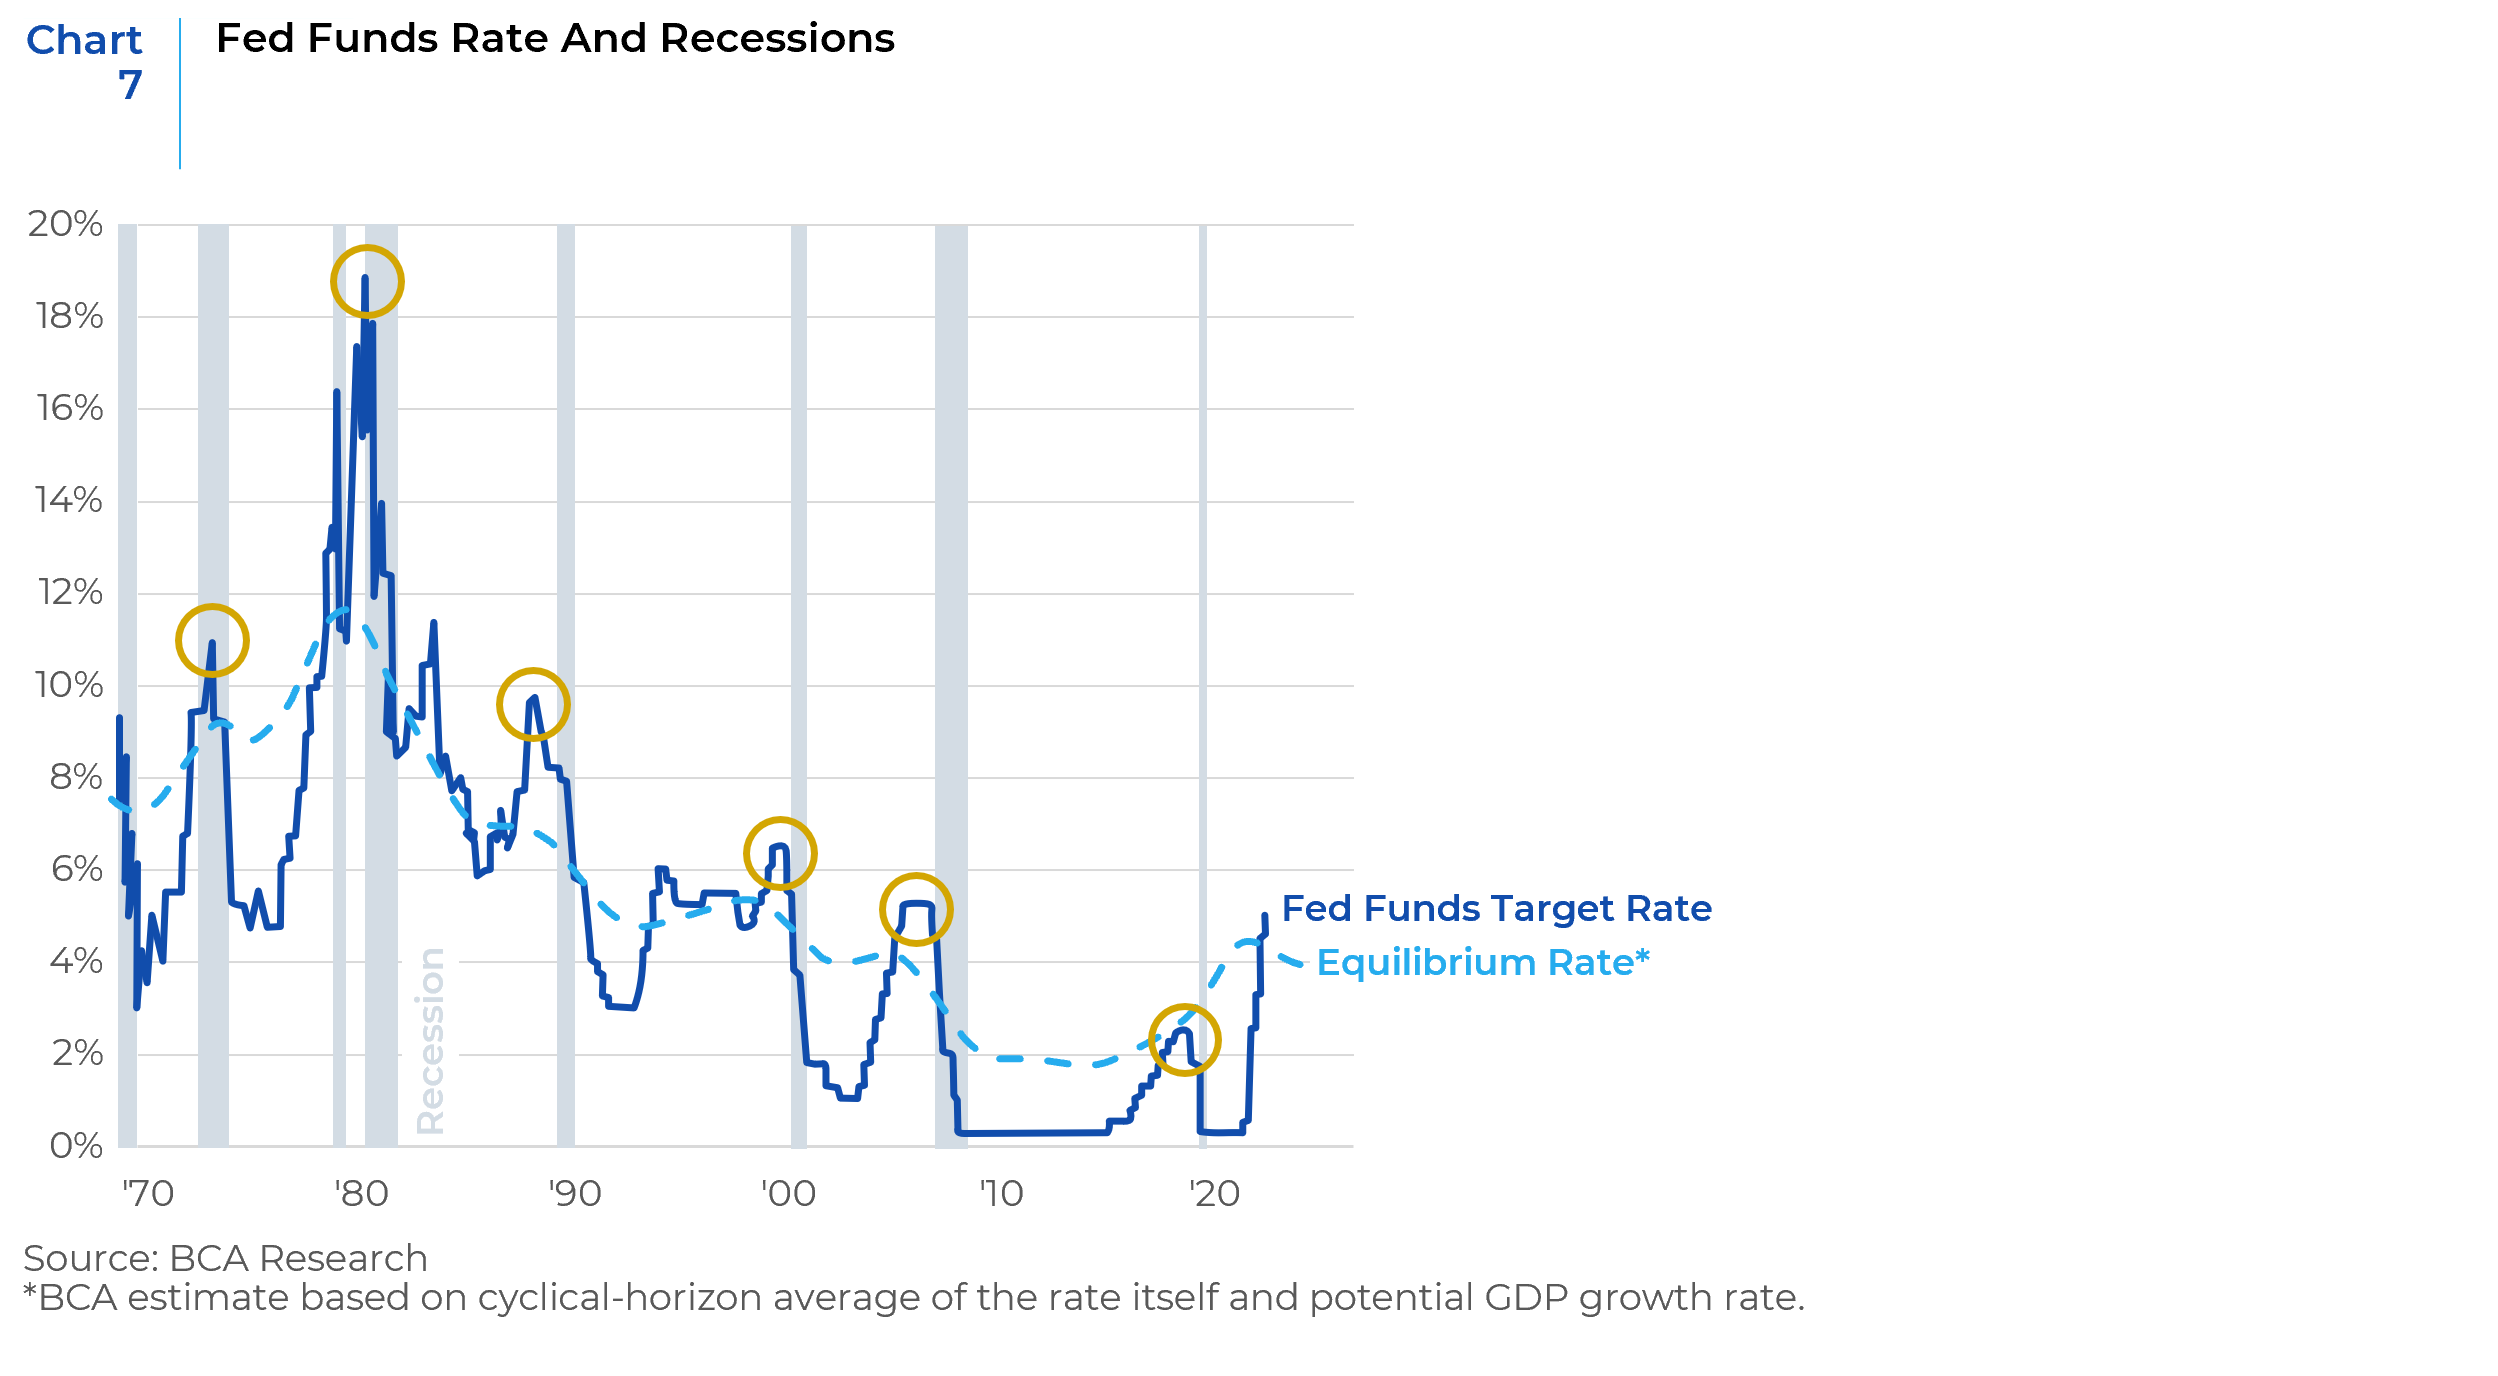
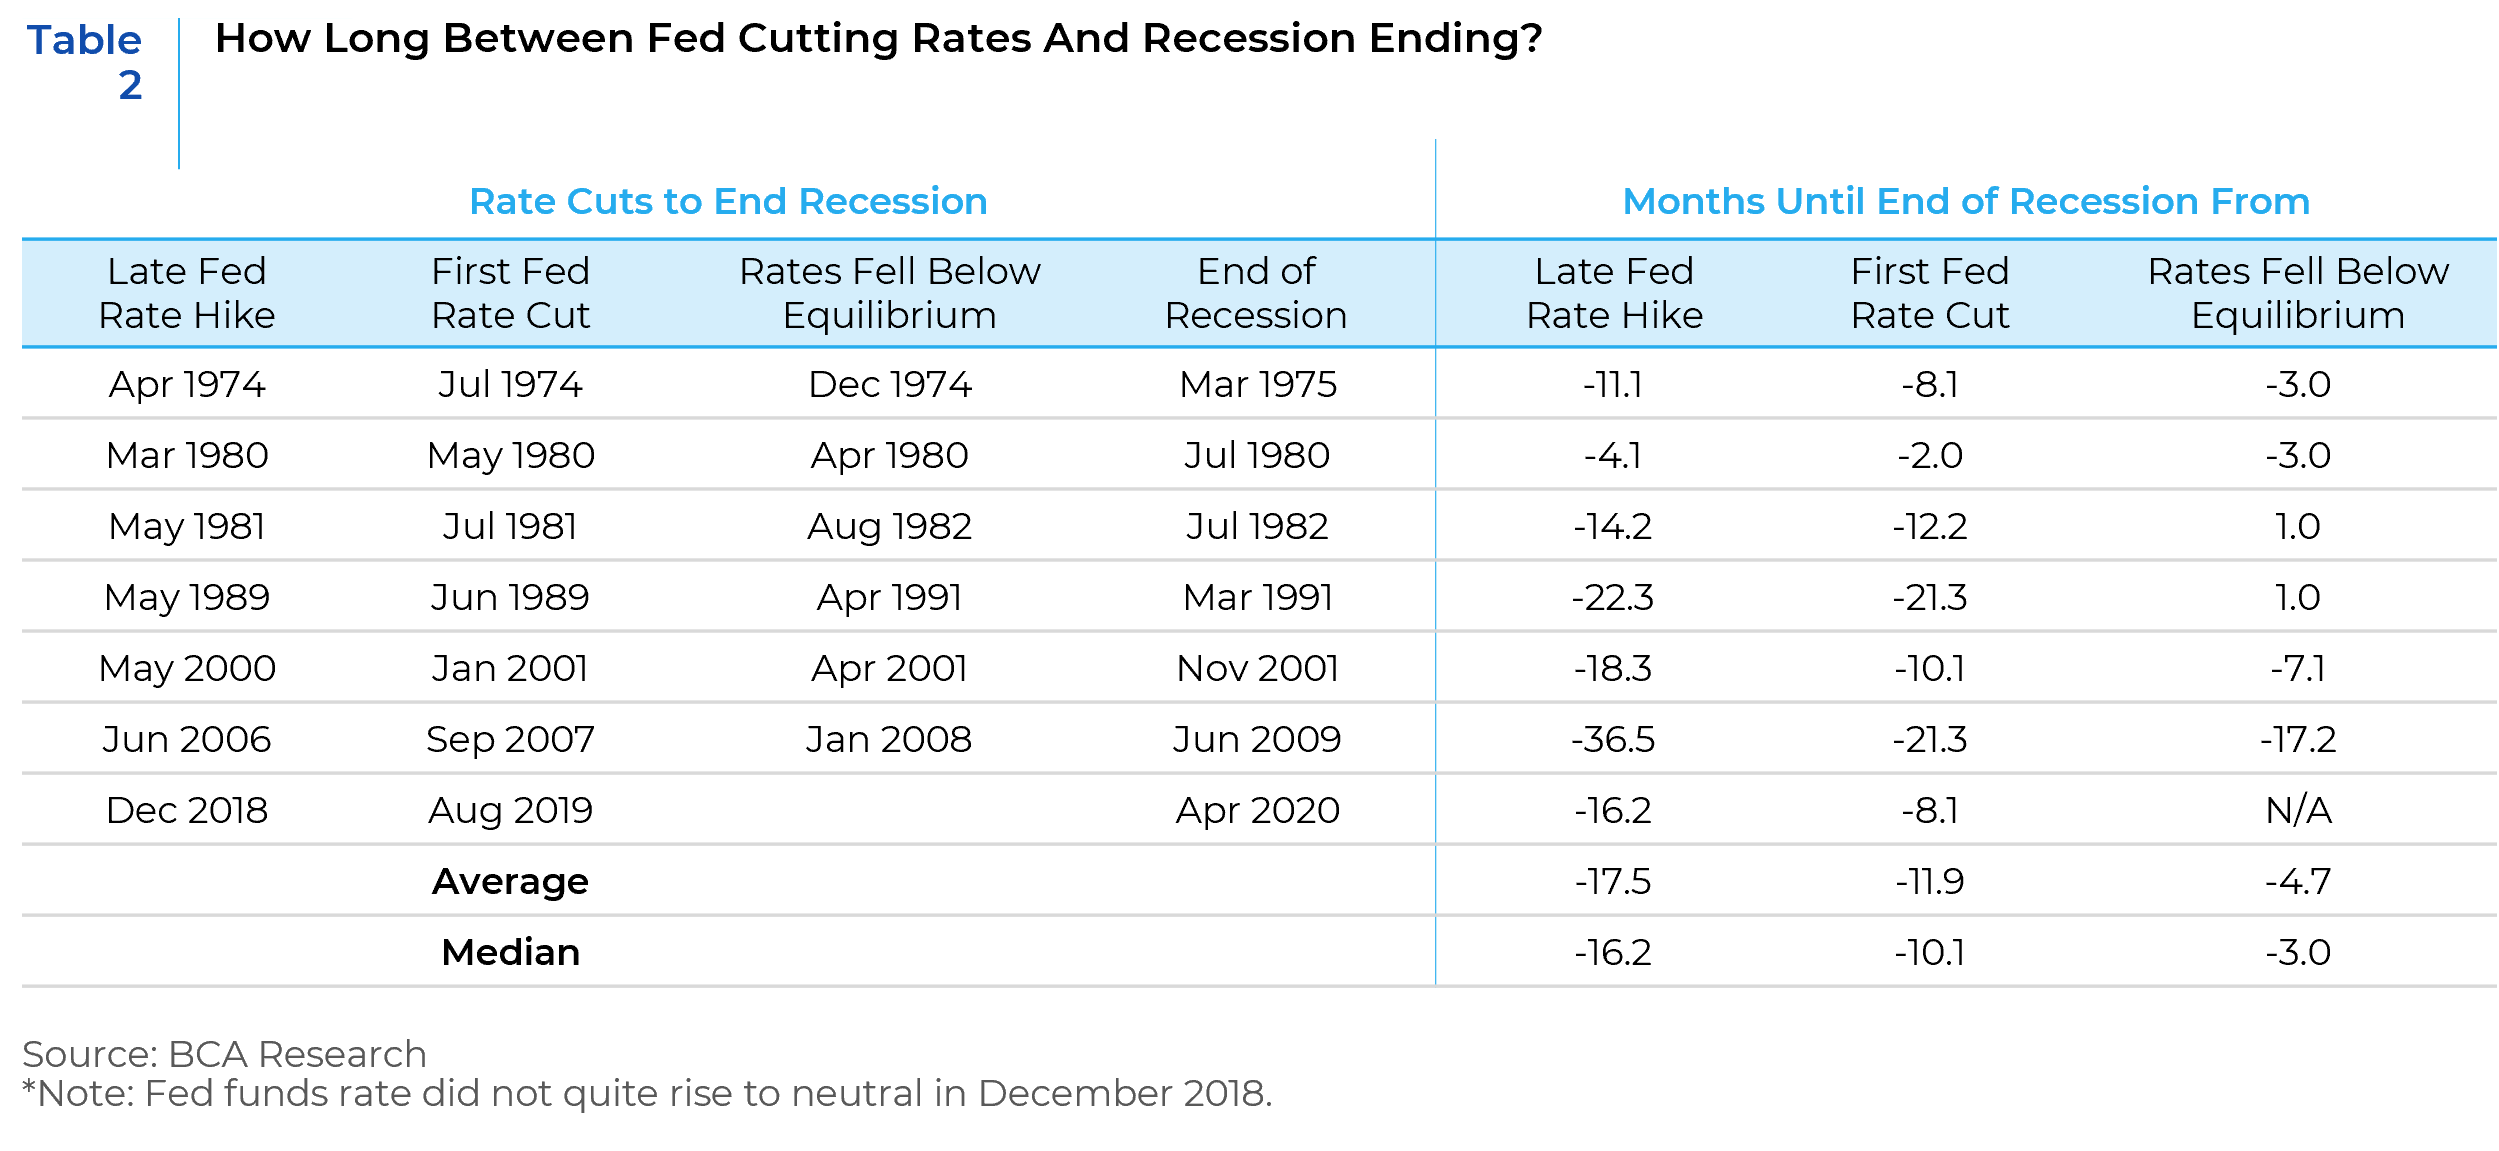
Moreover, as mentioned before, there are lags between monetary policy easing or tightening and its effects. On average, it takes 16 months after the Fed goes on hold and 10 months after the first rate cut before easier policy brings recession to an end (Chart 7 and Table 2). Even if the Fed were to cut rates soon and the chances of that are slim, it will take a while before the positive impacts come through.
Therefore, with a recession likely on the horizon and the Fed unlikely to be as accommodative as the market believes, investors need to exercise caution.
Earning Estimates Overly Optimistic
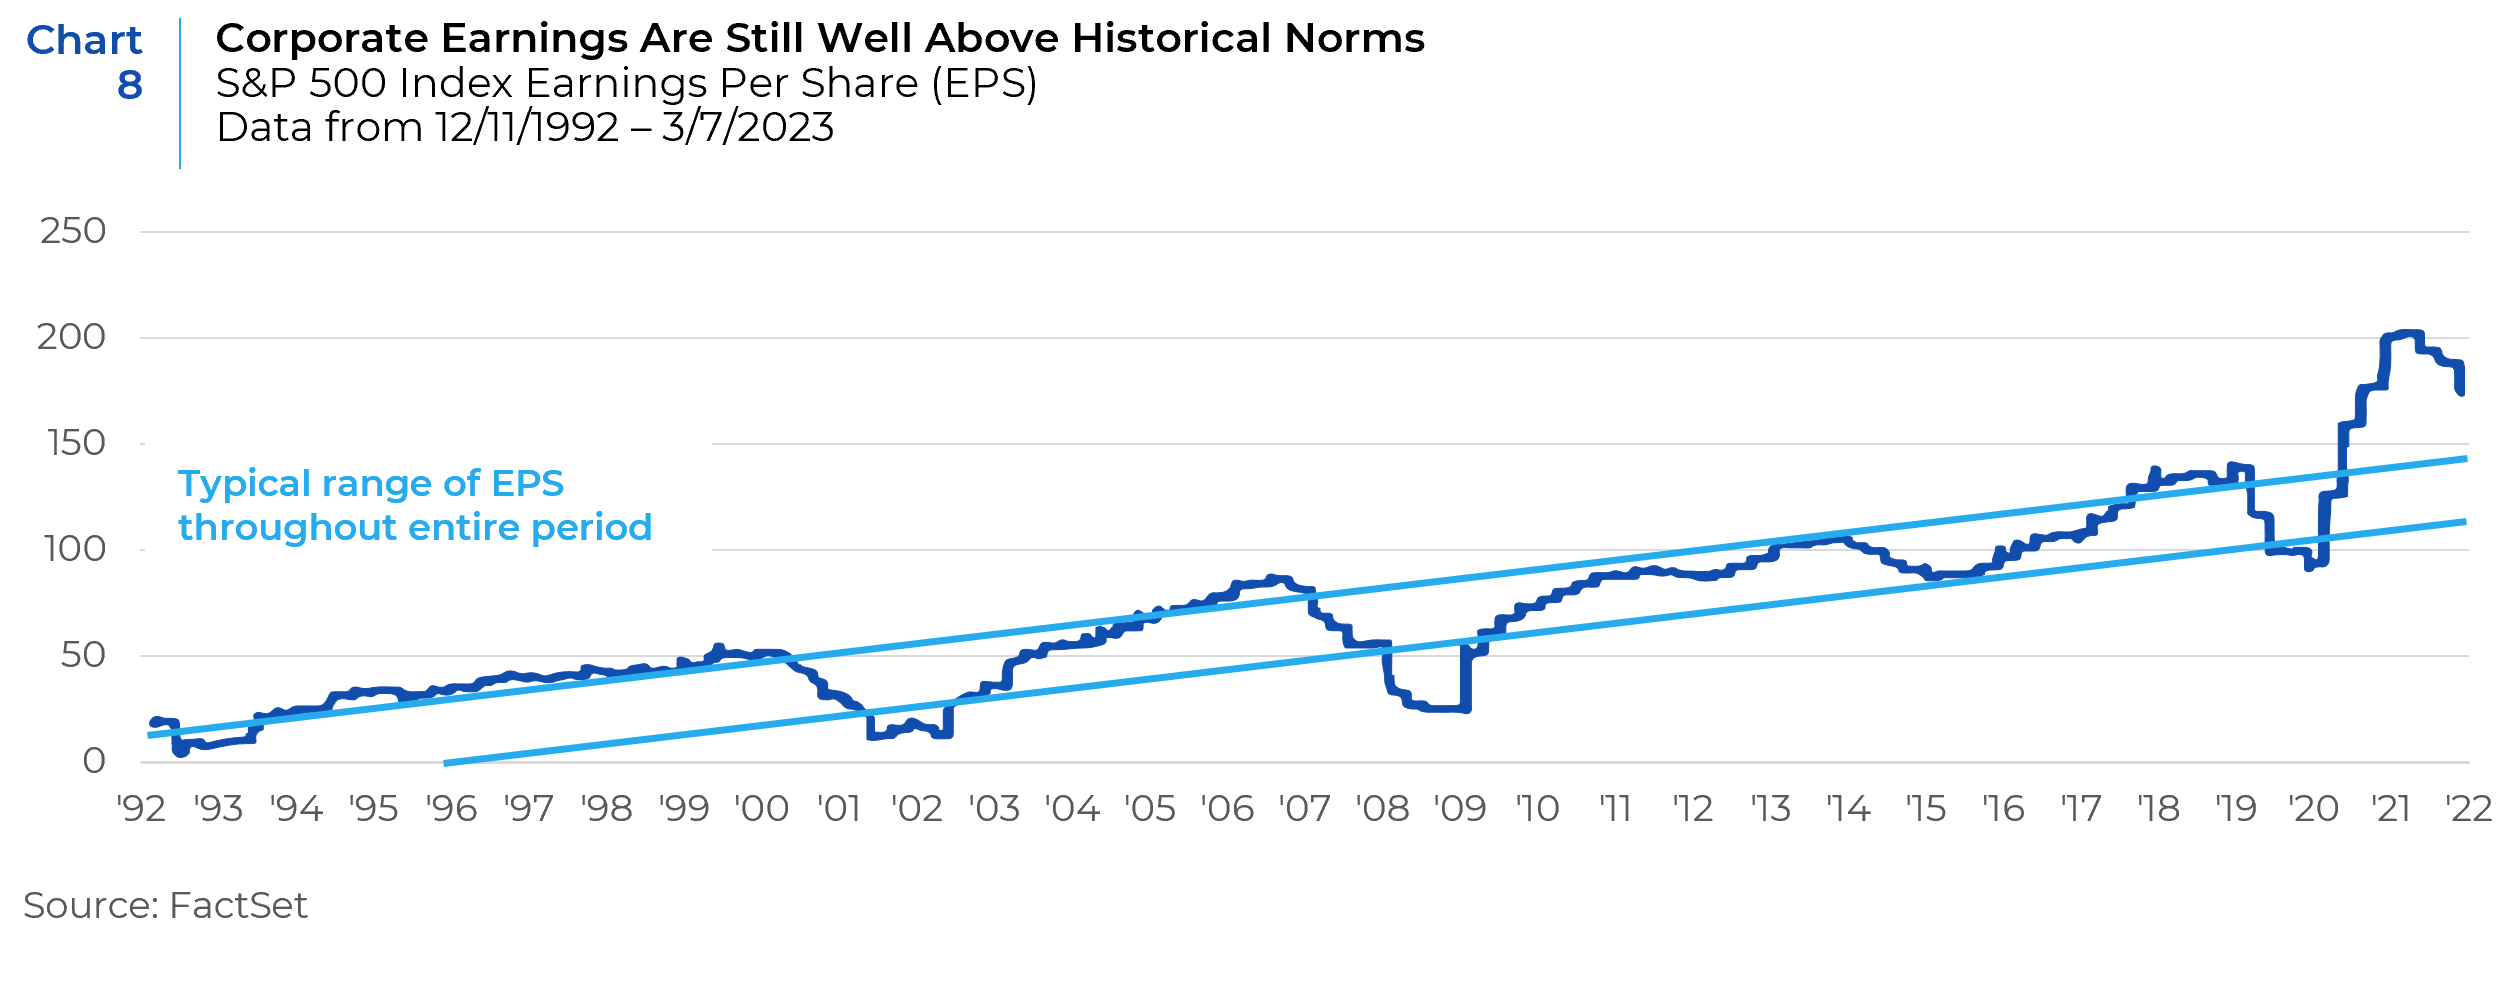
Corporate earnings jumped dramatically from 2021 through mid-2022 as companies raised prices amid supply chain disruptions caused by the pandemic and war in Ukraine. Fiscal policy during and coming out of the pandemic dramatically increased aggregate demand which, combined with supply restrictions, fueled inflation and top line revenue growth. Current conditions suggest a much more challenging outlook for profit growth in 2023. Corporate earnings have run far ahead of historical norms as shown in Chart 8. Earnings have moved higher in a remarkably narrow band since the 2008 Great Financial Crisis. However, at the end of February, earnings were about 23% above this historical, long-term band. If we account for the effects of inflation, “real” corporate earnings are still around 18% above trend.
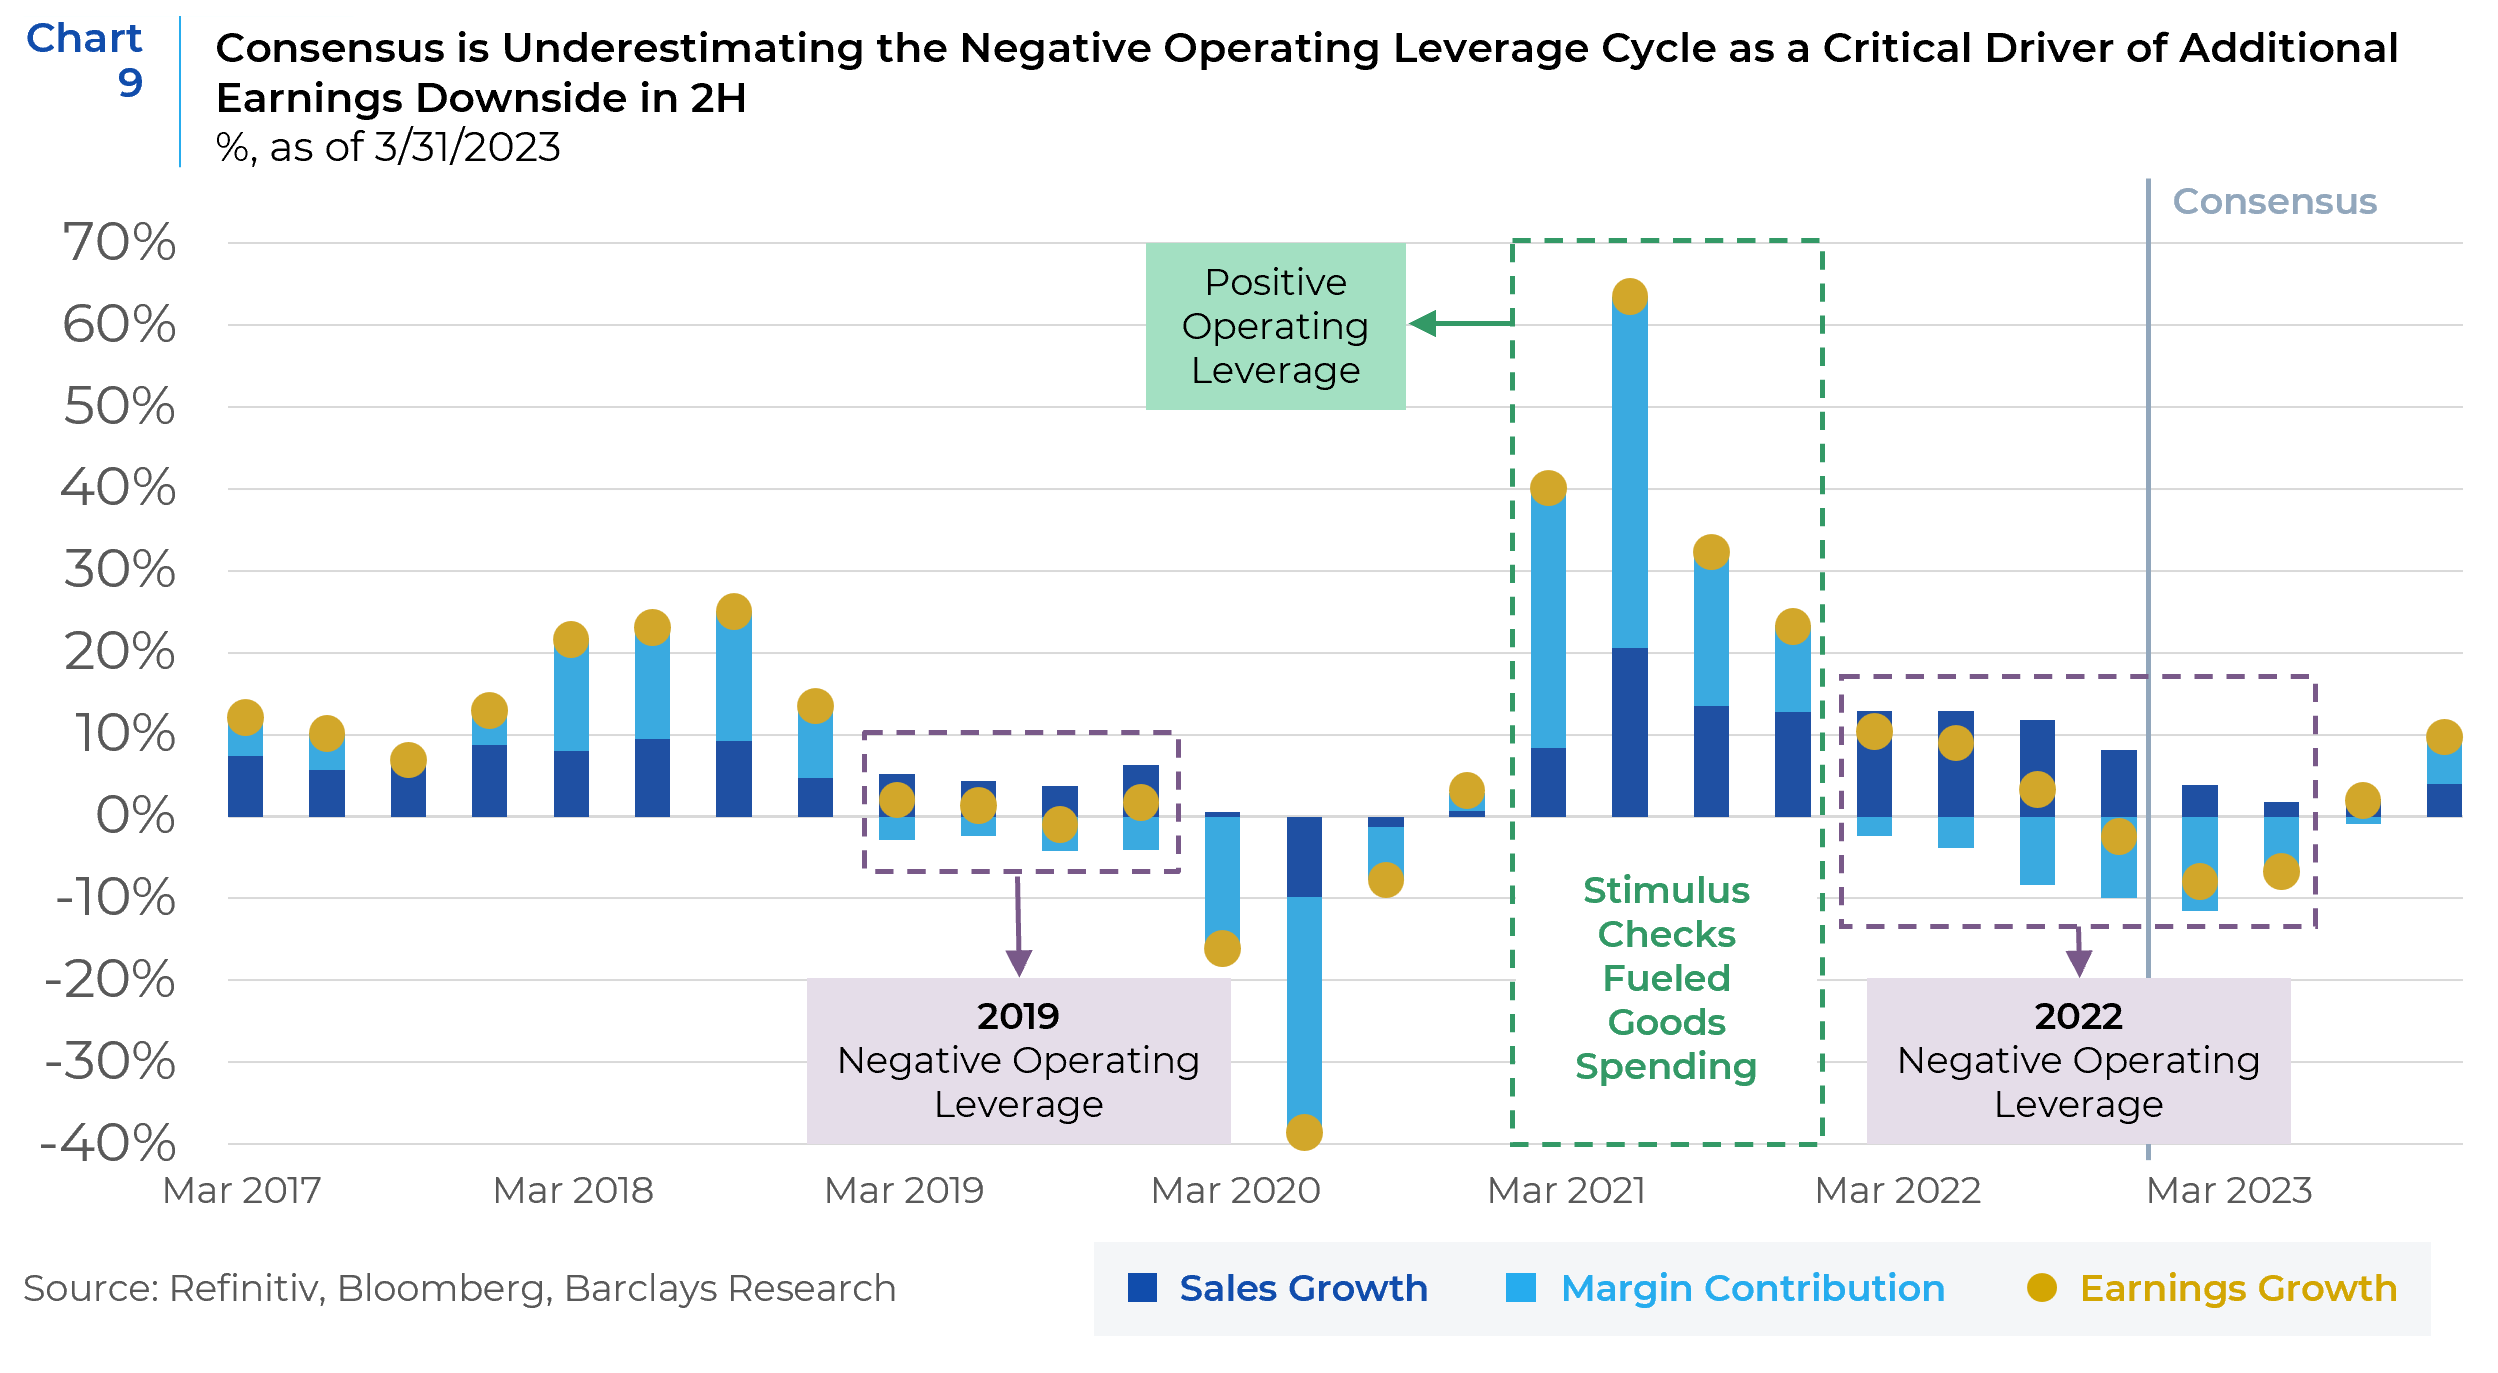
The fourth quarter 2022 earnings picture revealed that margin pressures pushed year-over-year S&P 500 earnings growth into the red, as aggregate earnings growth meaningfully lagged sales growth. Sales also decelerated much more rapidly than costs, a dynamic which has rarely occurred in the past four decades outside of a recession. Finally, negative operating leverage was seen proliferating throughout sectors, raising the risk of an earnings recession. And yet, as we head into the first quarter 2023 reporting season, consensus seems to be underestimating how significant the negative operating leverage cycle could get before this earnings recession is over, much as it underestimated positive operating leverage as inflation rose (Chart 9).
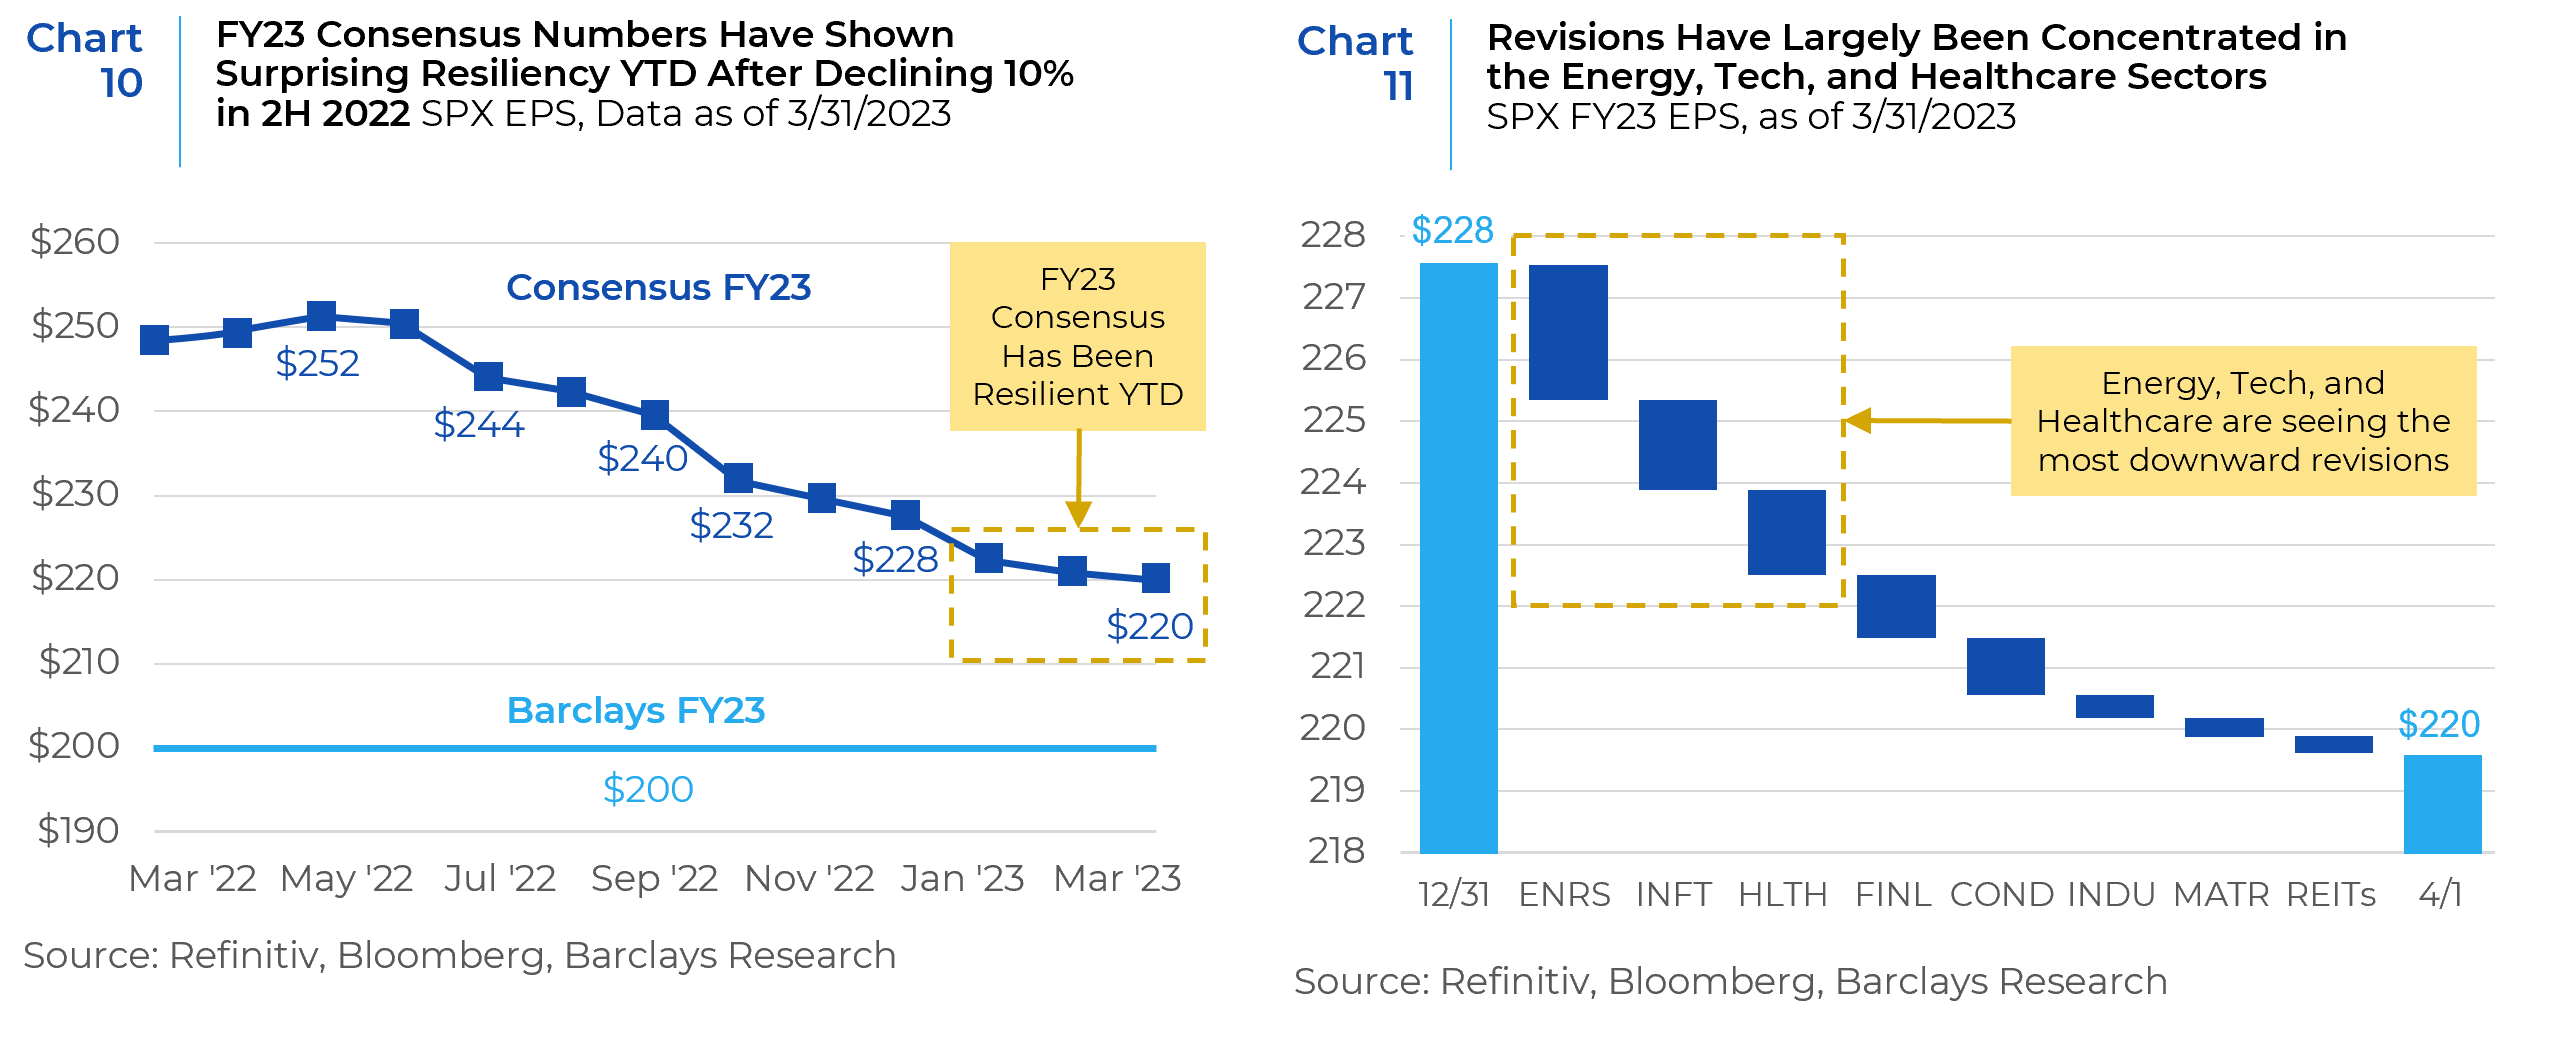
Consensus EPS estimates for 2023 were initially falling steadily through the second half of last year but have been surprisingly resilient in 2023 (Chart 10). There may be two underlying reasons behind this: 1) analysts are likely applying a “wait and see” approach to revisions in a highly uncertain, macro-driven equity market; 2) revisions to date have largely been concentrated in a handful of sectors, leaving room for a broader reset. Energy, Tech and Healthcare continue to lead the pack in terms of rationalizing their earnings guidance but in other sectors revisions have been much more modest (Chart 11).
Looking at valuations, the NTM PE multiple at the beginning of Jan’22 was 22x versus today’s 18.5x, after falling as low as 15.5x in mid-October last year. While current multiples are lower than at the start of ‘22, they have snapped higher from the lows even as recession risks have increased. Looking at sector multiples, the rotation toward high quality and counter-cyclical stocks has left valuations for Technology and some defensive sectors (Staples and Utilities) particularly elevated relative to long-term medians. On the other hand, cyclical valuations (ex-Discretionary) are much less demanding (Chart 12).
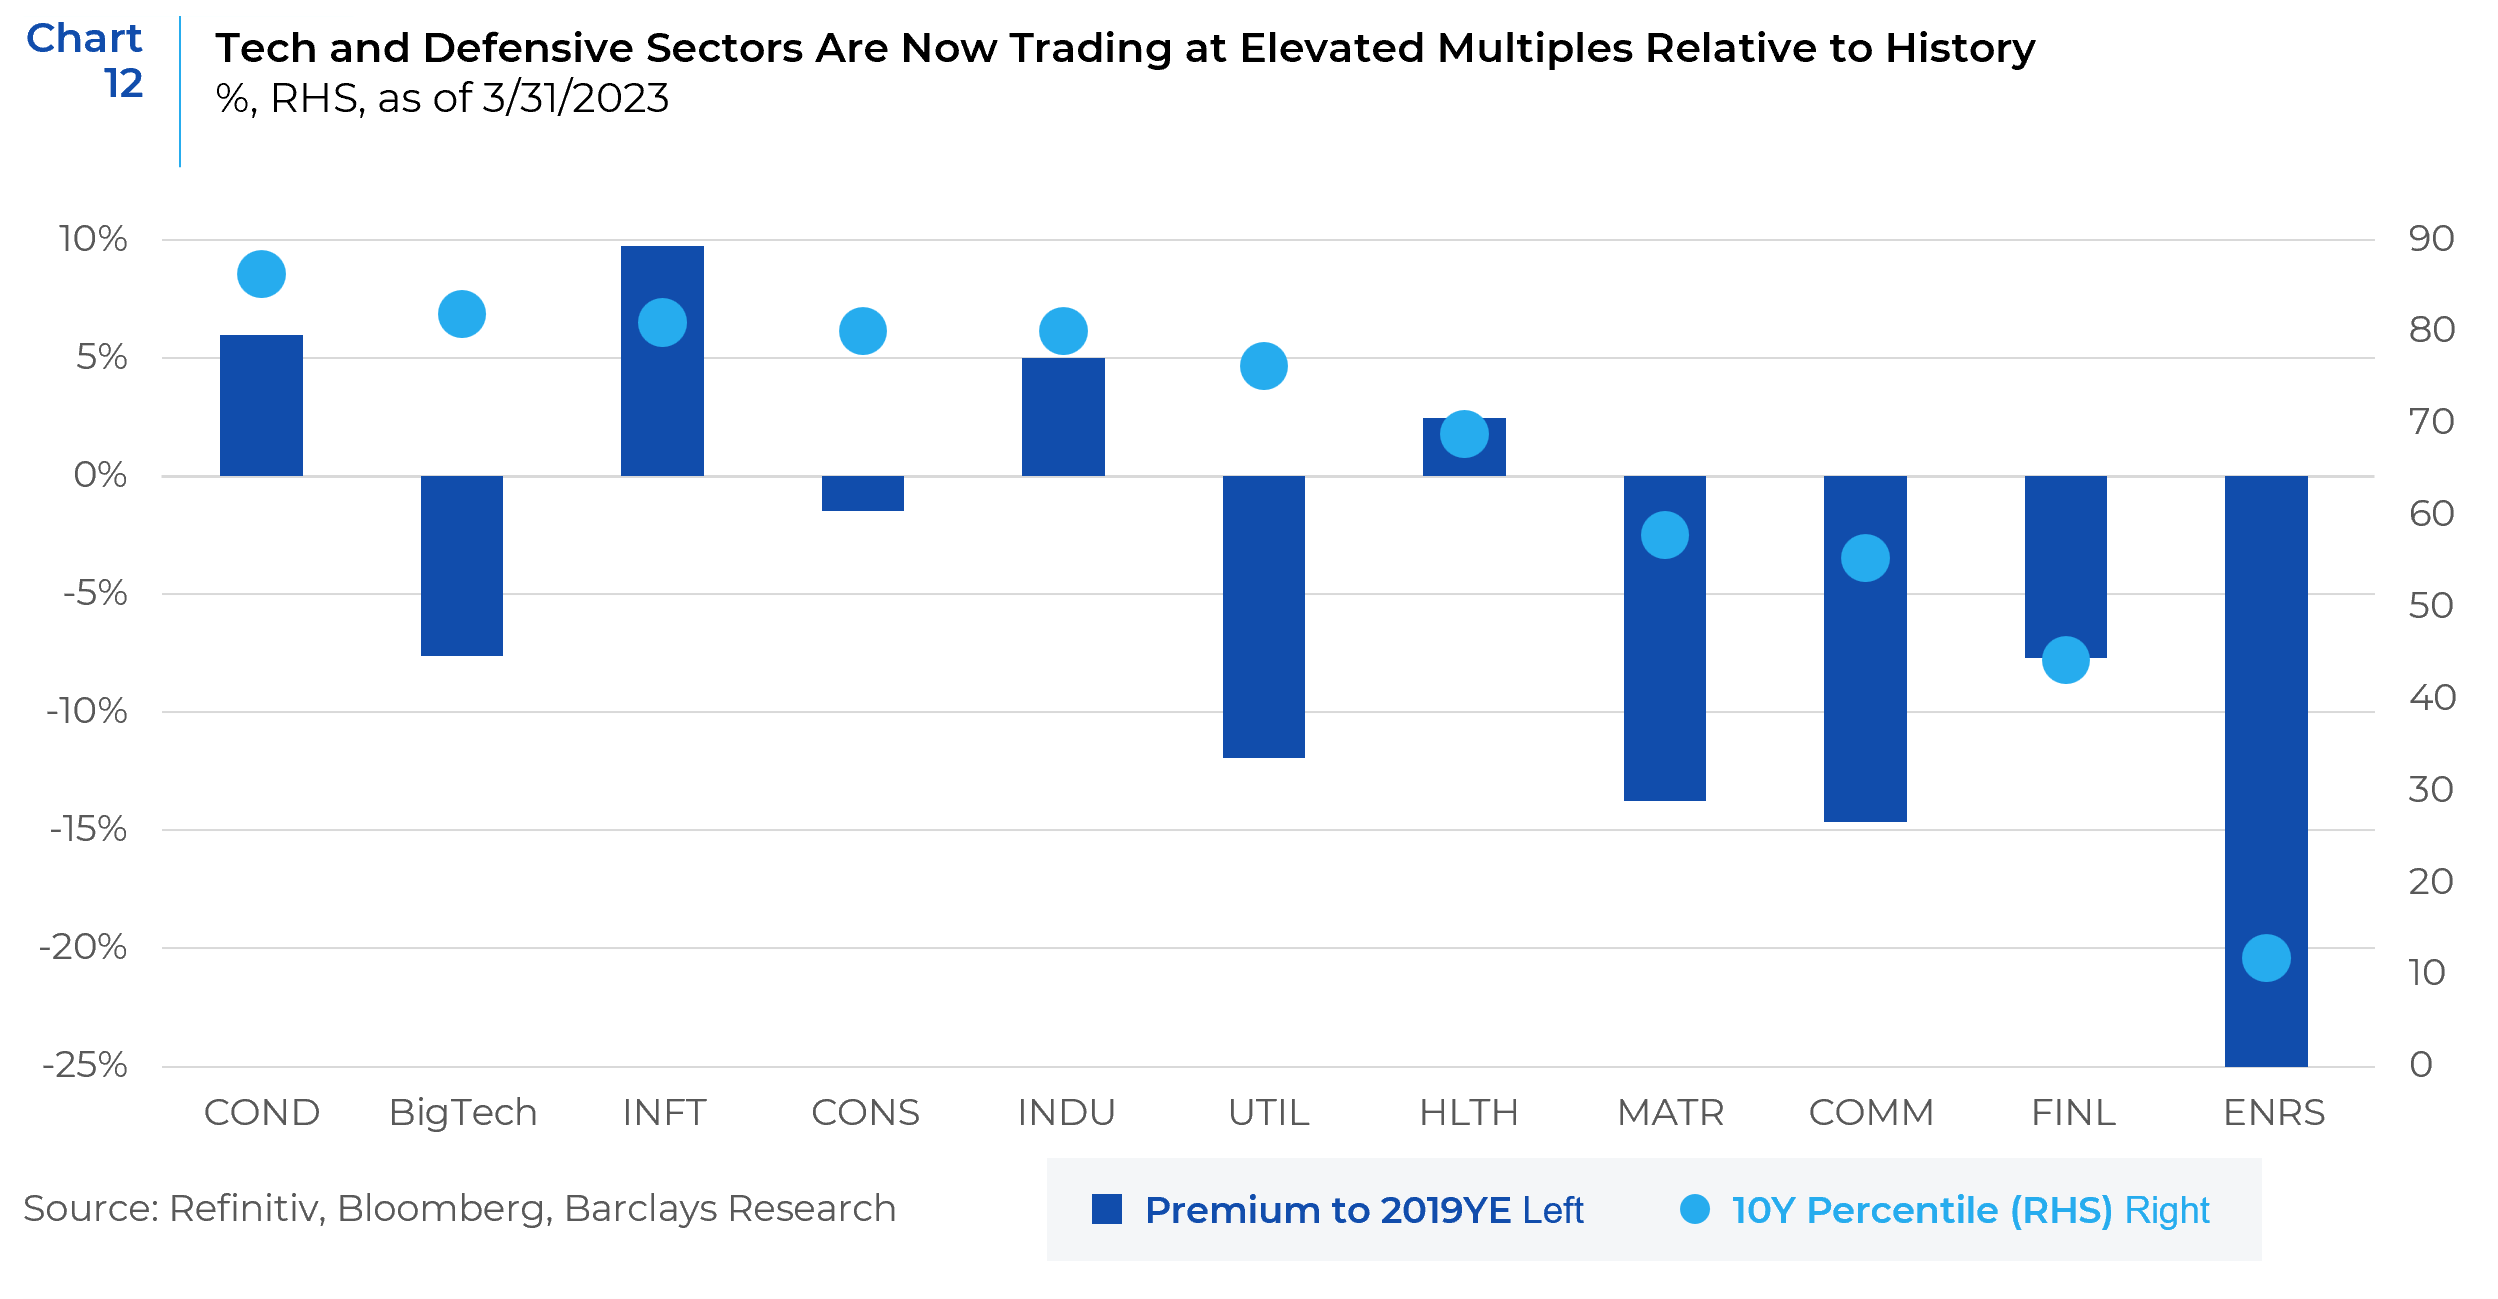
The recent flight to safety benefited growth stocks due to their inherent quality bias based on strong balance sheets, high profitability, and earnings stability. However, the rotation may have been amplified by the severe underweighting in investors’ portfolios to Tech heading into 2023. So, while EPS estimates for Tech have seen a more substantial reset than most, it has also left the sector among the most over-valued. While defensive exposure to these growth names seems prudent given the expectations for a shallow recession in coming months, their full valuations are concerning. Both Staples and Utilities have been trading near the 80th percentile of P/E multiples over the last decade. Among traditionally defensive sectors, valuations for the Healthcare sector look less rich, particularly as the group has not participated in the post-banking crisis flight to safety and large liquid Healthcare names are likely to benefit if recession concerns intensify. Among cyclicals, Discretionary names appear expensive and exposed to negative leverage. Industrials exposure has been justified by strong fundamentals, but the sector also appears to have premium valuation. Valuations look more attractive for Financials with the banking crisis looking relatively contained, for Energy after substantial estimate revisions, and for Materials as a way to position for the China reopening narrative.
Narrow leadership in Equity Markets
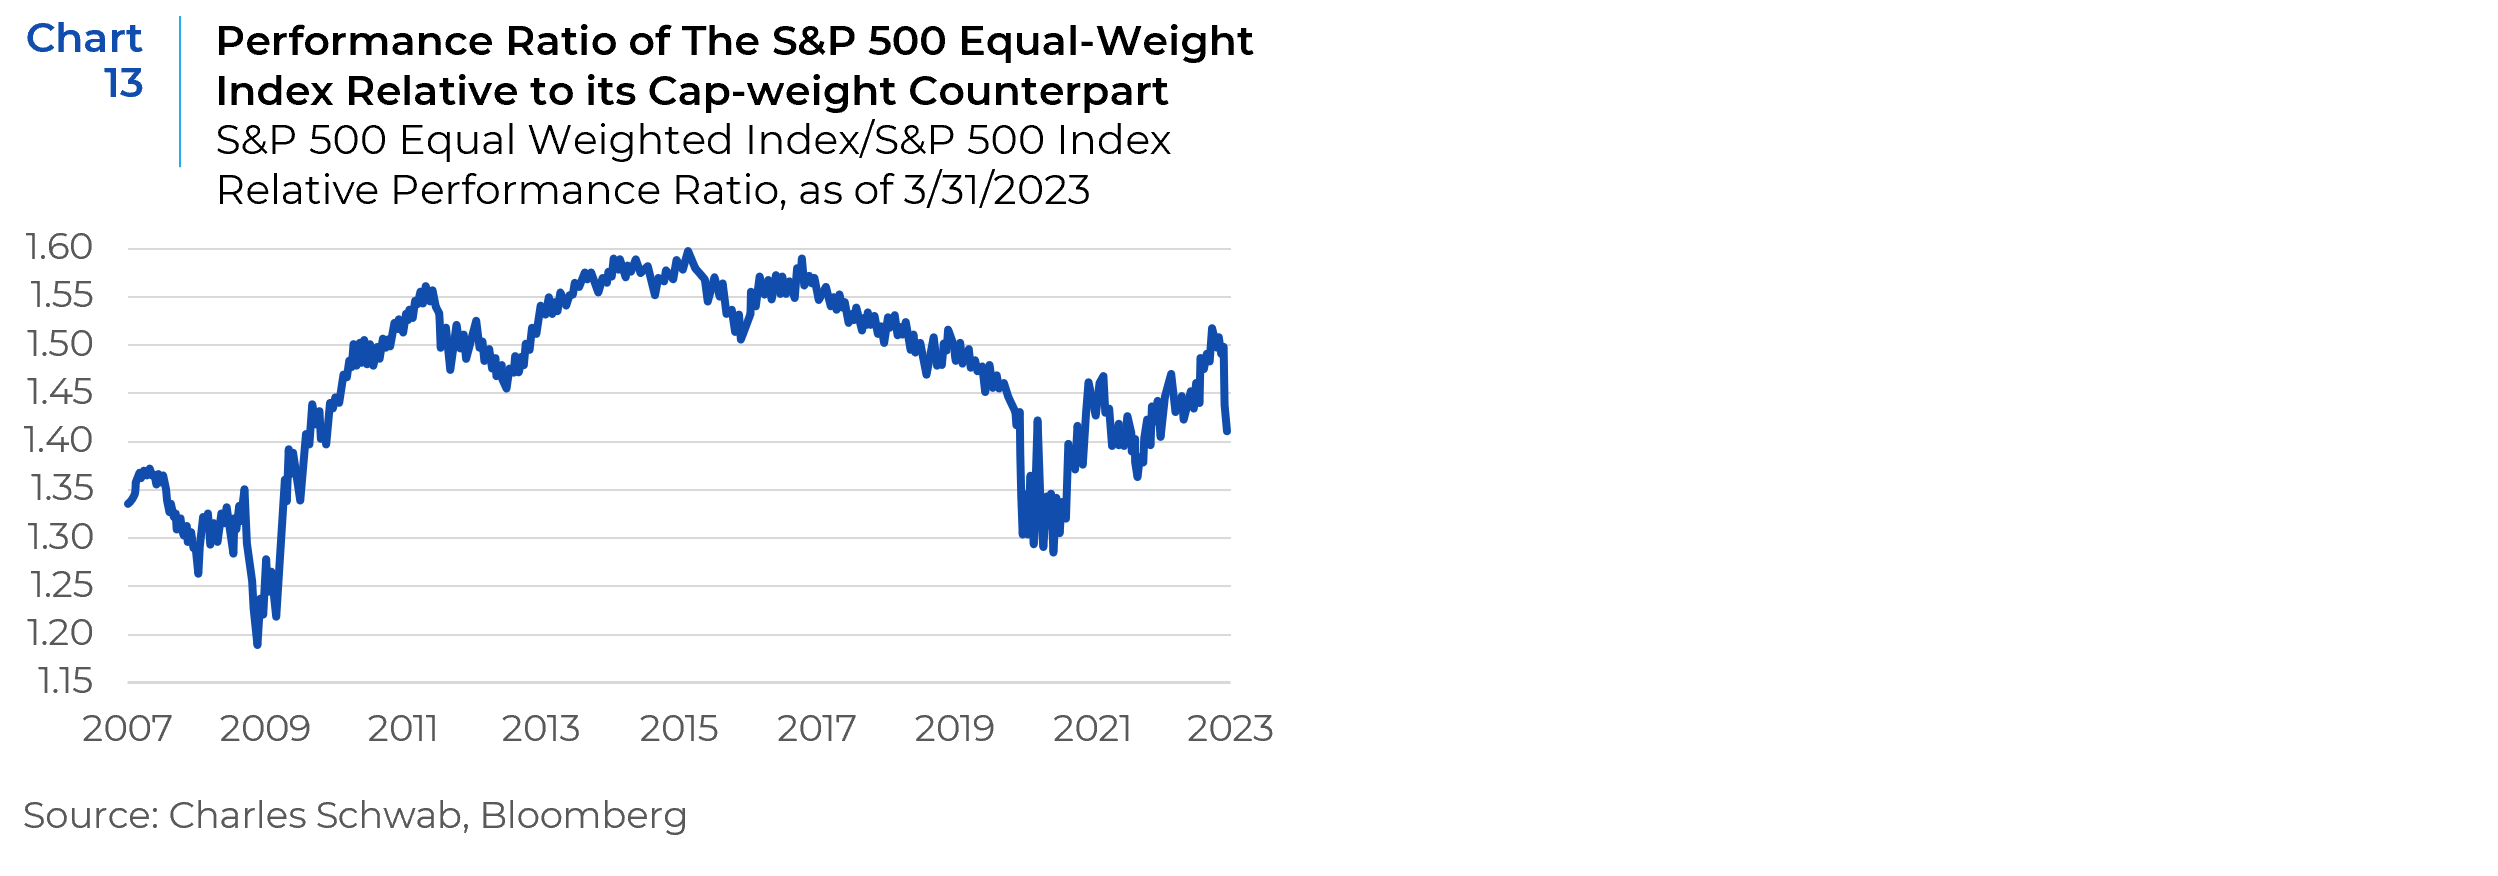
In the face of banking stress and a hawkish Federal Reserve, stocks have advanced impressively so far this year, but the prospects for continued strength do not look good. As seen in Chart 13, the performance ratio of the S&P 500 equal-weight index relative to its cap-weight counterpart has plunged this year, eliminating much of the edge equal-weight had until recently. A look back at the past two bear markets shows that a steep drawdown in this ratio is consistent with acute pain in the broader market.
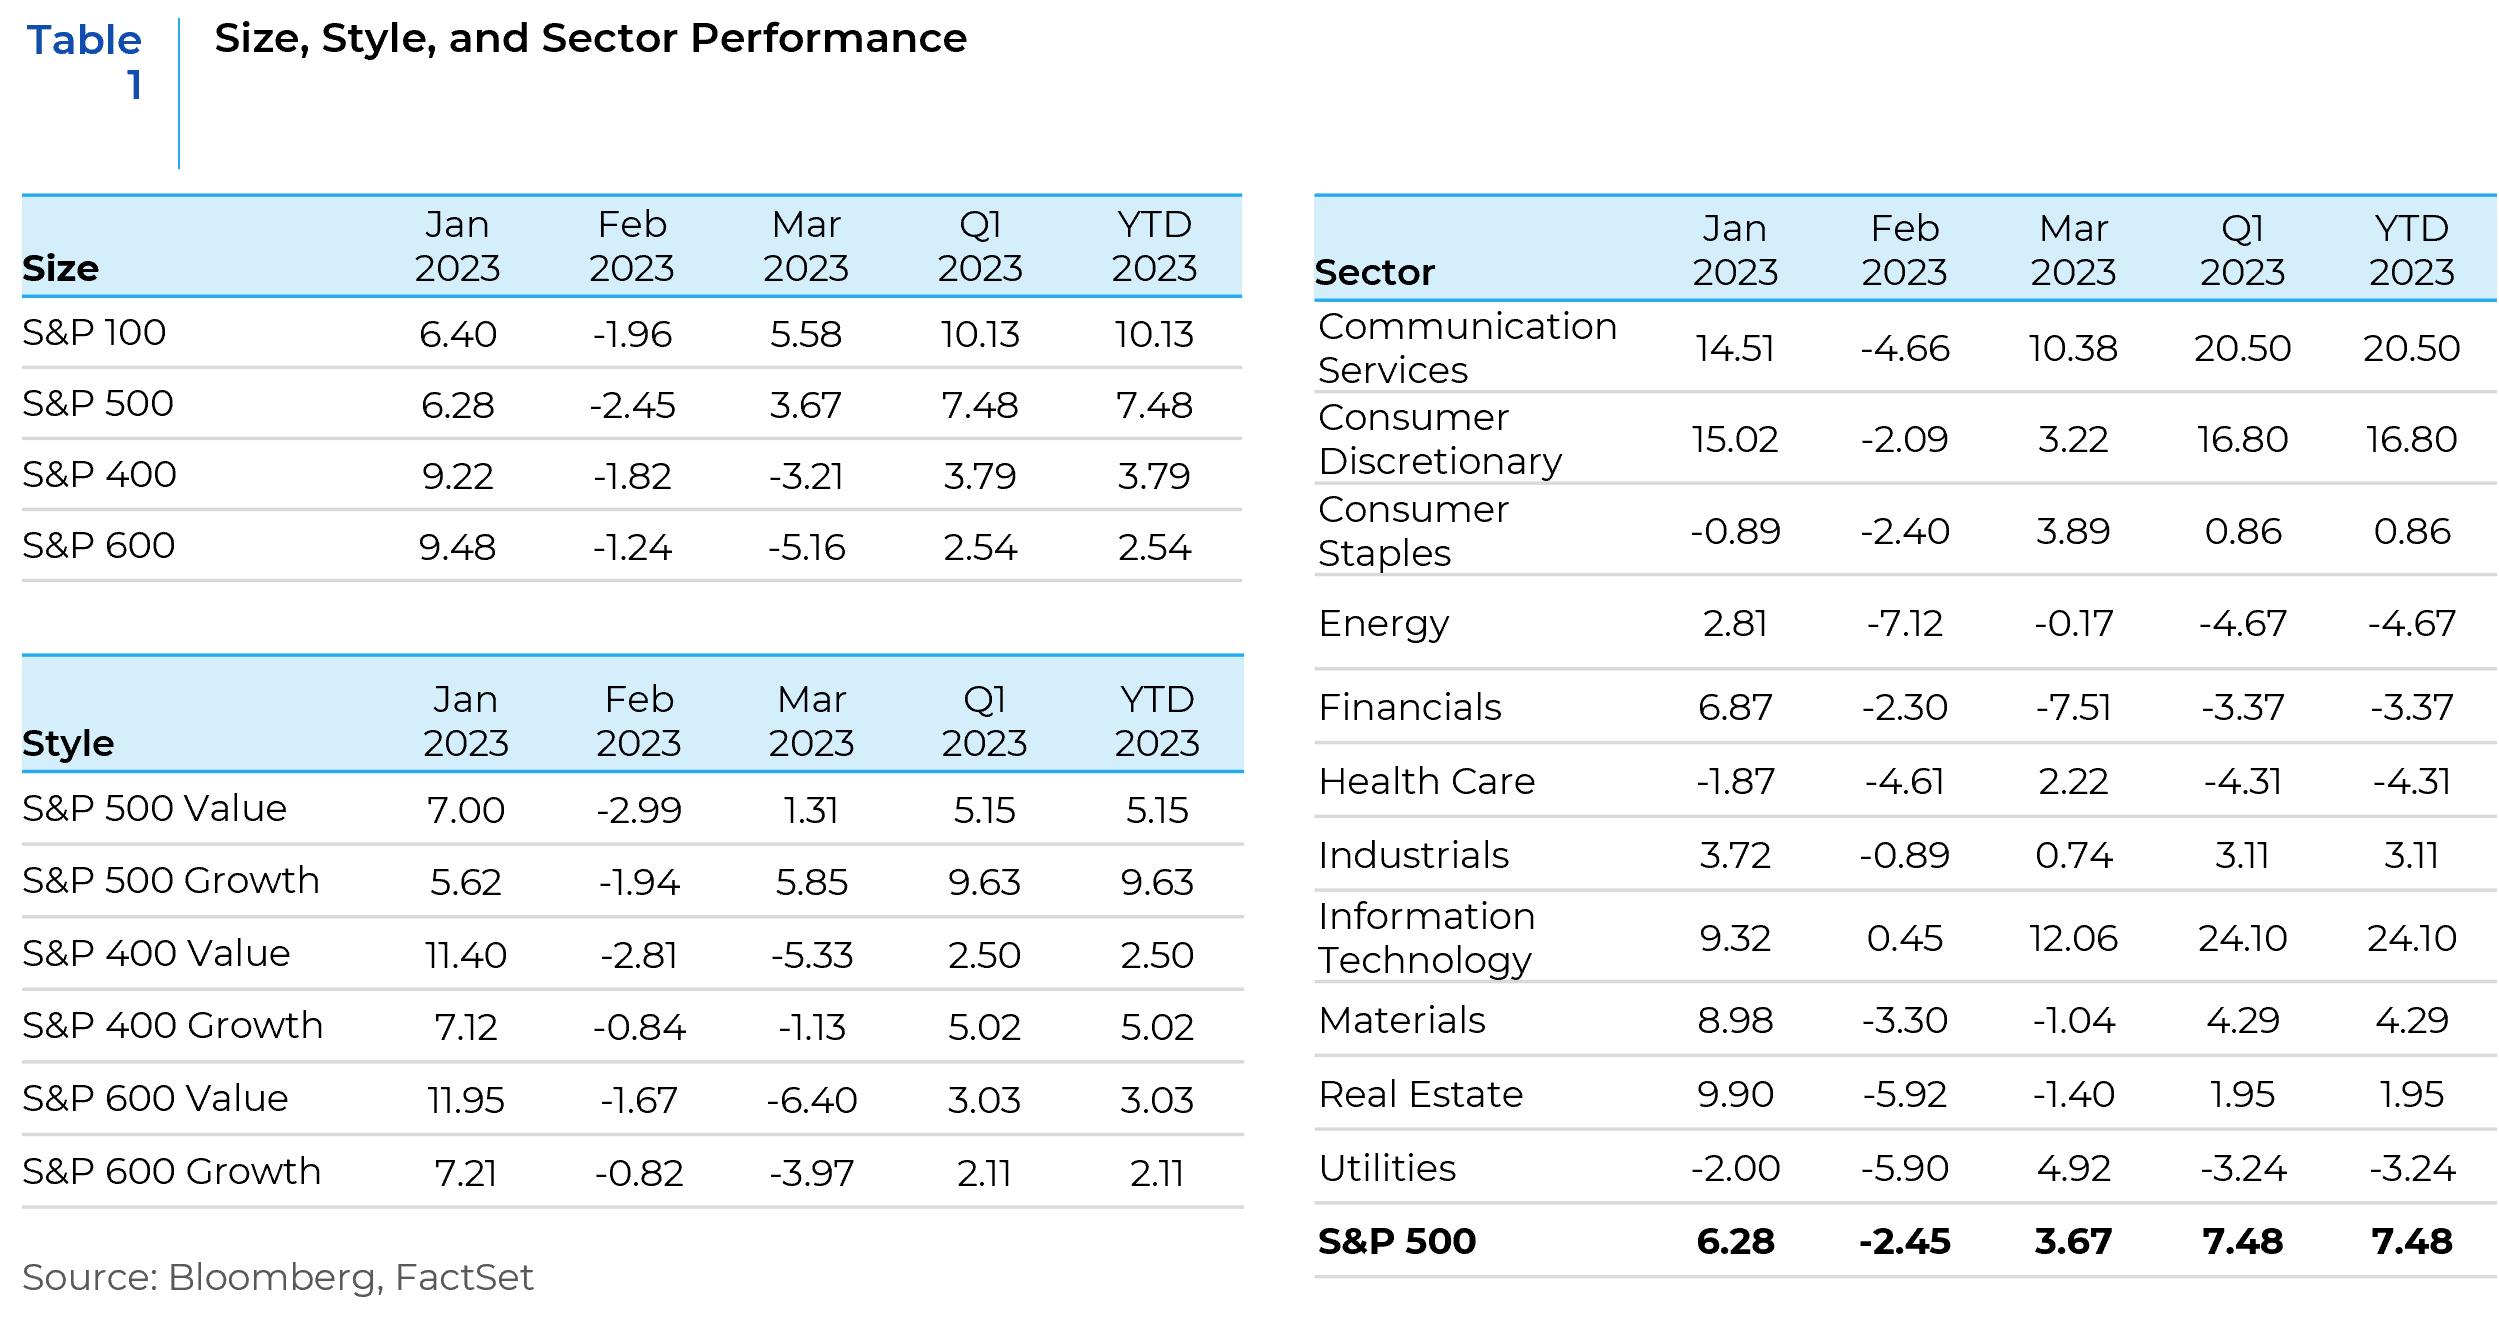
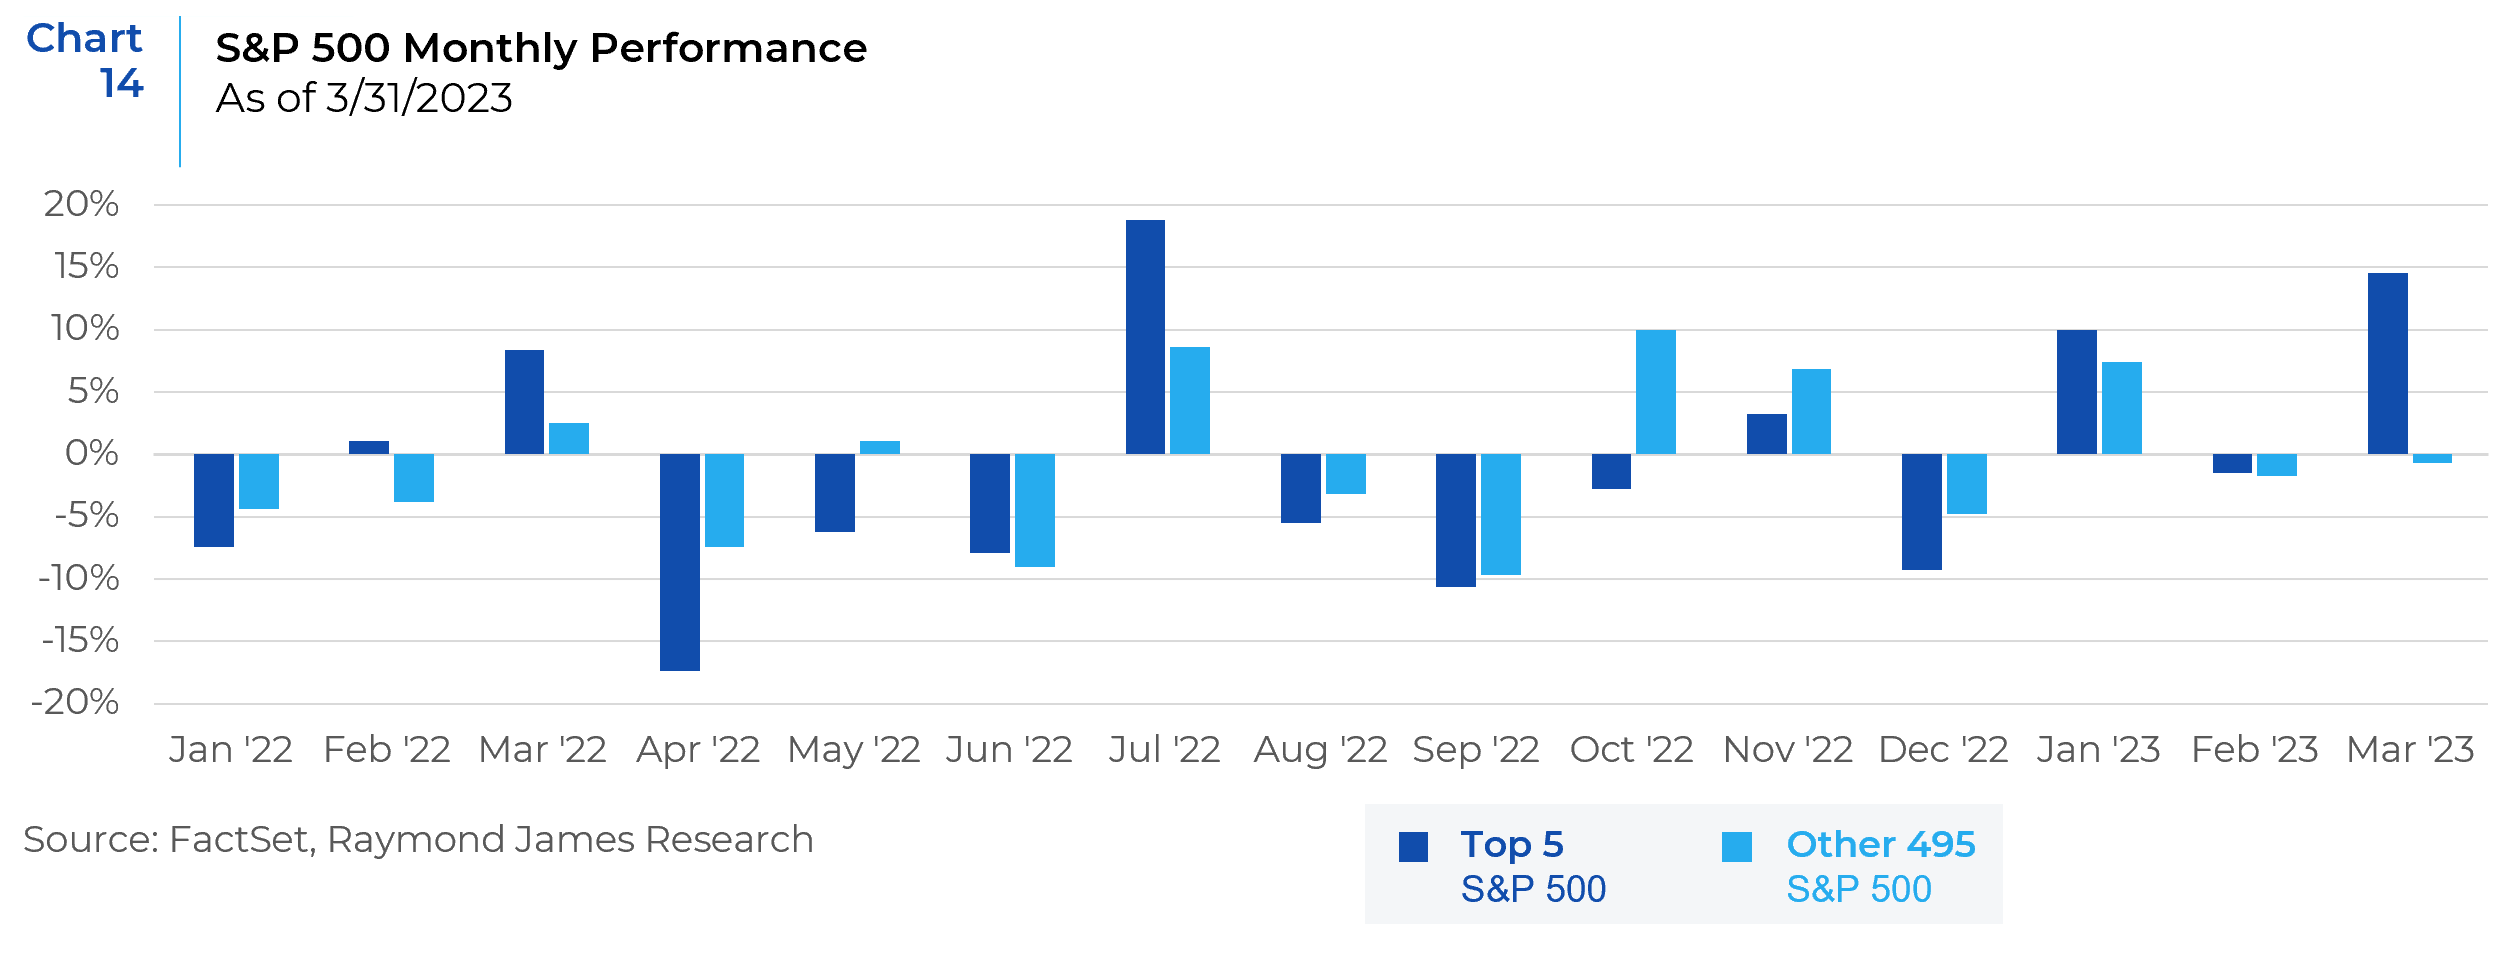
Zooming in on current market trends, performance this year has been dominated by just a handful of names. As shown in Chart 14, the five largest stocks in the S&P 500 have dominated performance this year, with their average performance totaling +10.1% in January, -1.5% in February, and +14.4% in March. That is in sharp contrast to the rest of the index, which saw an average move of +7.4% in January, -1.7% in February, and -0.5% in March.
Unsurprisingly, the largest stocks’ outperformance is consistent with narrow leadership at the sector level. Chart 15 maps out the S&P 500 sector performance each week this year. The “growth trio” of Tech, Communication Services, and Consumer Discretionary have been on top of the leaderboard this year, while all the rest of the sectors have stayed in negative territory.
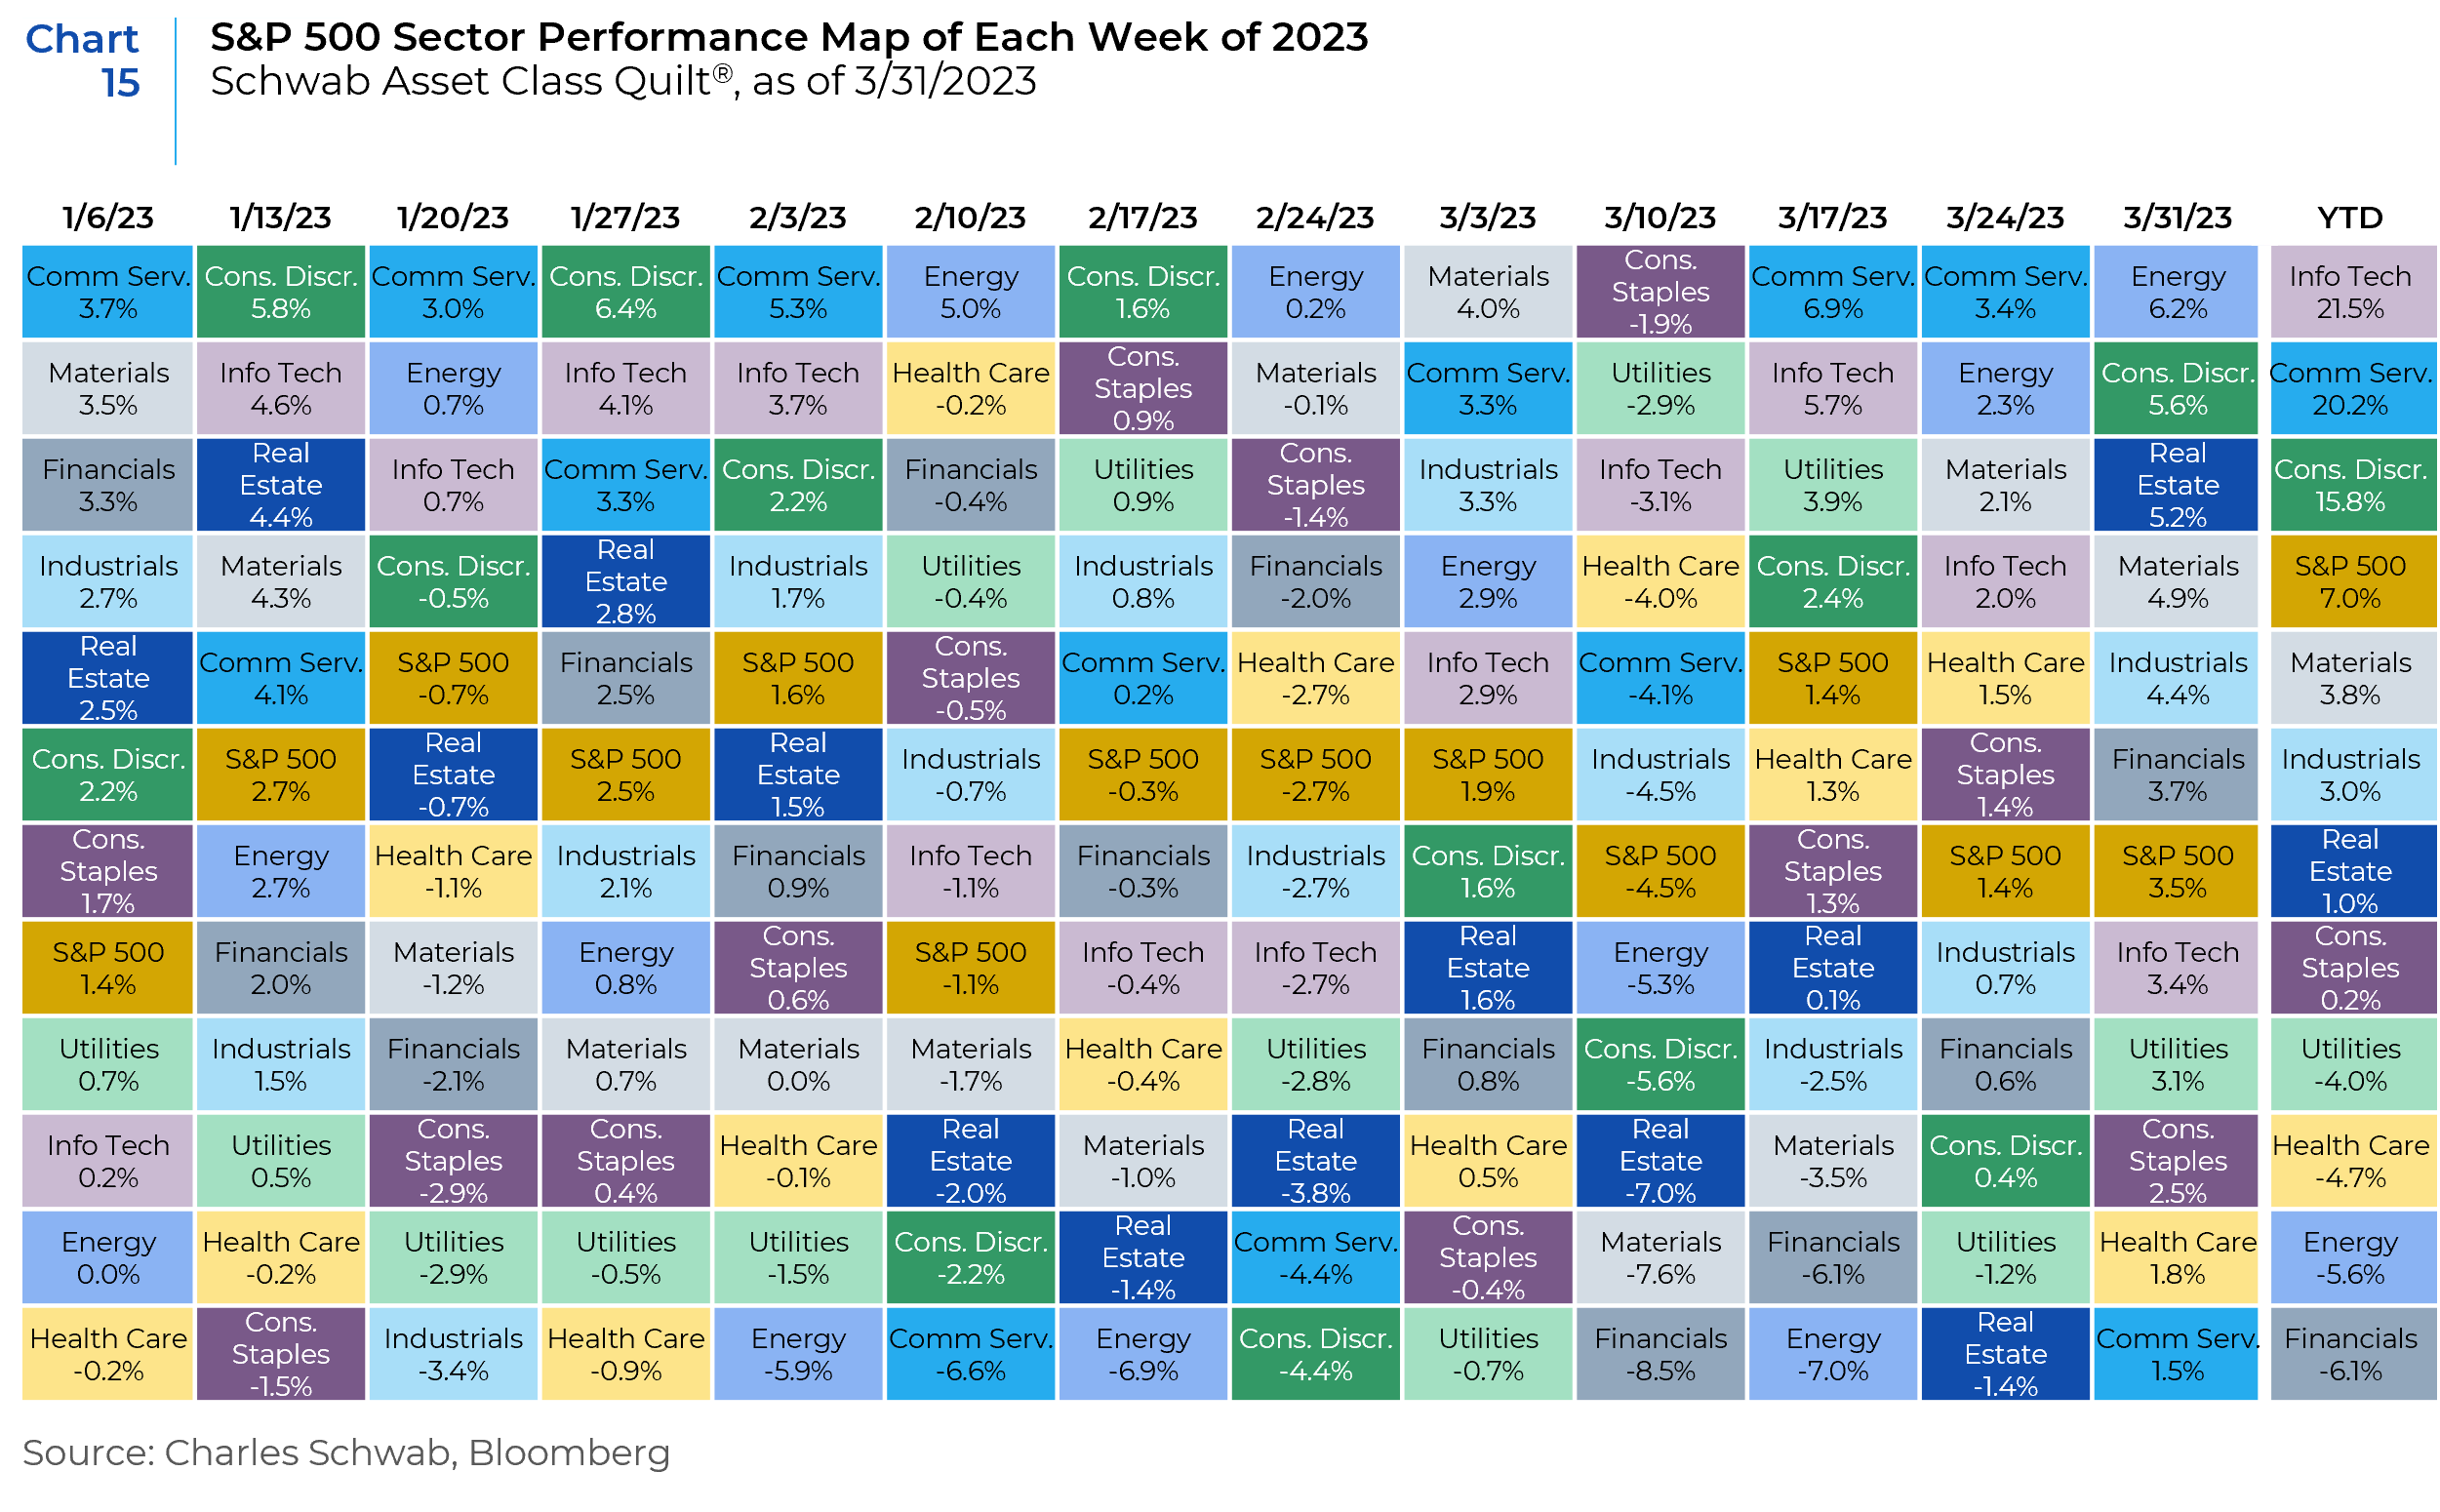
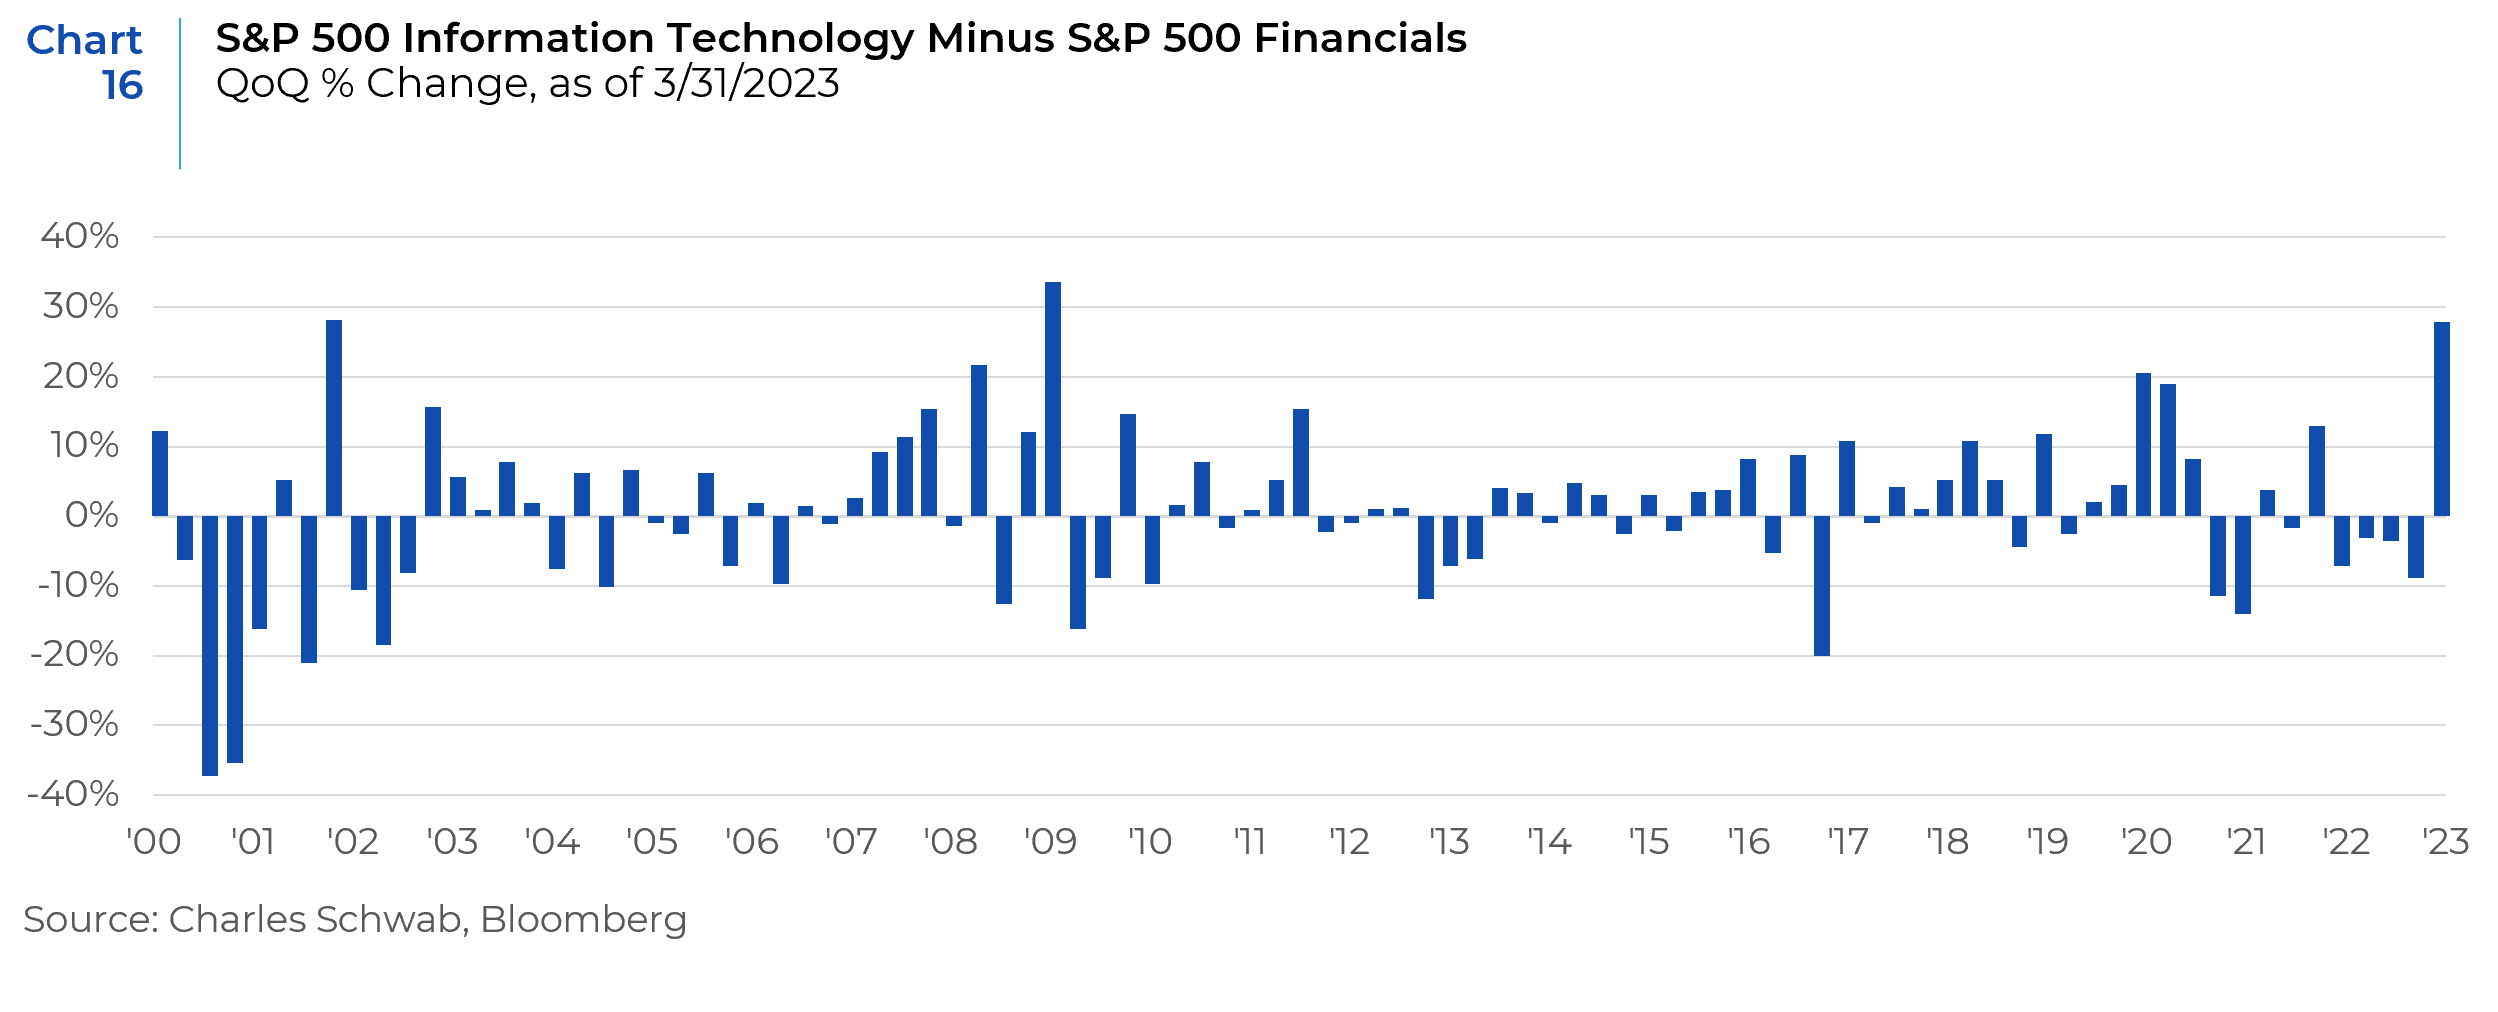
As the chart shows, the Financials sector has only spent one week at the bottom this year, but persistent pressure has been enough to send the sector to the bottom of the leaderboard year-to-date. That’s far from Tech’s 21.5% gain, putting the spread between Tech and Financials at 27.6% for this year, as shown in Chart 16. That is the widest gap since the first quarter of 2009.
The widening divide between Tech and Financials is not an encouraging sign because the latter sector is typically looked at for confirmation of a new bull market. History shows that Financials’ lack of participation has often capped the upside for a rally. Conversely, over the past year, the concentration in leadership up the cap spectrum—and in growth sectors like Tech—has at times preceded drawdowns and bouts of volatility for the market. Tech is almost never considered a value sector, but the recent rebalancing of the S&P 500 Value Index made the sector the second largest in the index, only behind Financials. This also creates another tailwind for growth.
So far this year, the indexes are showing better performance courtesy of the strength of the largest stocks, but churn under the surface has resurfaced. Without confirmations from longer-term breadth, rallies have a tendency to ultimately fade. Strong outperformance from the largest stocks can power indexes higher, but a healthier market would be characterized by greater breadth.
Investment Implications
Given the complicated economic and market backdrop, investors are facing a difficult journey and increased market volatility. While the interest rate outlook remains uncertain, the post-GFC world of ultra-low rates is clearly behind us. Inflation remains elevated. And we expect economic growth to slow. In other words, the waters remain muddy till there is more clarity around the direction of rates, inflation, and growth.
It appears that we are in a holding pattern. On the one hand, the bond market is too pessimistic, while on the other, risk assets and US equity markets are too optimistic and have been impressively resilient. Collectively, financial markets are pricing in the best of both worlds – a recession that allows rates to be low and brings inflation down sharply, yet one that does not have a massively negative effect on corporate earnings. This does not appear to be a realistic scenario. Ultimately, the economic landing will be determined by when inflation is finally anchored and how quickly the associated downside risks are mitigated. The probabilities remain the highest for a moderate recession.
Heading into a recession, placing less emphasis on style distinctions is usually a better play. Historically, there’s been no clear winner when it comes to growth versus value investing during recessions. Growth beat value on a total return basis in five of the last eight recessions. However, the average maximum drawdown over those periods slightly favored value. Quality companies with higher profitability and healthy balance sheets may offer attractive potential in a recessionary environment. Investors tend to favor quality companies in more defensive sectors, such as utilities, health care and consumer staples. As consumer and industrial demand wanes, commodities typically lose their luster. However, gold may continue to shine amid heightened economic and market uncertainty. Real estate investment trusts (REITs) tend to lag as poor economic conditions weigh on residential and commercial real estate markets. With ultra-low rates behind us, there is less comfort in owning businesses with high expectations for future earnings growth but little in the way of current profits. Companies’ financial strength and business models will remain at the forefront. We expect today’s higher cost of borrowing to spur a significant rise in debt service costs and pressure earnings. More financially sound companies will fare better as the economy weakens.
References: FactSet, Bloomberg, American Century Investments, Barclays Research, BCA Research, Alpine Macro, Charles Schwab, Nuveen
This report is neither an offer to sell nor a solicitation to invest in any product offered by Xponance® and should not be considered as investment advice. This report was prepared for clients and prospective clients of Xponance® and is intended to be used solely by such clients and prospects for educational and illustrative purposes. The information contained herein is proprietary to Xponance® and may not be duplicated or used for any purpose other than the educational purpose for which it has been provided. Any unauthorized use, duplication or disclosure of this report is strictly prohibited.
This report is based on information believed to be correct, but is subject to revision. Although the information provided herein has been obtained from sources which Xponance® believes to be reliable, Xponance® does not guarantee its accuracy, and such information may be incomplete or condensed. Additional information is available from Xponance® upon request. All performance and other projections are historical and do not guarantee future performance. No assurance can be given that any particular investment objective or strategy will be achieved at a given time and actual investment results may vary over any given time.