
Market Review
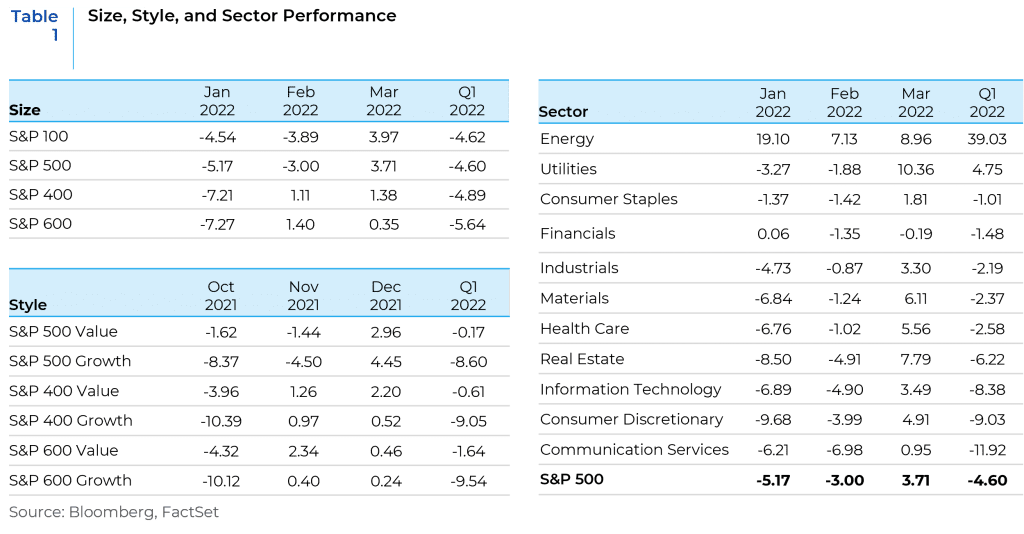
US equities came under pressure in the first quarter of 2022 with the S&P 500 suffering its first quarterly decline since the depths of the pandemic in March 2020. While the Fed’s hawkish policy pivot dominated the headlines, concerns about dampened fiscal policy support were flagged as another overhang. Inflation and its monetary policy implications remained the overriding fundamental risk in the quarter, but stocks also had to deal with the headline risk surrounding the Russian invasion of Ukraine. High profile earnings blowups, negative guidance trends, waning earnings revision momentum, bond outflows, technical deterioration and a lack of liquidity played into the bearish narrative as well. The FOMC announced the long-awaited liftoff for interest rates with a 25bp hike at their March meeting, in line with expectations. Despite this long-awaited Fed move off the zero lower bound and expectations for an accelerated pace of tightening in the months ahead, US equities were able to post gains in March after two months of notable declines. Growth outperformed value in March after two months of dismal performance but lagged for the quarter as a whole. Energy and Utilities were the only two sectors that posted positive returns for the quarter. As the quarter ended the inversion of the yield curve (US 10Y-2Y) and associated recession fears were on the forefront of investors’ minds.
Market Outlook
As we move forward into 2022, significant uncertainty clouds the outlook for markets. In contrast to risk, which can be quantified by assigning probabilities to outcomes, uncertainty is essentially unmeasurable and represents the unknowable unknowns. In an uncertain environment, detailed forecasts are therefore not particularly accurate or helpful. Our outlook therefore discusses five high-level themes as we remain mindful of the wide range of possible scenarios and of the potential for abrupt regime changes in the economy and financial markets.
1. Risk of Stagflation
The global economy is currently confronted with a high probability of stagflation amidst global trends that are negative for growth and have a tendency to push up inflation further. These four main trends include: 1) higher energy and food prices, 2) disrupted supply chains and trade flows, 3) tighter financial conditions, and 4) lower business and consumer confidence due to heightened uncertainty. In combination, these could easily result in an economy that will be both too hot in terms of inflation and too cold in terms of growth.
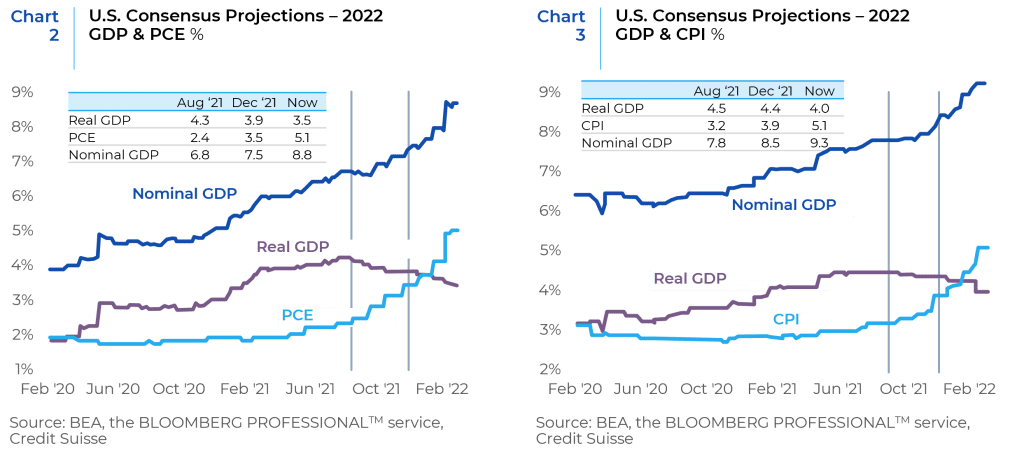
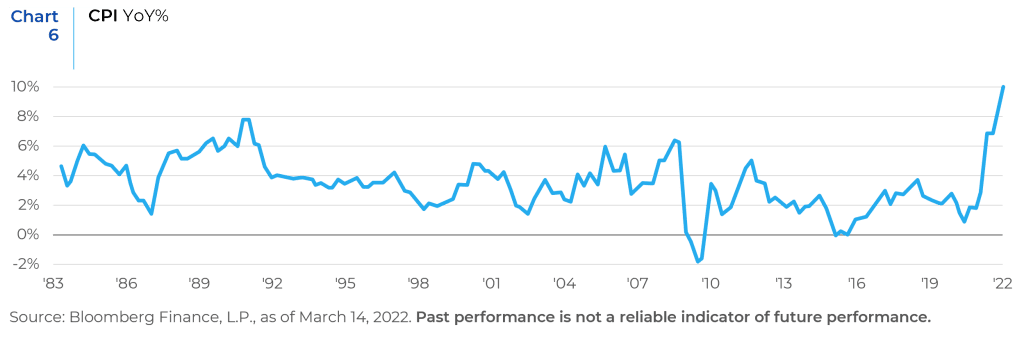
As shown in Charts 1-3, CPI has increased substantially since a year ago, primarily fueled by the increase in energy and goods prices. Amidst these signs of rising inflation, both US GDP and global GDP are expected to start slowing. The war in Ukraine has further exacerbated both of these trends by creating an additional supply side shock in food, fertilizer, and fuel.

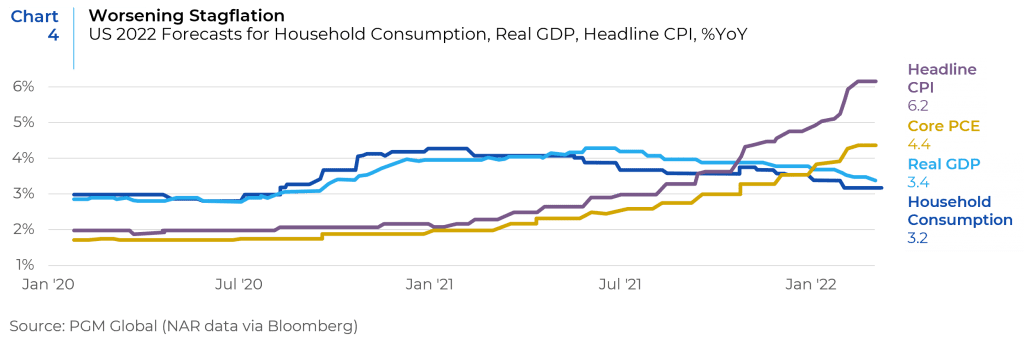
After the robust growth in 2020 and 2021, household consumption will face significant headwinds from elevated price pressures dampening real incomes, a hawkish Fed aimed at cooling demand, and a large fiscal drag. The stagflationary outlook has worsened with forecasts for household consumption falling from 3.7% YoY to 3.2% in the midst of rising inflation estimates (See Chart 4).
2. Increased Risk of Non-Linear Shocks
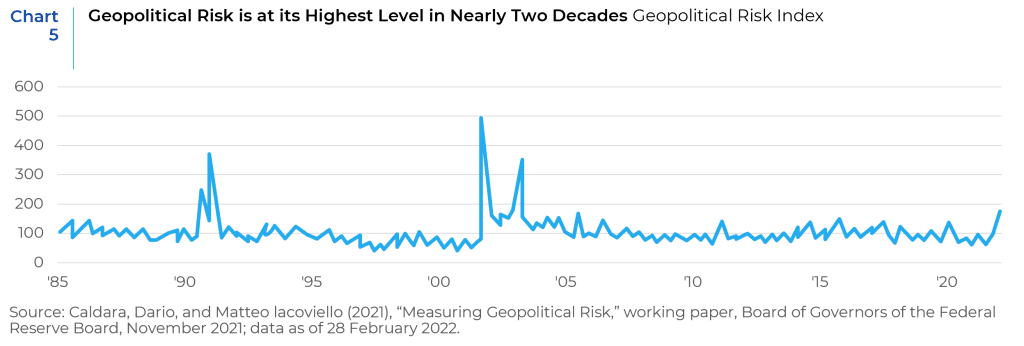
Heightened uncertainty in the outlook for both growth and inflation has been created by the potential for non-linear events related to the increased geopolitical risk that we see in the world today (see Chart 5). While supply chain disruptions were already widespread due to the pandemic, Russia’s war in Ukraine and the sanction responses have led to further disruptions. While Russia only accounts for 1.5% of global trade, it has a much larger footprint in a range of energy and non-energy commodities. Ukraine is a large producer of grain and an important supplier of parts for the auto industry and of inputs into chips production, such as neon. Ukraine and Russia account for more than 25% of the global trade in wheat, 20% of corn sales, and 80% of sunflower oil exports. Energy, agriculture, and metal prices have all seen increased price and return volatility following the invasion. Moreover, the recent COVID-related lockdowns in parts of China have the potential to create new bottlenecks in the global supply chain independent of the evolution of the Ukraine situation.
Current financial markets are on tenterhooks and very prone to reacting sharply in the short run to sudden non-linear events. If a resolution to the current crisis in Ukraine is found for some reason, markets can be expected to react sharply to this positive shock. Similarly, a sharp reaction on the negative side can be expected if there is further escalation in the conflict through channels like increased NATO involvement, a nuclear accident in one of the facilities in Ukraine etc. In the medium to long term, even if the war ends soon and commodity prices ease, the Russian sanctions may remain in place for an extended time, hampering the flow of trade and capital and exacerbating supply chain issues. In the near-term the upside pressure on prices created by the conflict, has increased the risk of a de-anchoring of medium- and longer-term inflation expectations and of a wage-price spiral. This is a higher risk in the U.S., where the labor market is already tight, but given the size of the inflation shock this risk is also significant for Europe. As seen in Chart 6, Consumer Price Index (CPI) prints in the U.S. that did not factor these supply constraints from sanctions and the war, were already at 40-year highs. Much now depends on the reaction by monetary and fiscal policymakers.
3. Shifting Sands for Factor Volatilities and Correlations
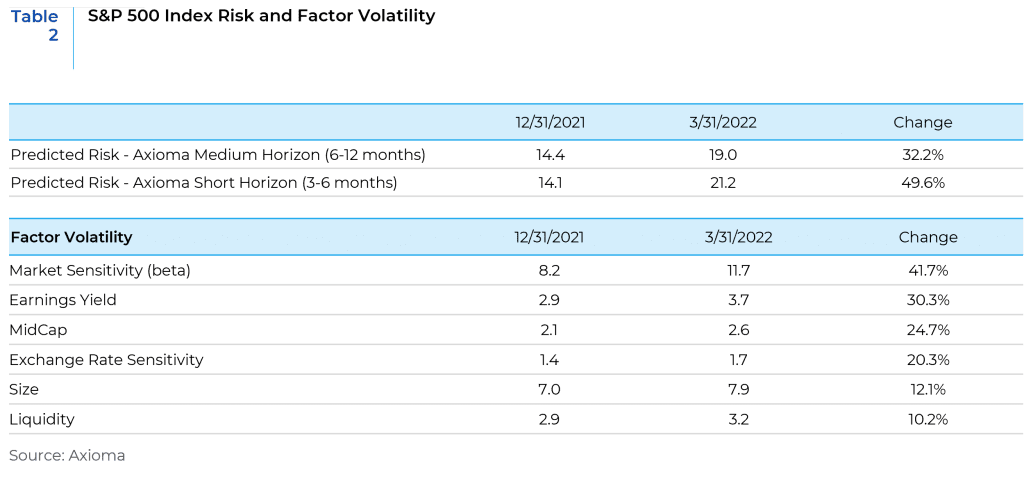
As the economy transitions to the last legs of an expansion amidst a war, factor volatilities have gone up significantly and factor correlations are evolving quickly. The heightened riskiness of equity markets can be found to be reflected in both the short horizon and medium horizon Axioma risk models as shown in Table 2. There was a spike in predicted risk after a post-pandemic low late in 2021 and most factor volatilities were higher at the end of the first quarter of 2022 when compared to the end of 2021. The Market Sensitivity(beta) factor recorded the biggest pick up in volatility and had the largest impact on forecasted equity market risk.
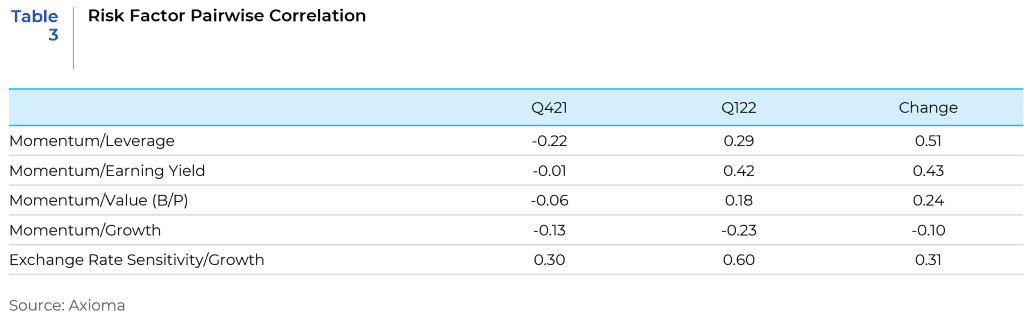
Similarly, factor correlations experienced significant changes over the course of the first quarter of this year. There was a significant shift in the correlation of Momentum with Value and Leverage (positive) factors versus Growth (negative). This highlights the outperformance of value versus growth during the quarter. The increase in correlation between the Exchange Rate Sensitivity and Growth factors is indicative of the higher exposures of many growth companies to revenue and income generated outside the U.S.
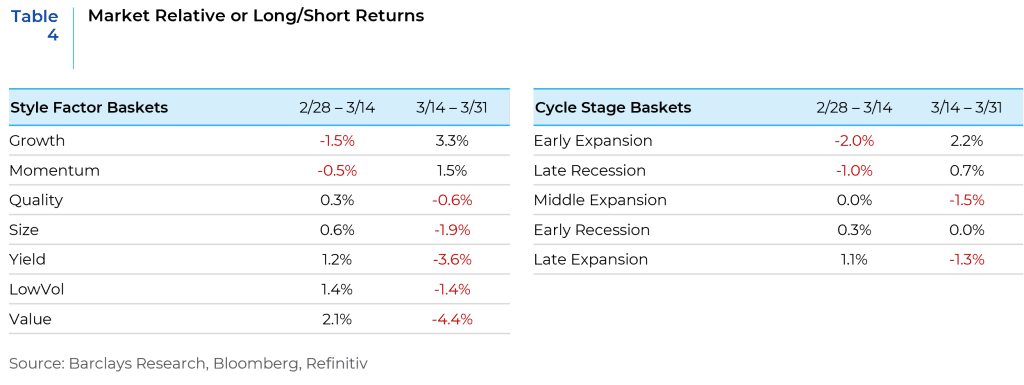
Factor performance has not only been volatile this quarter when compared to last year, the intra-quarter volatility has also been at high levels. There was a clear turning point on March 14th when factor performance did a complete 180, with the market rebound driving Growth/Momentum/Cyclical factors and sectors higher. (See Table 4)
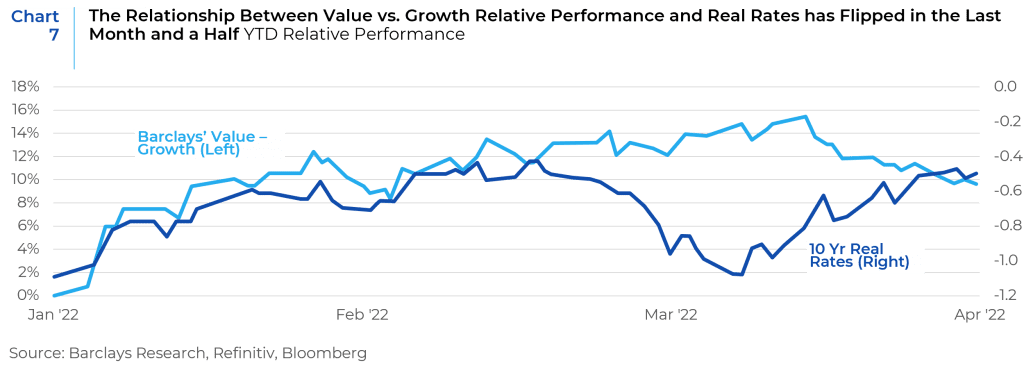
Interestingly enough the performance of Value versus Growth in recent weeks has been in opposition to the conventional wisdom of higher rates hurting the longer duration Growth factor. Chart 7 shows that through the middle of February Value vs. Growth relative performance tracked the 10Yr real rate closely, but since then the relationship has flipped. From a DCF valuation perspective, if growth expectations are driving the discount rate in the denominator higher, they could also drive the expected cash flows in the numerator higher, and the net effect can be ambiguous. The near-term relationship between real rates and Value versus Growth performance will be conditional on whether investors interpret higher rates as implying stronger economic growth. If rates are moving higher due to hawkish moves by the Fed solely, then Value should benefit, but if rates move higher due to improving economic expectations, then Growth should benefit. Investor interpretations will depend on the commentary from the Fed and the economic data that comes out as we move into the next quarter.
4. Diminishing Equity Returns as Earnings Estimates and Stock Buybacks Start Trending Down
Economic growth is showing signs of slowing after staging a V-shaped recovery post-pandemic. ISM numbers are slowing, and the yield curve is flattening, and it appears that we are entering the late expansion phase of the business cycle and downside risks to the growth outlook have increased since the beginning of the year.
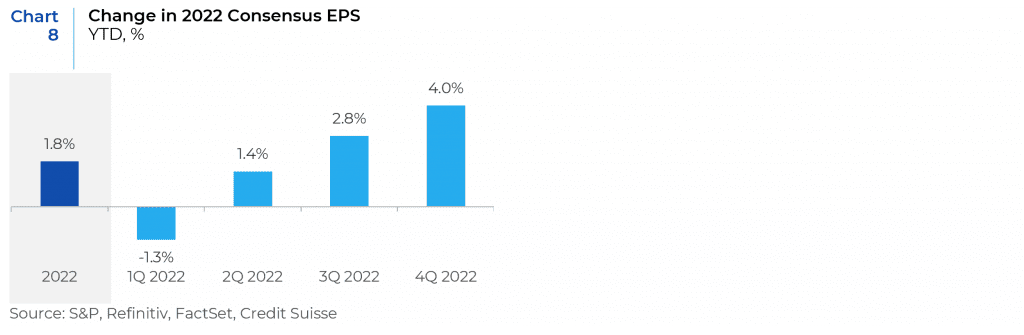
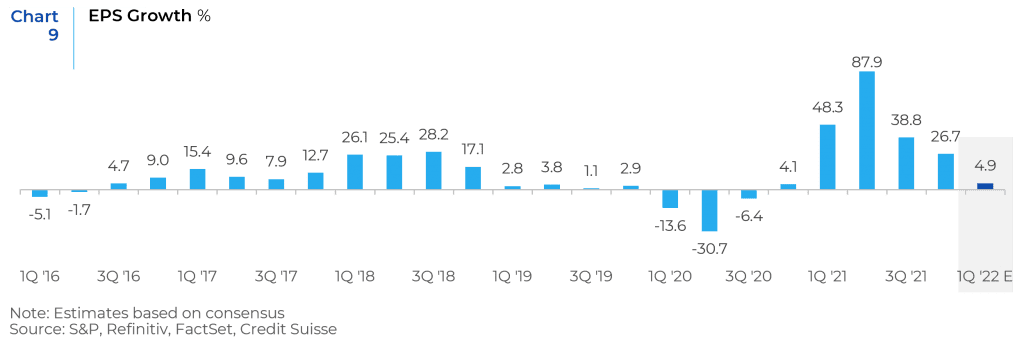
While near-term EPS estimates have been revised downwards and EPS growth is expected to slow, earnings estimates for the rest of 2022 still appear optimistic. As commodity prices have surged and financial conditions have tightened, the economic growth backdrop is less sanguine than at the start of the year. Earnings estimates will need to be downgraded to reflect these headwinds, which will ultimately weigh down on equity performance over the near-term.
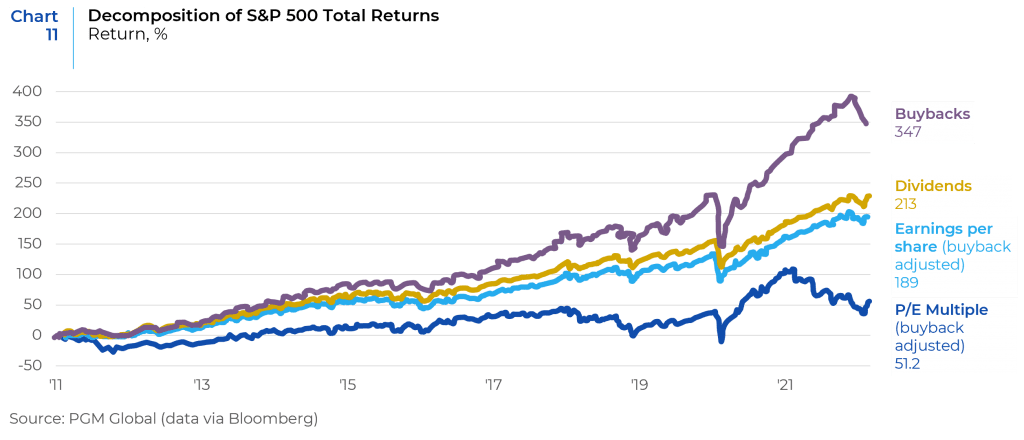
In addition, Chart 11 highlights that in the recent past, one of the main drivers of equity returns have been stock buybacks. Stock buybacks have been funded, in part, by borrowing at historically low levels. As the economic environment becomes more precarious, and interest rates move higher, companies may focus more on retaining profits and cash and reducing leverage. These factors will most likely slow down the rate of stock buybacks. This in turn will impact the EPS growth rate and have a dampening effect on equity returns.
5. The Possibility of Recession and Equity Market Performance
Economists surveyed by The Wall Street Journal in April on average put the probability of the economy being in recession sometime in the next 12 months at 28%, up from 18% in January and just 13% a year ago. Interestingly, the latest recession probability is slightly lower than the last expansion’s peak of 34.8% in September 2019. At the time, growth had slowed in response to Fed rate increases the prior year and a trade war between the U.S. and China. Whether a recession would have followed then, absent the pandemic, can’t be known. Economists’ recession probability reached the same level in August 2007, after which a recession did follow. But when it reached a similar level in August 2011, the economy kept growing.
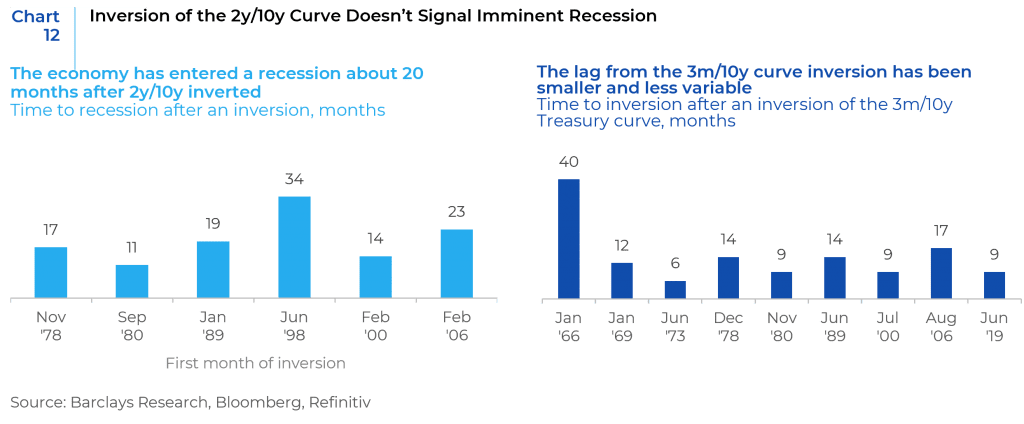
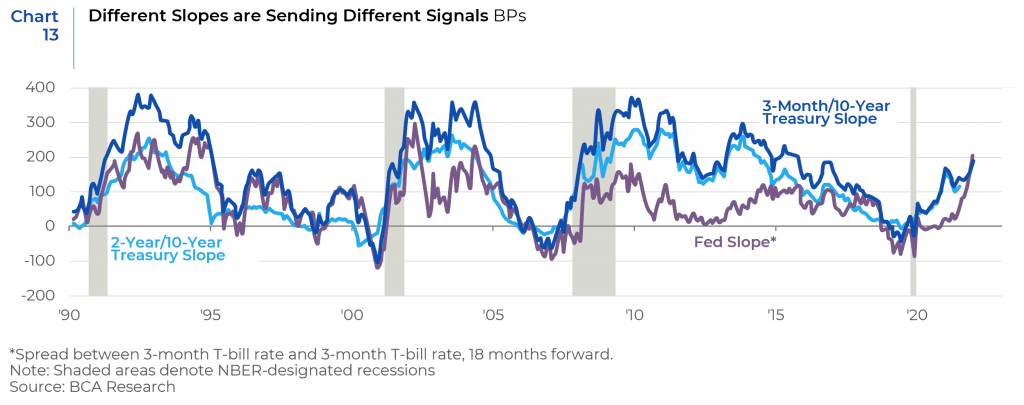
While it is hard to predict what path the economy will take this time, does this mean we should run for the bunker? The answer is based on timing. Despite the recent yield-curve inversions, the time period between inversion and recession often varies, can take months to develop, and can occasionally be triggered by events completely unrelated to market forces. While the 2y/10y recently inverted, the average lag from 2y/10y inversion to recession is 20 months. Some investors say that the 3m/10y inversion has been a better signal of an imminent recession because the Fed has historically become concerned only when 3m/10y persisted at deeply negative levels. While the 3m/10y is nowhere near inversion, it still takes several months for a recession to follow after it inverts.
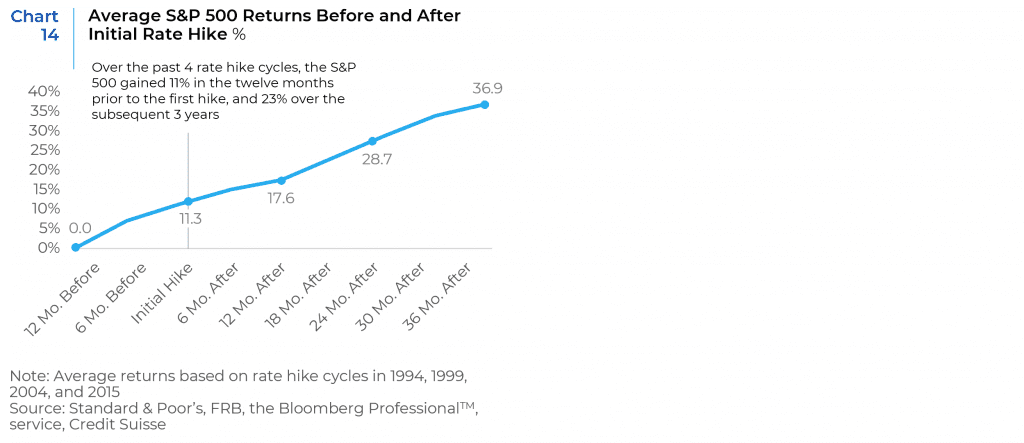
Rising inflation and resulting Fed action may not necessarily be bad for equity markets. As shown in Chart 14, in periods after the Fed starts hiking rates, equities actually tend to outperform. However, if inflation levels keep climbing or even remain at current levels over the medium and long term and the Fed had no choice but to keep raising rates to control that trend, the recessionary scenario increases in probability and that does not bode well for equity markets. Currently inflation is estimated to moderate and settle in the 3% to 4% range in the long-term.
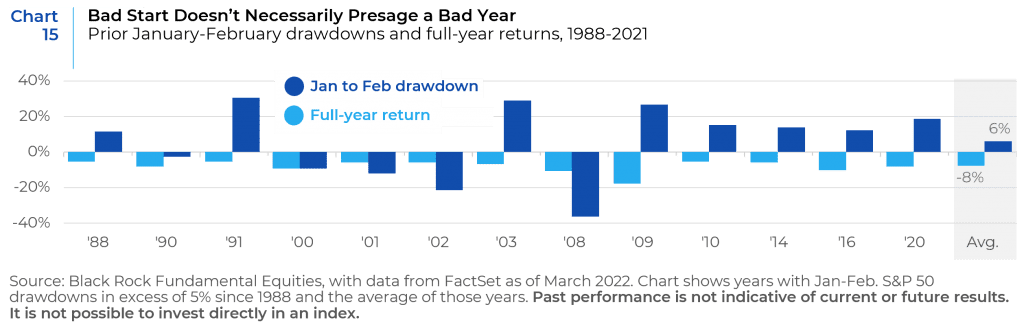
Historically, a difficult start hasn’t necessarily foretold an ugly outcome to the year. There are both short- and longer-term opportunities in the current scenario. In the near-term, indiscriminate selling may have created attractive entry points, particularly into some high-growth-potential stocks. At the same time, it is necessary to prepare for a longer-run regime shift as the once familiar slow-growth, low-rate environment transitions to a new world order.
Russia’s invasion of Ukraine, the sanctions response, and the gyrations in commodity markets cast an even thicker layer of uncertainty on what already was an uncertain economic and financial market outlook before the onset of this war. Fed tightening and the war in Ukraine have been the dominant macro forces. More recently, the inversion in the yield spread between 10-year and 2-year Treasuries has heightened recession risk. Trying to trade around these short-term swings has been difficult, and the best stance is a relatively neutral one. We believe factors such as strong free cash flow, low volatility, and rising earnings revisions will ultimately lead throughout this period of likely heightened volatility. The onset of a recession or major broadening out or worsening of the Ukraine conflict continue to pose downside risk to equities.
This report is neither an offer to sell nor a solicitation to invest in any product offered by Xponance® and should not be considered as investment advice. This report was prepared for clients and prospective clients of Xponance® and is intended to be used solely by such clients and prospects for educational and illustrative purposes. The information contained herein is proprietary to Xponance® and may not be duplicated or used for any purpose other than the educational purpose for which it has been provided. Any unauthorized use, duplication or disclosure of this report is strictly prohibited.
This report is based on information believed to be correct, but is subject to revision. Although the information provided herein has been obtained from sources which Xponance® believes to be reliable, Xponance® does not guarantee its accuracy, and such information may be incomplete or condensed. Additional information is available from Xponance® upon request. All performance and other projections are historical and do not guarantee future performance. No assurance can be given that any particular investment objective or strategy will be achieved at a given time and actual investment results may vary over any given time.