
The year started out on an uncertain note with protestors storming the United States Capitol, emergence of new virus mutations, the uneven distribution of COVID-19 vaccines, and unusual, highly targeted trading activity and stock price manipulation from retail investors involving several companies. This rattled markets in January and ultimately stocks closed the month mixed, with the Russell 2000 and the Nasdaq gaining, and the Dow and the S&P 500 falling. February and March saw markets recover as investor optimism was fueled by the passage of a fiscal stimulus package of $1.9 trillion and hopes of re-opening amidst an increasing pace in vaccinations. Value stocks leapt to the lead, growth stocks faded, energy stocks bested all other sectors, and technology stocks landed in the unusual position of being one of the worst performers. The first quarter also saw growth names hurt by rising yields as higher interest rates erode the value of the future profits of growth companies, compressing their stock valuations. Middle and small sized companies more likely to have their fortunes tied to the strength of the U.S. economy were among the best performers. Dividend-payers, which struggled in 2020, also saw a first-quarter recovery due to their concentration in the outperforming cyclical sectors.
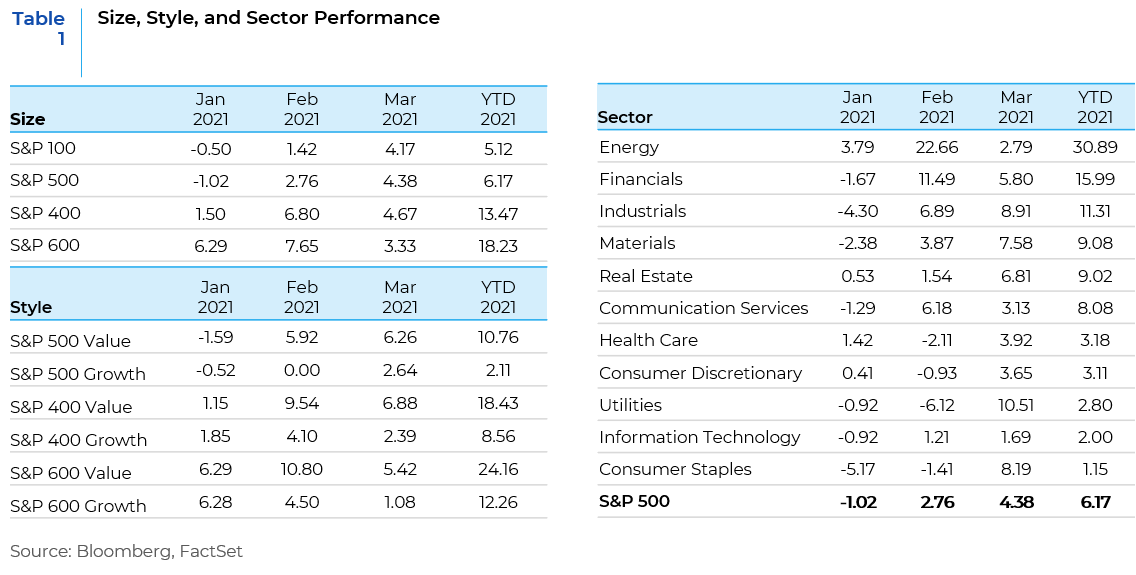
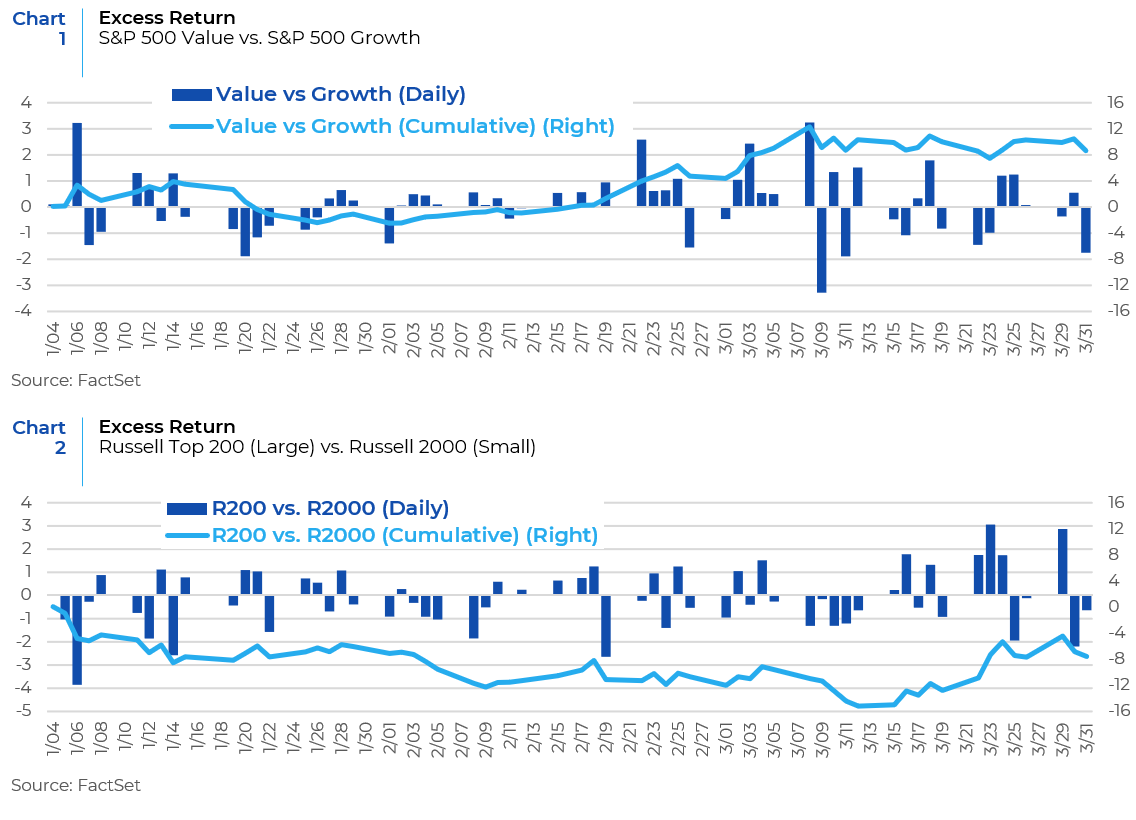
An underlying theme throughout the first quarter of the year are the alternating rotations that have been occurring under the surface in U.S. equity markets. While there has been a general dominance of small cap value companies, market leadership has been shifting back and forth between growth and value and between large cap stocks and small cap stocks, resulting in increased volatility. Charts 1 and 2 show the performance of style and size indices using daily data for the first quarter of 2021.
What is Looming on the Horizon?
As we head into spring and the second quarter of the year, the foundation has been laid for an economic boom propelled by rapid vaccine diffusion and increased fiscal stimulus. Expanded vaccinations will allow for a wider reopening of the economy and is expected to spark the strongest economic performance in nearly 40 years. GDP growth is expected to top 7% this year, consumer spending is expected to take off, and unemployment rates are anticipated to fall steeply. Investors also expect the Fed to maintain a dovish stance and not raise rates before mid-2023. Moreover, there is also wide anticipation that a version of Biden’s $2.3tn American Jobs Plan is likely to pass Congress later this year. Amidst this extremely optimistic environment, there are still a few risks that could potentially derail the equity market rally.
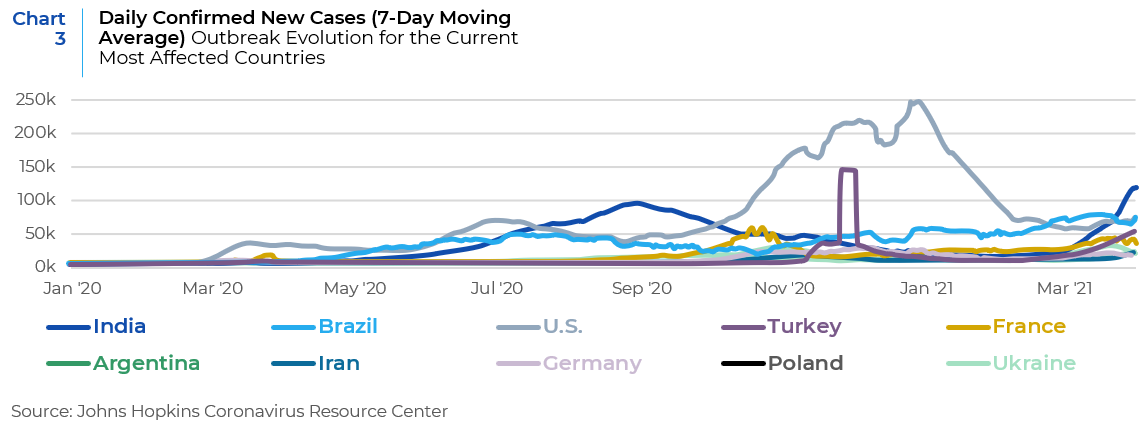
First, the near-term threat of the virus. Public officials in the United States are confronting a conundrum – the vaccine rollout is accelerating, but new coronavirus case rates are concurrently ticking higher. In addition, a surge in virus cases and deaths is hitting all regions of the world, driven by new virus variants and too many countries coming out of lockdown too soon (see Chart 3). The increasing infections, hospitalizations and deaths extend to countries where vaccinations are finally gaining momentum. That leaves even bleaker prospects for much of the world, where large-scale vaccination programs remain a more distant prospect. Most developing countries have little chance of reaching collective herd immunity this year and COVID outbreaks have worsened for many, with several forced to ratchet up lockdown measures. This will hurt near-term activity and create an economic drag on a global scale.
Second, the medium-term threat of higher tax rates as a result of new tax policies from the Biden administration could create a headwind for equity market performance s. Unlike the $1.9 trillion Covid-19 stimulus act, President Biden’s next initiative, the American Jobs Plan, won’t rely on government debt as a funding source. It is becoming increasingly clear that tax hikes will be a component of the next bill and will include a package of measures that if enacted, will result in an increase in both the corporate tax rate and the individual rate for high earners. This is the Made in America tax plan. For the Biden administration, the planned changes are an opportunity not just to fund key initiatives like infrastructure, climate, and expanded help for poorer Americans, but also to address inequities in the tax system itself.
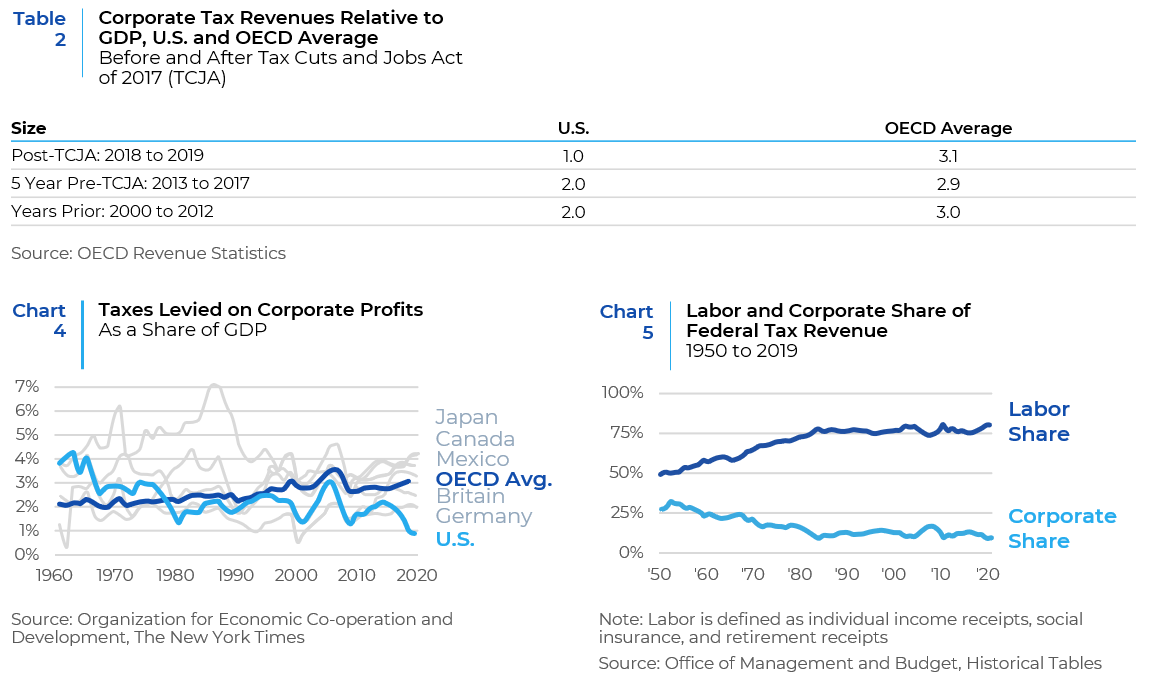
Compared to other OECD countries, the United States collects the lowest amount of taxes on corporate profits as a percent of national GDP. The Tax Cuts and Jobs Act of 2017 enacted by the Trump administration made the picture worse (see Table 2). In addition, the labor share of national income has been declining for years – a trend that has contributed to rising income inequality. The share of federal revenue raised by the corporate tax has fallen steadily and is now under 10 percent, while the share of revenue raised by taxing labor has been growing for decades and now exceeds 80 percent (see Charts 4 and 5).
The Made in America tax plan implements a series of corporate tax reforms to address profit shifting and offshoring incentives and to level the playing field between domestic and foreign corporations. These include: 1. Raising the corporate income tax rate to 28 percent; 2. Strengthening the global minimum tax for U.S. multinational corporations (the so-called global intangible low-taxed income or GILTI); 3. Reducing incentives for foreign jurisdictions to maintain ultra-low corporate tax rates by encouraging global adoption of robust minimum taxes; 4. Enacting a 15 percent minimum tax on book income of large companies that report high profits, but have little taxable income; 5. Replacing flawed incentives that reward excess profits from intangible assets with more generous incentives for new research and development; 6. Replacing fossil fuel subsidies with incentives for clean energy production; and 7. Ramping up enforcement to address corporate tax avoidance. As for timing, if passed, tax measures would likely take effect in 2022.
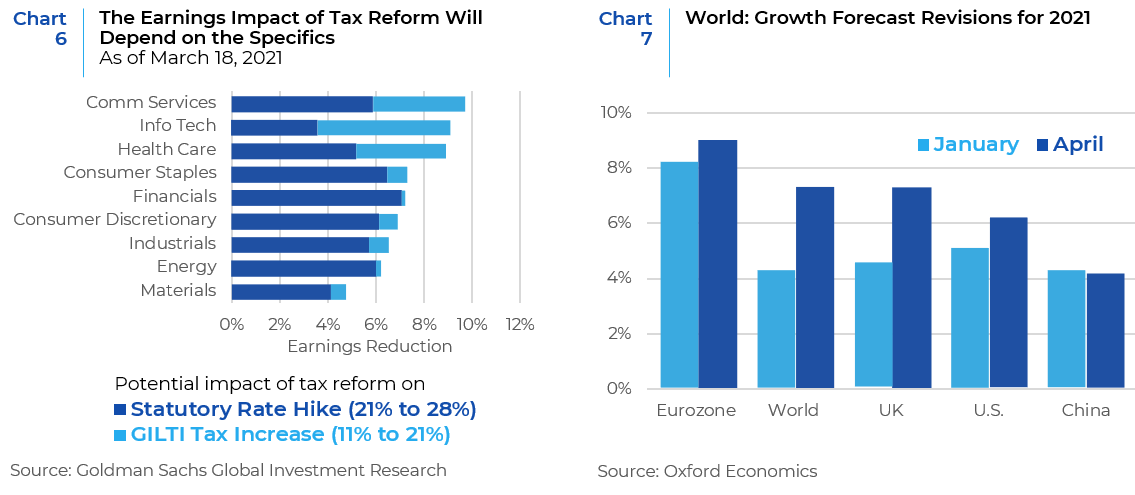
What would be the impact of these tax changes on equity markets? According to various estimates from analysts, a 28% tax rate would clip corporate earnings by 7% to 9% in 2022. Some anticipate that eventually the hike in the corporate tax rate would end up being less, around 25%. In that scenario there would be a 3% to 4% drag on corporate earnings. However, investors should also bear in mind that some of the tax increases would be used to pay for infrastructure spending, which in turn would boost economic growth and offset some of the drag. A breakdown of the potential earnings impact underlines the bigger threat posed to more growth-oriented sectors. Potentially the communications services and technology sectors face the biggest hit to earnings from increases in the corporate tax rate and the tax on foreign income, while the more cyclically oriented industrials, energy and materials sectors will be impacted the least (see Chart 6).
Third, the combination of loose monetary and fiscal policies and economic reopening is raising inflation concerns. This is seen in rising oil prices as well as market measures of inflation expectations and of the risk of high inflation outcomes. With global real GDP growth expected to exceed 5% in 2021 and massive fiscal stimulus programs underway, especially in the US, inflation expectations are increasing against an unusual set of market and economic conditions (see Chart 7).
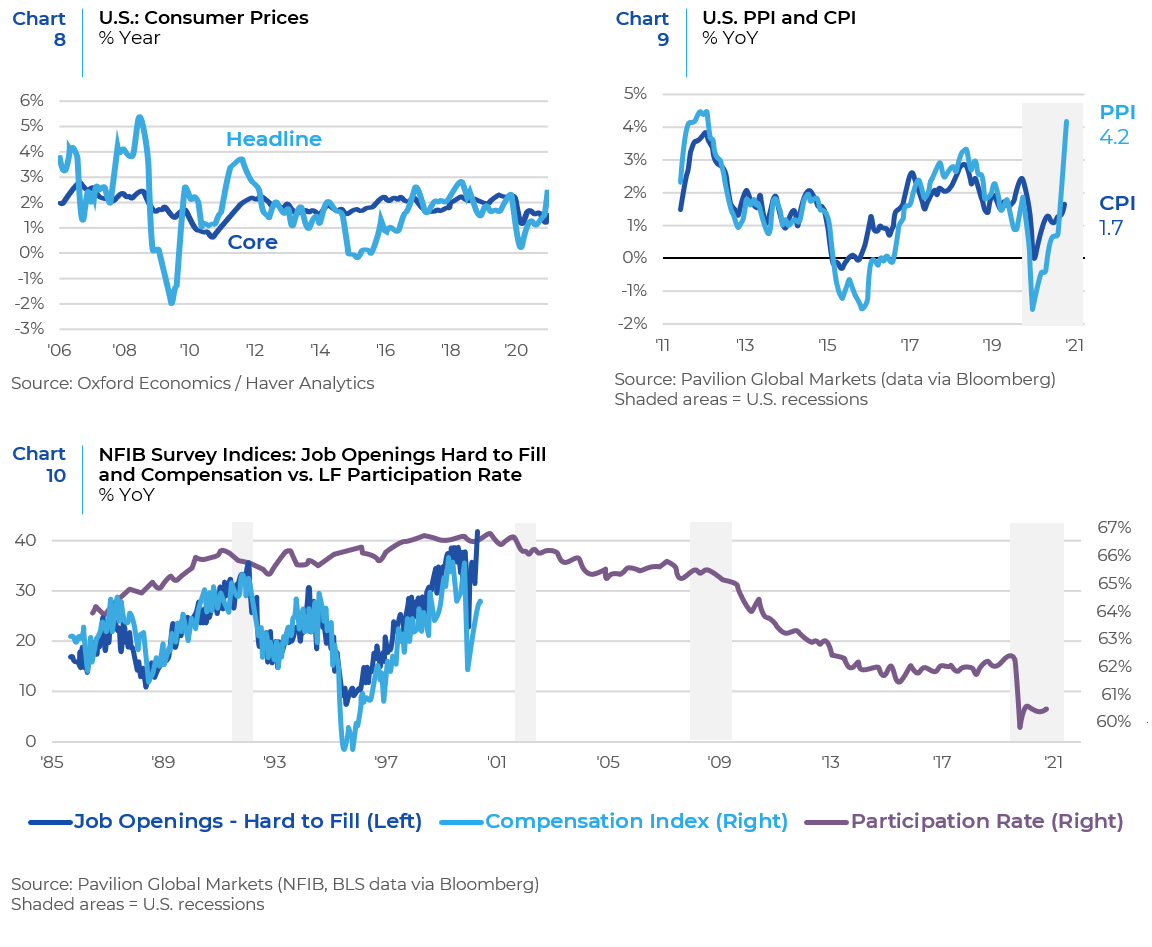
Surging commodity prices, supply shortages, the resilience of wage growth, survey-based evidence of strong price pressures, and the massive fiscal stimulus coming down the pipeline all point to inflation levels getting elevated. Headline consumer prices have advanced the most since August 2021 fueled by a sharp rise in gasoline prices (see Chart 8). Inflationary pressures are also being felt across supply chains. We are seeing evidence of cost push inflation in the PPI numbers as shown below. Rising cost push inflation can erode the operating margins of companies (see Chart 9). Businesses have also started to report labor shortages and rising compensation pressures despite a labor force participation rate that is below pre-COVID levels. These wage pressures are another sign of inflation (see Chart 10).
Too much inflation can spell trouble for equities if it results in tighter real monetary policy or slower growth. But while we expect inflation to pick up in the US, we do not expect either of those outcomes anytime soon. That is a key reason why we expect the stock market to stay strong through the rest of the 2021. However, the story may change in mid to late 2022 and despite its promise, the Fed may have to intervene before 2023 makes its way.
Source: Oxford Economics, BCA Research, Bloomberg, FactSet, New York Times, Barron’s. U.S. Department of Treasury, Pavilion Global Markets
This report is neither an offer to sell nor a solicitation to invest in any product offered by Xponance® and should not be considered as investment advice. This report was prepared for clients and prospective clients of Xponance® and is intended to be used solely by such clients and prospects for educational and illustrative purposes. The information contained herein is proprietary to Xponance® and may not be duplicated or used for any purpose other than the educational purpose for which it has been provided. Any unauthorized use, duplication or disclosure of this report is strictly prohibited.
This report is based on information believed to be correct, but is subject to revision. Although the information provided herein has been obtained from sources which Xponance® believes to be reliable, Xponance® does not guarantee its accuracy, and such information may be incomplete or condensed. Additional information is available from Xponance® upon request. All performance and other projections are historical and do not guarantee future performance. No assurance can be given that any particular investment objective or strategy will be achieved at a given time and actual investment results may vary over any given time.