
Spreads Say ‘Go’—The Economy Says ‘No’
As we enter the home stretch of 2025, we are struck by the current state of valuations in the fixed income markets. To be sure, total returns in fixed income have been strongly positive year-to-date, despite mounting economic headwinds. We’re frequently asked why fixed income spreads remain so tight in this environment. From a pure valuation perspective, we offer the following explanation.
Fixed income valuation encompasses more than just risk premia—it also involves all-in yields, the term structure of credit spreads, and relative valuation across sectors and rating levels. The tightness of spreads, in our view, reflects a broader disconnect among financial market indices (both fixed income and equity) that are not necessarily representative of the underlying economy.
We are particularly struck by the divergence between broad market valuations and the growing weakness in various economic sectors. To explore this further, our analysis in this research note adopts a two-pronged approach. First, we compared the composition of the ICE BofA Corporate index with the actual drivers of economic activity. Second, we analyzed the ICE BofA Asset-Backed Securities (ABS) Index at the constituent level to uncover insights into underlying sentiment and the directionality of spreads, especially in light of consumer credit deterioration. Finally, we share our perspective on what may unfold through the remainder of 2025 and our outlook for portfolio positioning as we approach year-end.
The highlights of our analysis are:
- Corporate bonds are not particularly reflective of the broader economy due to the large-cap nature of the companies in this segment of the market.
- Although consumer and small business credit fundamentals are showing considerable signs of distress, the broader data landscape does not suggest a dire economic scenario.
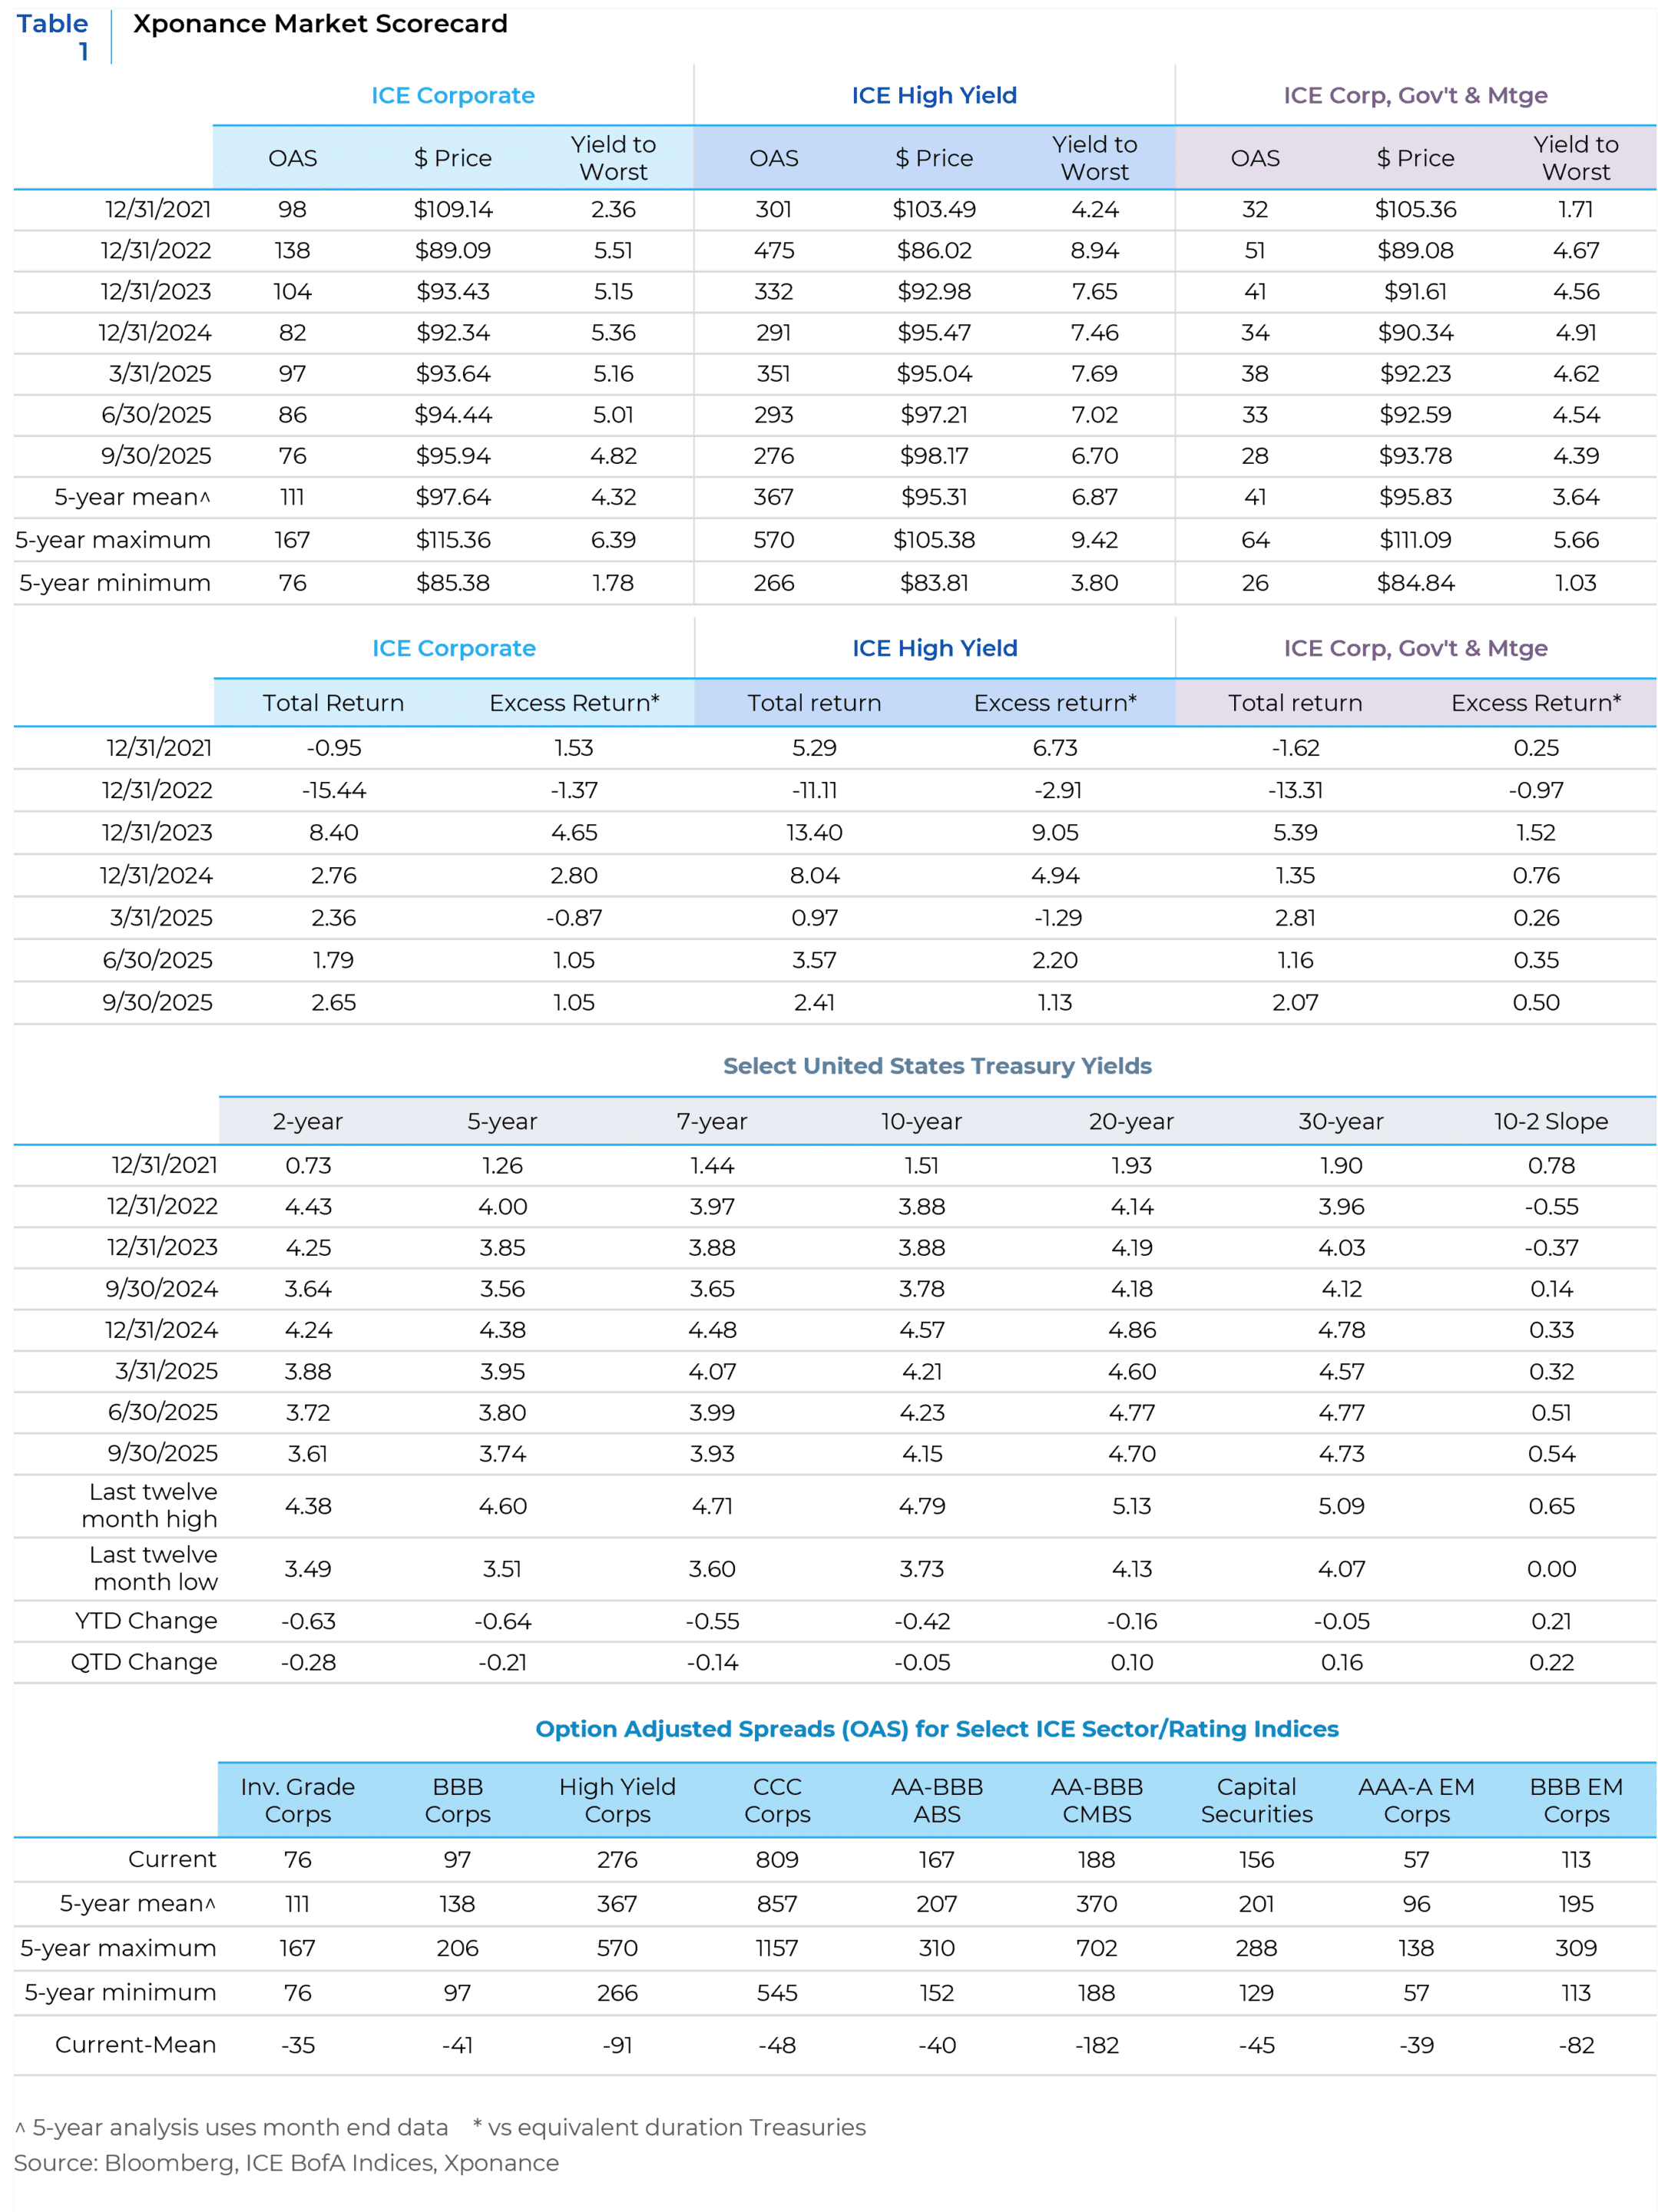
- From a valuation standpoint, broad market indices continue to offer yields above 4%, with investment-grade corporate bonds yielding around 4.75%.
- As the Federal Reserve Open Market Committee (FOMC) continues to lower the Fed Funds rate through the remainder of 2025 and into 2026, the Treasury curve is likely to steepen.
- While long-end yields remain historically attractive, it’s important to note that long-end corporate spreads tend to underperform other market segments during recessionary periods as Treasury yields fall.
- Intermediate and long-term rates appear reasonably well anchored near current levels, even as short-term rates decline.
- Credit curves remain historically flat, sitting in the bottom quintile of historical observations and presenting unattractive valuations.
- We continue to position the portfolio in the belly of the curve—a stance we’ve consistently advocated throughout 2025.
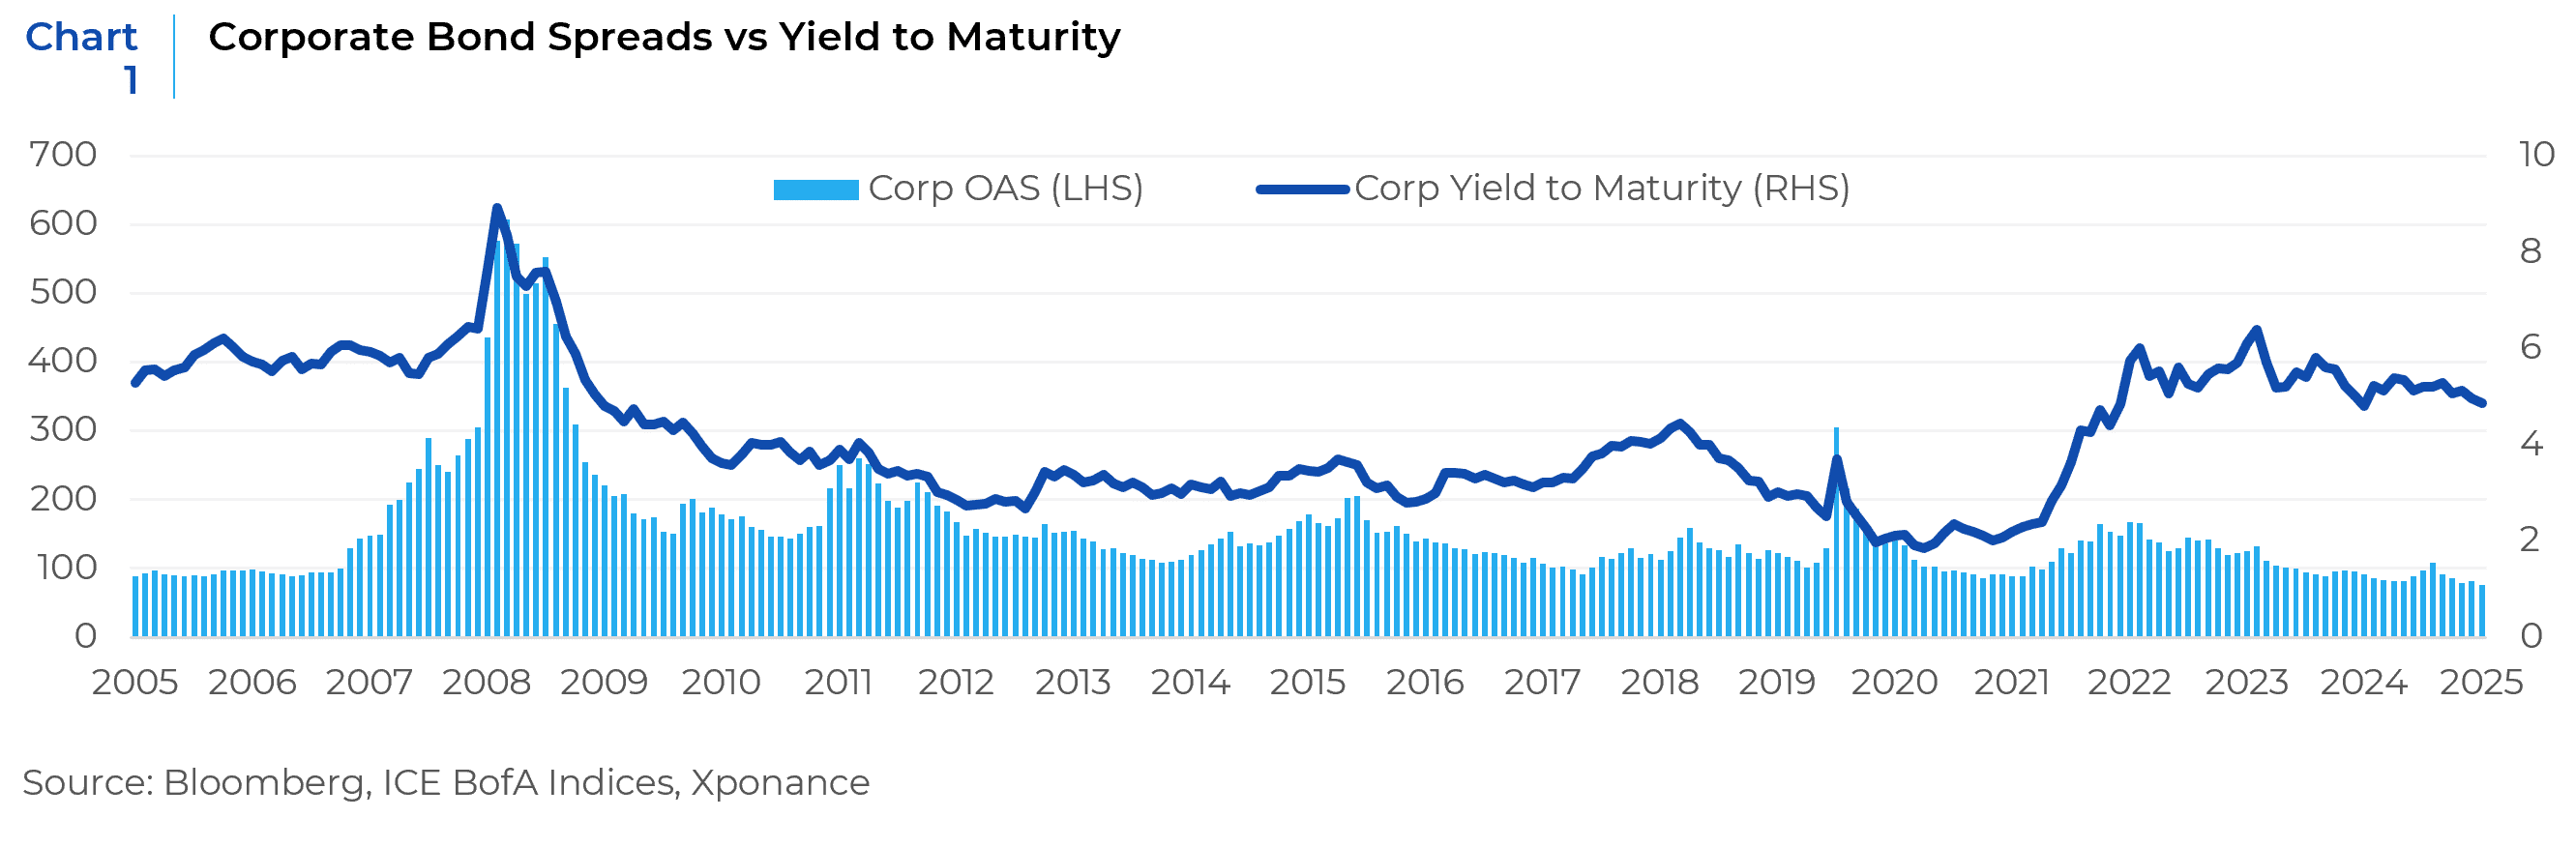
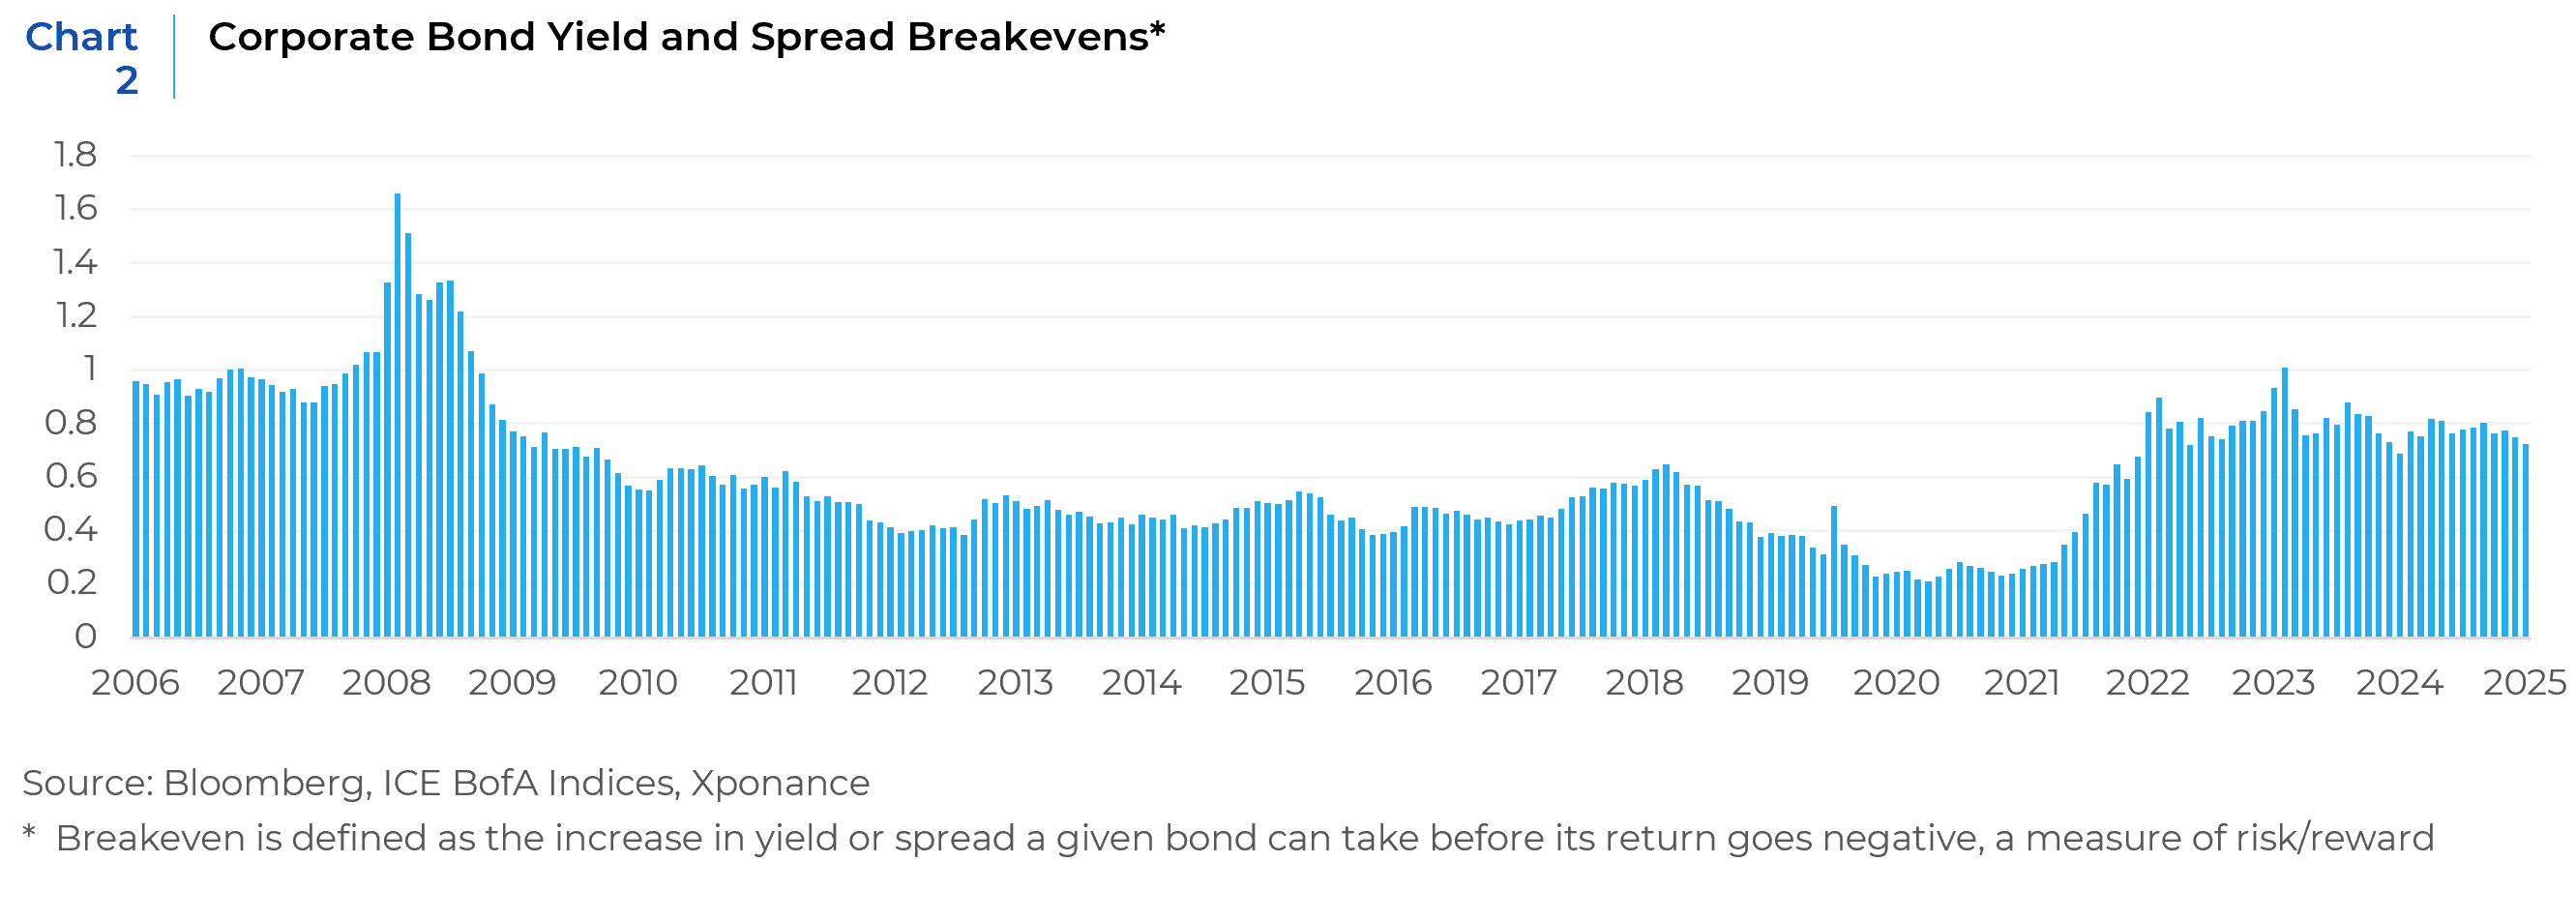
When we assess valuation in the fixed income markets, we consider a broad range of indicators—many of which have appeared in these pages and will be familiar to regular readers. On the negative side of the valuation ledger are absolute spreads, the shape of spread maturity curves, and relative valuation across ratings cohorts. Depending on the time period used, spread breakevens may also register as a negative.
However, absolute yields present compelling value relative to the past decade. When paired with spread breakevens, they offer an attractive risk/reward profile. Additionally, the persistent belief in the “Fed Put” and the historical success of “buying the dip” in a mean-reverting asset class—especially given that spread-widening episodes over the past ten years have typically lasted less than three months—have conditioned investors to anticipate outperformance across most market environments.
 When examining the corporate index and sector valuations in the context of the broader economy, we continue to observe minimal differentiation among subsectors within the benchmark—even as certain market segments face heightened economic pressure. To capture a snapshot of these valuations, we compared the Level 4 Subsectors of the Corporate Index (the most granular level, comprising 67 subsectors) as of 4/30/25—the widest month-end reading of the year for overall corporate spreads—with those as of 9/30/25. In this analysis, some defensive sectors have weakened, while several highly cyclical sectors have strengthened. For instance, beverage spreads have deteriorated relative to the index OAS, whereas department store spreads have markedly improved. This reflects classic yield-chasing behavior and presents an opportunity to de-risk while preserving yield, now that much of the value has been extracted from current spread levels.
This lack of dispersion can be attributed to the valuation metrics discussed above, as well as the nature of the companies whose debt qualifies for inclusion in the index. These issuers are typically not the ones that encounter distress early in a downturn; rather, they tend to show signs of strain only after the economy has already, in hindsight, begun to contract.
Corporate bonds are not particularly reflective of the broader economy due to the large-cap nature of the companies underlying this segment of the market. In contrast, small businesses drive a significantly greater share of U.S. economic activity than their large and mega-cap counterparts. According to data from the Small Business Administration, small businesses account for 43.5% of GDP, employ 45.9% of American workers, pay 39% of all private-sector payroll, and receive 26.5% of federal contracting dollars.
By comparison, financial data from companies in the Russell 1000 equity index indicate that these firms employ roughly 21% of American workers and generate approximately $4.4 trillion in revenue—equivalent to just 15% of U.S. nominal GDP. Unlike large-cap companies, small businesses lack direct access to capital markets and face limited lending opportunities from major banks. In fact, FDIC data show that the top 100 banks in the United States hold nearly all banking assets nationwide. Most small business lending is relationship-based and originates from community banks, virtually none of which are among the top 100.
We posit that corporate and economic distress typically begins at the consumer and small business level and only becomes visible in credit spreads once a broader event prompts investors to take notice.
To better understand current business dynamics, we moved beyond anecdotal evidence—such as news stories—and examined small business data directly. While defaults among large-cap bond issuers remain relatively muted by historical standards, the nature of those defaults has shifted, with distressed exchanges now comprising a larger share of the total. A distressed exchange is a restructuring strategy where a company that is in financial distress offers new debt or equity securities to its existing creditors in exchange for their current debt. This “out-of-court” negotiation is used to avoid bankruptcy while still reducing overall leverage, extending debt maturities, and easing debt service burdens, though often requiring creditors to take a financial loss. This form of restructuring is not typically available to smaller companies.
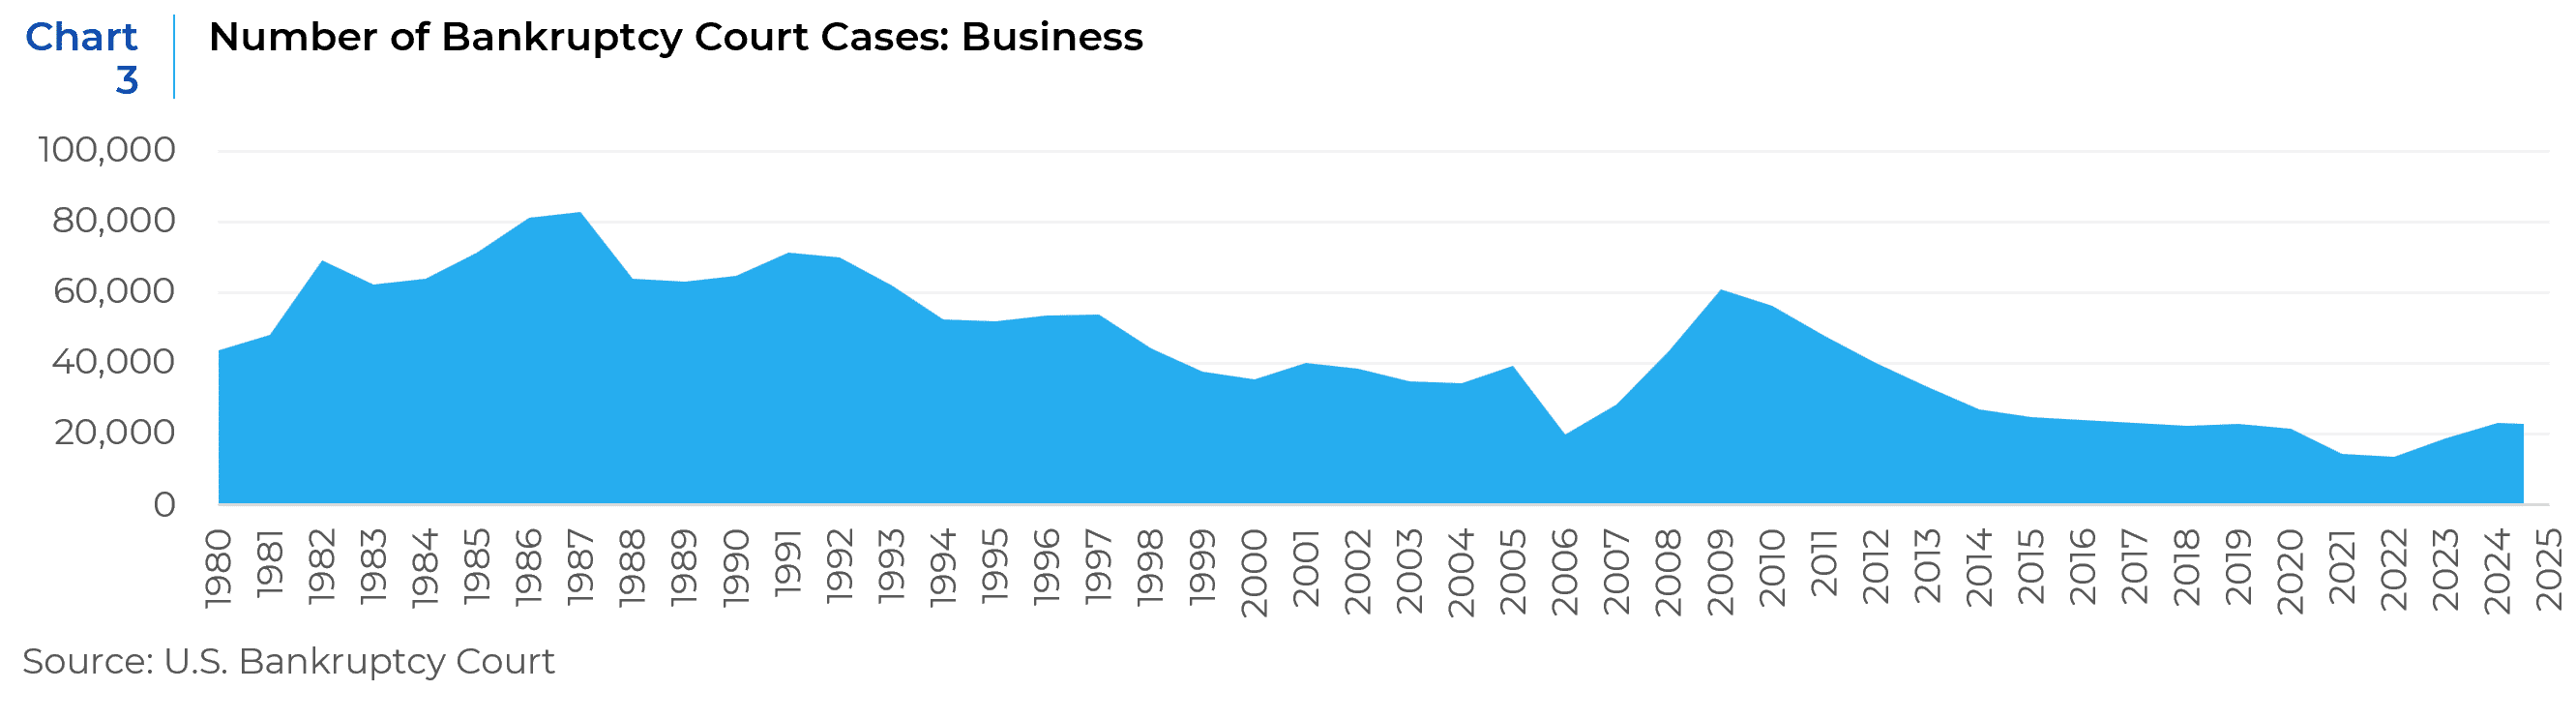
Meanwhile, overall business bankruptcies continue to rise in real time. According to S&P Global, 694 companies filed for bankruptcy in 2024—the highest annual total since 2010. The trend has persisted in 2025, with 371 corporate bankruptcies recorded in the first half of the year, also the highest first-half figure since 2010. Notably, this includes a record 17 bankruptcies involving companies with assets exceeding $1 billion.
Beyond corporate-level filings, broader business bankruptcies have also climbed. Data from the U.S. Bankruptcy Court system show 23,043 filings in the first half of 2025, nearly matching the full-year total of 23,107 in 2024. While these levels are not yet alarming (see chart below), the upward trajectory may serve as a canary in the coal mine, especially as pandemic-era stimulus programs have fully wound down and stress among regional banks has intensified.
Similarly, data from the National Federation of Independent Business (NFIB)—a key source for small business sentiment—reflect marginal weakening. Though not signaling crisis, indicators such as poor sales, declining optimism, and rising uncertainty suggest growing pressure beneath the surface.
 To better understand bottom-up trends in consumer credit quality, we examined Federal Reserve banking data on consumer delinquencies and their potential impact on asset securitization markets. Several consumer lending categories are now experiencing delinquency rates comparable only to those seen during the Global Financial Crisis (GFC). Despite this deterioration, spreads in the Asset-Backed Securities (ABS) market have remained relatively stable, though dispersion is evident across its underlying sub-sectors.
As economic weakness begins to permeate financial markets, the more esoteric segments of ABS tend to react first within institutional fixed income. By its very nature (pools of installment loans to individuals, like auto loan or credit card payments), ABS provides valuable insight into the health of the U.S. consumer, even though it is primarily an institutional product. So far, top-level option-adjusted spreads (OAS) have remained well-behaved, despite the decline in consumer credit quality.
Our review of Federal Reserve consumer asset-quality data—specifically the combined charge-off and delinquency rates for all consumer loans—reveals that while conditions have improved from recent peaks, they remain significantly elevated. Notably, certain components of the dataset, such as auto loans, continue to deteriorate.

However, as consumer distress—particularly among lower-income borrowers—begins to surface, the underlying performance of these issuers is deteriorating. This, coupled with concerns over underwriting quality, appears to be prompting investors to adopt a more cautious stance toward these securities. While it remains too early to determine whether this is a temporary anomaly or the beginning of a broader trend, the asset-quality chart above warrants close attention.
While we highlight concerns around consumer and small business credit fundamentals, we also note that the broader data landscape does not suggest a dire economic scenario. For instance, the Conference Board’s Index of Leading Economic Indicators remains negative but has improved from its recent lows. Similarly, the Chicago Fed’s National Activity Index is slightly negative, yet it tends to hover near zero except during periods of pronounced economic distress.
From a valuation standpoint, broad market indices continue to offer yields above 4%, with investment-grade corporate bonds yielding around 4.75%. Even as the Federal Reserve Open Market Committee (FOMC) is expected to lower the Fed Funds rate through the remainder of 2025 and into 2026, the Treasury curve is likely to steepen. Intermediate and long-term rates appear reasonably well anchored near current levels, even as short-term rates decline.
Credit curves, however, remain historically flat, sitting in the bottom quintile of historical observations and presenting unattractive valuations from a z-score perspective. This has led us to maintain portfolio positioning in the belly of the curve—a stance we’ve consistently advocated throughout 2025. While long-end yields remain historically attractive, it’s important to note that long-end corporate spreads tend to underperform other market segments during recessionary periods as Treasury yields fall.
Across fixed income asset classes, attractive spread valuations are increasingly difficult to find. Agency MBS, for example, appeared relatively cheap earlier in the year but has since tightened due to renewed demand and limited issuance. Callable agencies have recently offered better value, though they primarily serve as tools for marginally enhancing high-quality yield.
We continue to manage portfolio risk at the lower end of our tolerance range, leveraging sector and security-level valuation metrics to preserve yield while mitigating potential spread widening. This approach includes selective corporate sub-sector exposure, reduced allocations to private-label securitized paper, and strategic curve positioning.
Recent high-profile bankruptcies—such as First Brands (an auto parts supplier to DIY consumers) and Tricolor (a subprime auto dealer and lender)—along with significant loan write-downs at Zions Bancorp and Western Alliance Bancorp, have heightened investor caution. Clearly, risks in both corporate and securitization markets are asymmetric and skewed to the downside. While such conditions may present opportunities, it appears that the prolonged period of yield chasing has led to excesses in risk-taking. Markets may remain complacent through year-end, but we see a risk that investor appetite could wane once the calendar turns, potentially ushering in a more balanced risk environment.
This report is neither an offer to sell nor a solicitation to invest in any product offered by Xponance® and should not be considered as investment advice. This report was prepared for clients and prospective clients of Xponance® and is intended to be used solely by such clients and prospective clients for educational and illustrative purposes. The information contained herein is proprietary to Xponance® and may not be duplicated or used for any purpose other than the educational purpose for which it has been provided. Any unauthorized use, duplication or disclosure of this report is strictly prohibited.
This report is based on information believed to be correct but is subject to revision. Although the information provided herein has been obtained from sources which Xponance® believes to be reliable, Xponance® does not guarantee its accuracy, and such information may be incomplete or condensed. Additional information is available from Xponance® upon request. All performance and other projections are historical and do not guarantee future performance. No assurance can be given that any particular investment objective or strategy will be achieved at a given time and actual investment results may vary over any given time.