
The bellwether index for U.S. equity markets, the S&P 500, has seen a steady increase in stock and sector concentrations since 2017. This has created implications regarding the drivers of market performance and even more importantly, the portfolio construction required to stay ahead of the S&P 500. The narrowing breadth of the market both in terms of weights and returns has resulted in unprecedented skewness in size and style. Active management, a hard game to win since the Great Financial Crisis, has become even harder now. Well diversified core strategies have been especially challenged in this environment.
Concentration of Names, Industries, and Sectors
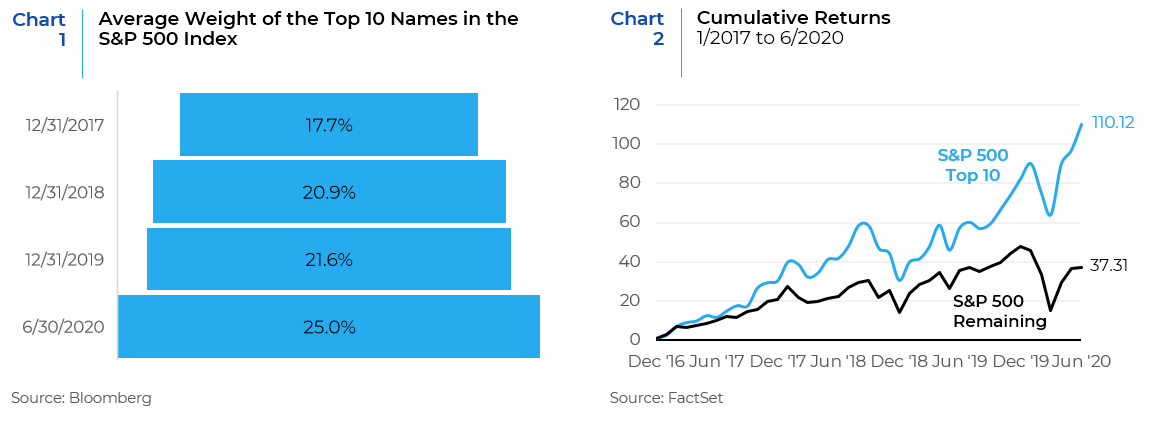
Since 2017 the S&P 500 has been gradually increasing its concentration in the highest weighted names in the index. The return disparity between the 10 largest stocks and the remaining names in the index has also grown with time. Leading into the coronavirus pandemic, equity markets had been propped up by a handful of mega-cap growth names – Microsoft, Apple, Amazon, Alphabet (Google), and Facebook. These five companies in the S&P 500 Index have accounted for over 20% of its total market capitalization since 2018, exceeding the 18% concentration level reached during the dot-com bubble. Charts 1 and 2 show the increasing weight of the top 10 names in the S&P 500 index and their corresponding dominant role in contributing to the returns of the index.
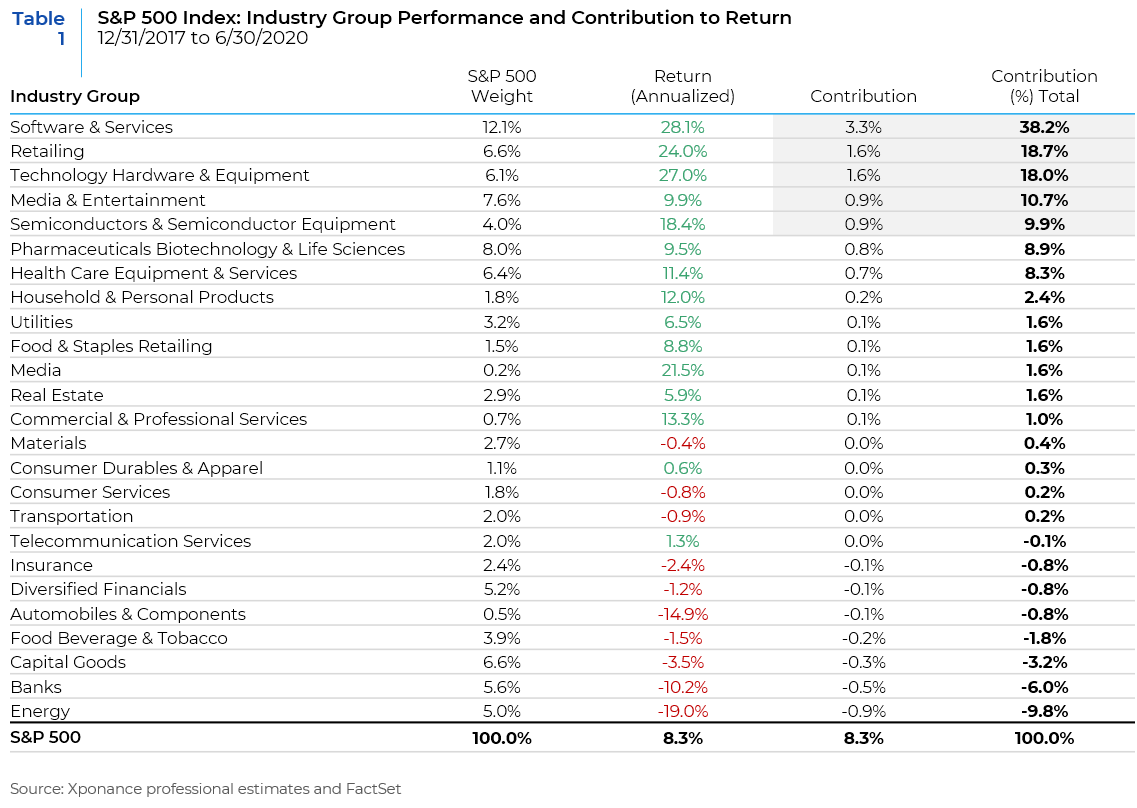
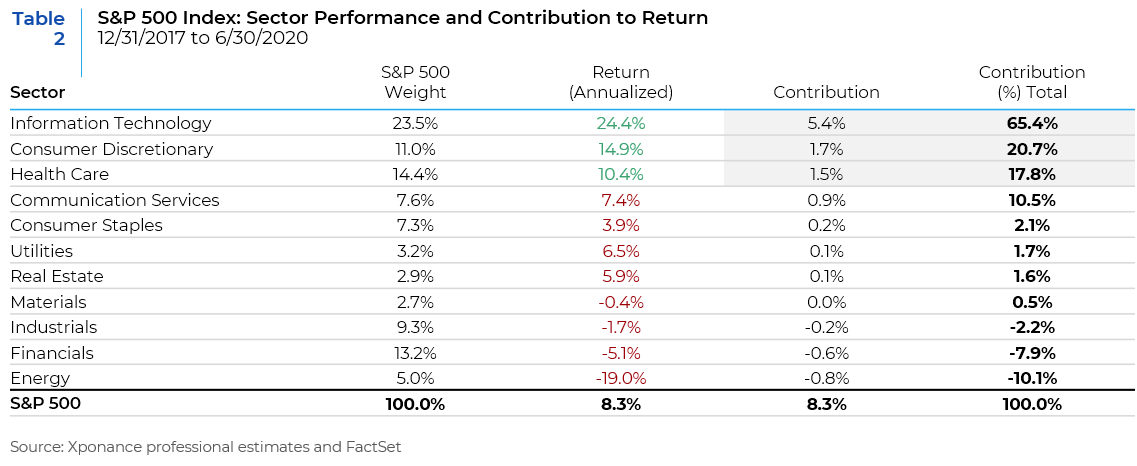
The same phenomenon that we see at the stock level can be observed at the industry group and sector levels. Tables 1 and 2 show the concentration of returns within the S&P 500 through the industry group and sector lenses. Almost all of the S&P 500’s return was derived from 5 industry groups, most of which have the biggest 10 names as constituents. Similarly, almost all of the S&P 500’s return was derived from 4 sectors and over 85% of the returns came from two sectors – Information Technology and Consumer Discretionary. Of course, these returns have been further exacerbated by the trends that have dominated in the COVID-19 crisis period – work from home, increased use of home entertainment and social media, online shopping, and the search for vaccines and cures for coronavirus infections.
The implication of this trend for portfolio construction provides an interesting perspective. Continuing the theme of comparing the 10 largest names to the remaining companies in the index, Table 3 provides a summary of active risk predictions along with the risk factor exposures of the two portfolios for the past several years. The post COVID-19 increase in equity market and risk factor volatility has resulted in a sharp rise in the predicted tracking error of both portfolios since year-end 2019. At 06/30/20, a portfolio in the top 10 names had a tracking error of 14.5% vs. the S&P 500, well beyond the typical investment guidelines for diversified active managers.
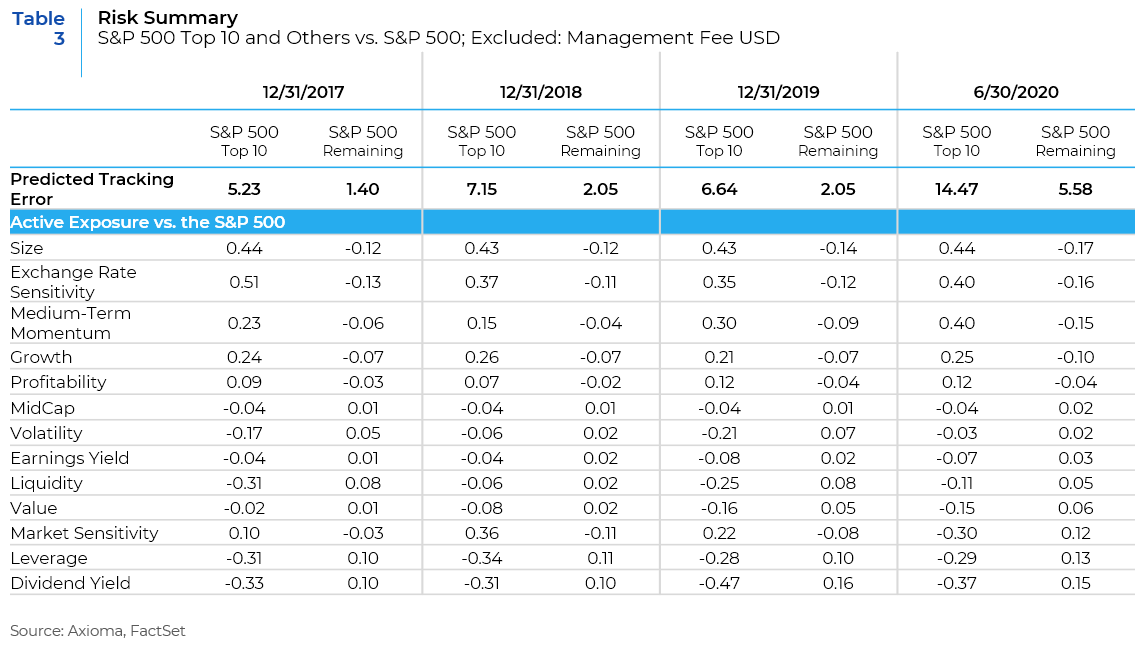
The table also highlights the inherent factor biases of the top 10 companies versus the remaining names. In addition to the expected overweight exposure to Size (Large Cap), the portfolio has a positive exposure to Momentum, Growth and Profitability when compared to the remaining S&P 500 companies. Alternatively, the top 10 companies are underexposed to Leverage and value factors like Dividend Yield, Value (Price/Book), and Earnings Yield. This has been a consistent trend over period shown. The risk factor positioning of the two portfolios and their large divergence from each other creates a skewness in the markets that is hard to bridge using a well-diversified portfolio.
The extreme levels of index concentration that we are witnessing today have important implications for portfolio construction as discussed above. To outperform the S&P 500 Index, portfolios will need to be less diversified and riskier. All of this leaves managers with a hard choice – persevere with a risk controlled diversified portfolio or chase the S&P 500. The last time this dilemma was faced was during the dot-com boom of the late 1990s. Those managers who stuck with their diversified portfolios lost clients who were desperate to keep up with the market. And those who chased the market lost clients, and much of their money, when internet stocks tumbled in the early 2000s, dragging the market down with them. Once again, portfolio managers are faced with a similar difficult choice.
Drawing Conclusions
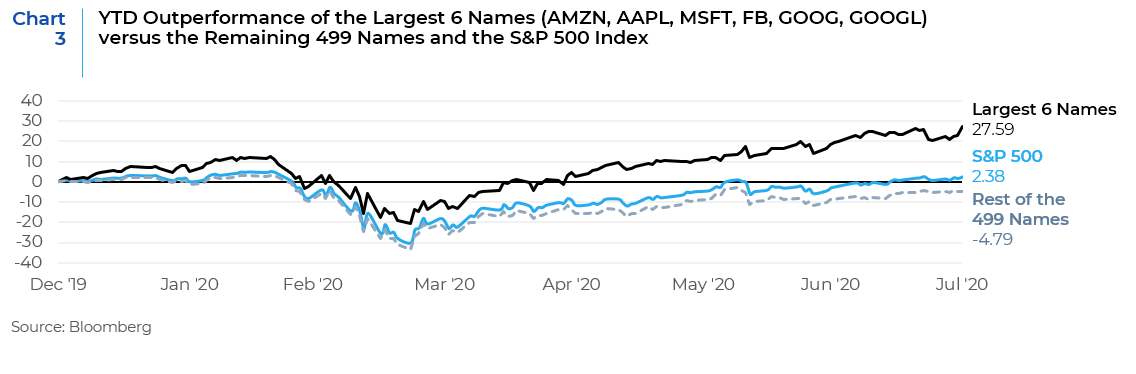
Today, the large cap technology giants have some key advantages, which justify their strong returns and earnings multiples. Over the past decade, these companies have secured their dominant positions in market segments vital to the modern global economy – online advertising and search; social media and communications; operating systems; office software; cloud computing and so on. It has helped them grow their profits much faster than companies in other industries, by harvesting constantly growing markets. This has been exacerbated by a self-perpetuating cycle, in which these firms buy their competitors long before they are large enough to mount a serious challenge. Between them, the big tech firms have acquired literally hundreds of other firms over the past decade. The coronavirus crisis has provided them with an opportunity to accelerate this process. The market capitalizations of these tech behemoths have ballooned in the past few years and their increasingly strong performance trends have completely dominated the index. Chart 3 is an illustration of this trend in the short period of seven months – from January to July of 2020.
All this makes it hard to see how the dominance of these companies can be challenged without a big shift in U.S. antitrust policy. The possibilities of such changes in the near to medium term are quite low even if there is a change in the party that comes into power. That means, for these companies to lose importance within large cap indices, investors would need to start favoring other cyclical sectors and riskier value names in the index. This can happen if the coronavirus pandemic starts to show signs of fading away and an economic recovery takes place fueled by the pent-up demand since March when the pandemic hit. When the economy was shutting down in the first quarter of this year, small and medium businesses clearly suffered the most. Investors started pricing in a steep default cycle with small companies at the forefront of the bankruptcy curve and the stock prices of these companies fell precipitously. In contrast, the large cap technology and health care names with access to untapped credit lines, the bond and equity markets, and their own cash coffers, did not suffer as severely. Since then, the Fed has opened up the liquidity spigots and the government has provided massive fiscal stimulus. At some point in the next 12 to 18 months, the pendulum will swing the opposite way and some semblance of normality will return to the U.S. economy. This may very well be the inflection point that will serve as a catalyst for a multiple expansion for smaller companies. Profit margins have likely bottomed for small caps and signs of an economic recovery can lift their stock prices faster than that of their large cap counterparts. This in turn can reduce the name concentration seen in the S&P 500 Index.
Another reason that may cause a dampening of the performance of the big techs is the hunt for yield. With interest rates being as low as they are, neither cash nor bonds offer attractive yield prospects to investors. This may result in money gravitating towards stocks that have dividend yields higher than current bond yields. Since most of the technology companies do not pay any dividends, this may cause them to be less attractive to investors searching for yield.
Stock-market breadth right now is very narrow given that a relatively small group of stocks is driving market returns. Sharp declines in market breadth has often signaled large drawdowns like what we saw after 1999 and 2007. Changes in market concentration levels also have an impact on the performance of equal-weight indices. As the largest stocks outperform, the market becomes more concentrated in those names and cap-weighted indices outperform equal-weighted indices. The present market circumstances, therefore, could present an opportunity for investors to re-evaluate equal weight approaches in U.S. equities. If the risks of the market are concentrated into a select few, high-momentum mega-cap names, one way to manage that risk is to rebalance away from recently outperforming constituents. This would be a good strategy for hedging against the drawdown that can be expected to occur in the aftermath of the current narrow markets. However, the million-dollar question that remains is how long will these narrow markets continue to be in place? Is it too early to rebalance away?
Only once before during the past 35 years have the largest stocks behaved comparably, and that occurred in 1999 as the market was about to suffer a downturn for the next two years. On both occasions (1999 and now), tech stocks enjoyed record popularity, thanks in part to aggressive participation from retail investors. Each period saw outperformance by large growth stocks, accompanied by poor returns from small value companies. The current situation appears to closely resemble that of summer 2000. One might reasonably expect the glamorous tech stocks to finally give way, just as they did two decades ago. However, the parallels are not exact. While S&P 500 concentration is higher today, other signs of speculation were greater in the past. Moreover, the current dominance of these companies is supported by strong fundamentals – increasing demand, opening up of new markets around the world, strong earnings growth, and high profit margins. Therefore, the evidence to back up the expected underperformance of the large cap tech titans does not yet appear to be conclusive or overwhelming. Regardless, portfolios have to strike a balance between growth and value in order to both capitalize on the continuing outperformance of large growth while positioning for an imminent resurgence of small cap value – a task that seems more difficult than walking on a tightrope.
Sources: BCA Research, Capital Economics, Segal Marco, FactSet, Bloomberg
This report is neither an offer to sell nor a solicitation to invest in any product offered by Xponance® and should not be considered as investment advice. This report was prepared for clients and prospective clients of Xponance® and is intended to be used solely by such clients and prospects for educational and illustrative purposes. The information contained herein is proprietary to Xponance® and may not be duplicated or used for any purpose other than the educational purpose for which it has been provided. Any unauthorized use, duplication or disclosure of this report is strictly prohibited.
This report is based on information believed to be correct, but is subject to revision. Although the information provided herein has been obtained from sources which Xponance® believes to be reliable, Xponance® does not guarantee its accuracy, and such information may be incomplete or condensed. Additional information is available from Xponance® upon request. All performance and other projections are historical and do not guarantee future performance. No assurance can be given that any particular investment objective or strategy will be achieved at a given time and actual investment results may vary over any given time.