
There are decades when nothing happens and there are weeks when decades happen. The last three years and particularly the weeks since February 24th have coughed up more so-called ‘tail-risk’ events than the entire pre-pandemic decade! We would argue that one’s response should be grounded by one’s pre-crisis discipline and be informed by asset price relationships before the era of falling or flatlining inflation and before the era of non-consequential geopolitical risk premia. In Asset Allocation During Challenging Geopolitical Times, we posited that Russia’s revanchism is symptomatic of Great Power rivalry within the context of a more structural multipolar geopolitical re-alignment. For investors, this realignment presages a more volatile, less efficient, and more inflationary global economy; coupled with higher investment risk premia, changing correlations and lower diversification benefits from traditional “safety assets”, such as bonds in asset allocation models.
The Russian invasion of Ukraine is also compounding supply bottlenecks and exacerbating inflation levels that had already been at 40-year highs. These circumstances echo 1973, when an oil supply shock driven by geopolitical events in the Middle East exacerbated already building inflation pressures. The 1973 oil shock also slowed growth, making it more painful for policy makers to tighten in response to accelerating inflation. Then as now, inflation was consistently higher than what was priced in by the market and both the Fed and the markets consistently looked through the rise in inflation, assuming it would not be sustained, and that significant tightening would not prove necessary in response. Policy makers also fell behind on tightening because of the exogenous, one-off nature of the shock and the risk to growth. It took over a decade of rising inflation before the Fed raised real interest rates in a sustained way—i.e., tightened more than inflation was already rising, such that the real cost of capital rose. Today, the picture is even more extreme in that real rates are more negative than they were in the ’70s and falling. G7 central banks are consequently dialing up their hawkish rhetoric, led by the Fed. Recent releases of key data watched closely by the Fed continue to suggest a hawkish path going forward:
- Inflation remains strong in the US. Core CPI came in at 7.9% year-on-year in February and is expected to accelerate in next week’s release. (Note March 2022 Core CPI came in at 8.5%)
- Nonfarm payrolls are still robust. The US added 431K jobs in March, nudging the unemployment rate to a cycle low of 3.6%.
- Wages are inflecting higher, which is pulling up unit labor costs. The Atlanta Fed Wage Growth Tracker currently sits at 6%.
These developments continue to underpin market expectations for aggressive interest rate increases. The market now expects the Fed to raise rates to 2.25% by December 2022, putting upward pressure on the U.S. dollar. The question, as our Fixed Income Team ponders is: can the Fed really engineer a soft landing while reining in runaway inflation, a shrinking Fed balance sheet, ongoing supply chain disruptions exacerbated by the Ukraine invasion, in addition to the natural tension between supply induced inflation vs demand driven inflation without pricking a recession? The historical evidence of its ability to do so is not encouraging. Therefore, we believe that the odds of a recession are considerable in 2023. Alternatively, will the Fed maintain their resolve to combat inflation by hiking interest rates if the economy starts to lose jobs or will they succumb to political pressure and start to lower rates before inflation is quelled? This latter scenario would lead to a stagflation environment of subdued growth but higher rates than we have seen over the past two decades. As argued in our Systematic Equity Team’s Outlook, stagflation has shifted from a tail event to the center of the binomial distribution. Their piece examines the changing factor relationships and fundamental characteristics that are likely to drive relative performance going forward.
What’s Different Relative From the 1970s?
But there are many differences between today’s economy and that of the 1970s—commodities make up a smaller share of GDP, and a less unionized workforce and a more digital economy make inflation less likely to compound. There are also large differences between countries’ vulnerability to a commodity supply shock today, as the U.S. is now a net oil exporter while Europe is likely to experience a larger growth hit.
Regional Differences Among EM Markets Matter Most
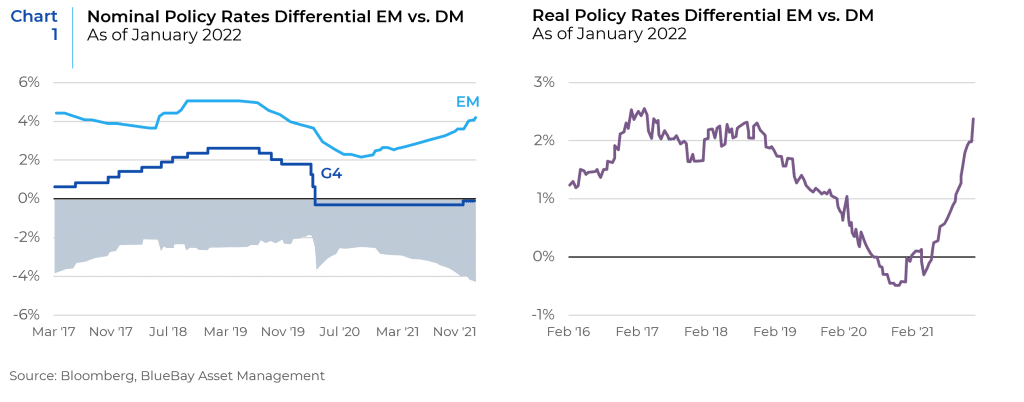
The roughly 1.2 percentage point rise in Treasury yields over the past six months also echoes the “taper tantrum” of 2013, when emerging markets suffered capital flight because of a hawkish Fed. Thus far, there is scant sign of a repeat retrenchment on that scale, in part because many middle-income countries now have stronger balance-sheets, and also because many emerging-market central banks have been raising interest rates to get ahead of the inflation problem. Most EM local currency markets have positive real rates and reflect the highest historical real rate differential relative to developed markets. (Chart 1). Moreover, certain EM markets, particularly those that are commodity exporters (Mexico, Nigeria, South Africa, Chile and Saudi Arabia) should be further supported by improving current account flows.
In China, for example, aggregate financing and new bank loans for March grew well above consensus forecasts, primarily due to local government bond issuance. We expect more fiscal and monetary accommodation in China as both the economy and risk assets continue to face headwinds over the near-term from weak underlying economic conditions, particularly in the service sector, and surging COVID-19 cases.1
But Stagflation = Greater Political Instability
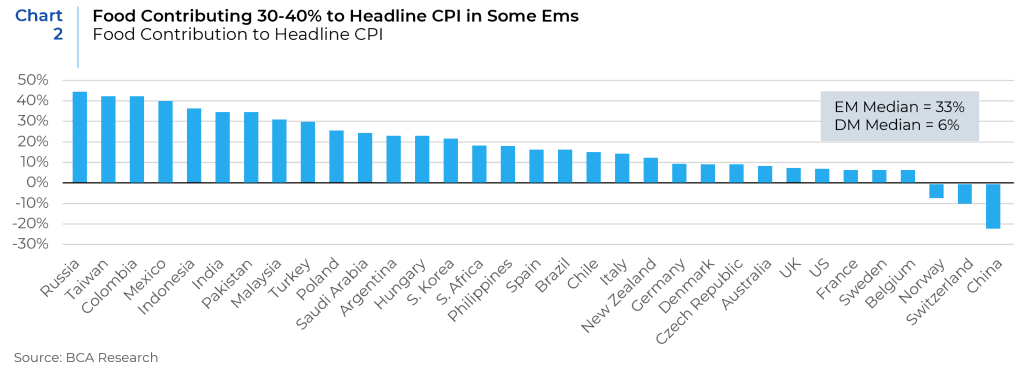
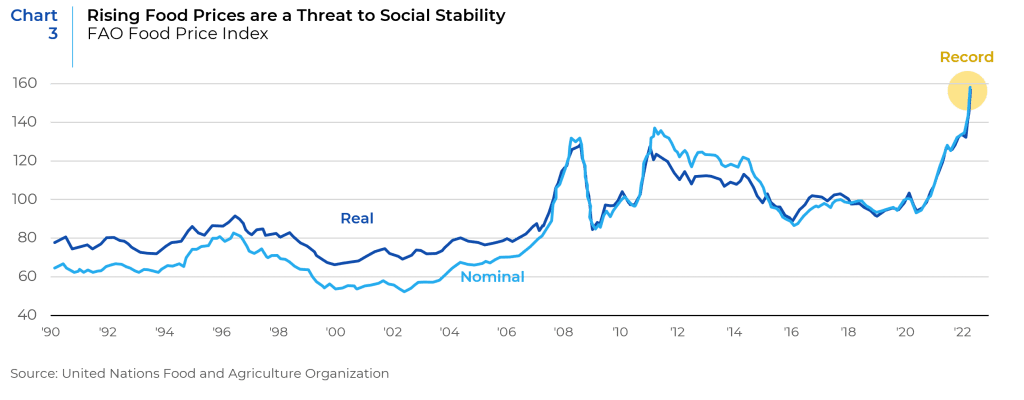
Stagflation environments have historically fostered political instability. Indeed, as of the writing of this piece, burgeoning stagflation in France has boosted the standing of both the far right and far left candidates at the expense of the centrist incumbent. In poor and some middle income countries, we are also watching the impact of rising food prices on social stability, particularly among less developed economies where staple goods account for a larger share of consumer budgets. (Chart 2). The FAO food price index jumped by a record 13% m/m in March to a new all-time high for the series which dates back to 1990. (Chart 3). Prices across all five commodity groups – cereals, vegetable oils, dairy, meat, and sugar – increased significantly with the vegetable oils, cereals, and meat sub-indices reaching fresh highs. Additionally, the prices of fertilizers, such as potash (Russia and Belarus contribute 40% of global potash), have skyrocketed as soaring natural gas prices forced some European producers to halt production. Already, we have seen food-related skirmishes in Russia and anti-government protests have flared up in Peru. These demonstrations were initially triggered by rising fuel and fertilizer costs but have since escalated and President Pedro Castillo is now fending off calls for his resignation. Sri Lanka has suspended payment on the $35 billion its government owes to foreign creditors and is now enduring a political and economic crisis that has prompted most of the cabinet to resign. Social unrest is likely to broaden to other regions globally. Turkey is particularly vulnerable. It is heading to a general election in June 2023, President Erdogan’s government is mature, and the ruling AKP party’s lead has been shrinking in opinion polling.
In summary, 2022 has brought in a cornucopia of macro-economic and geopolitical risks that can easily foster fear-based and/or binary emotional responses. On the non-US and EM front, stark regional and sector differences warrant an emphasis on active country and security selection. Additionally (or perhaps consequently), the leadership shown during the value rally across developed markets in Q1 2022 portends either an unusual one-off aberration or a regime change in market dynamics that will lead asset allocators to re-examine their portfolio positioning (see the upcoming Xponance Insights paper for a discussion with Boutique managers on the issue). As a primer, we suggest studying asset price performance and relationships in prior stagflation environments. In our research paper Asset Allocation During Challenging Geopolitical Times, we posited that the most likely winners would be commodities, real assets, cash, managed futures, active managers, defense stocks, U.S. small cap and possibly, cryptocurrencies. Some of these assets (notably fossil fuel and defense companies) will need to be considered relative to asset owners’ ESG goals. Strategic ESG allocation options range from avoidance, to choosing companies within these sectors with the highest ESG scores, to investing in technologies that provide greener alternatives (whose substitutionary benefits would presumably be enhanced by higher hydrocarbon prices) as the world attempts to reduce the heightened geopolitical risks of oil and natural gas.
1The rout in Chinese tech stocks, 2020’s global investment darlings, has continued as they face a perfect storm of geopolitical, regulatory, and fundamental economic factors. While the prospect of delisting from American bourses complicates the trading of these Chinese stocks, it should not have a material impact on their long-term business outlook, as most large cap Chinese tech stocks are already dual-listed on the Hong Kong Exchange. With Chinese tech stocks trading at 0.8 times price-to-book, 4.7 times price-to-cash flow and 8.4 times trailing earnings, (which is well below that of global tech firms), investors will need to weigh these valuations relative to the long-term outlook for their business prospects in a more intrusive regulatory environment. At a minimum, 2020’s lofty valuations for these firms insufficiently discounted likely lower levels of profitability that the new regulatory environment now portends. Whether such factors are now overly discounted by the market is more contentious, and probably best considered on a company-level basis; perhaps this matter is best left to highly active and nimble country/sector experts. Large degrees of change usually yield big winners and losers, and thus high degrees of alpha availability with potentially poor returns from passive investments.
This report is neither an offer to sell nor a solicitation to invest in any product offered by Xponance® and should not be considered as investment advice. This report was prepared for clients and prospective clients of Xponance® and is intended to be used solely by such clients and prospective clients for educational and illustrative purposes. The information contained herein is proprietary to Xponance® and may not be duplicated or used for any purpose other than the educational purpose for which it has been provided. Any unauthorized use, duplication or disclosure of this report is strictly prohibited.
This report is based on information believed to be correct but is subject to revision. Although the information provided herein has been obtained from sources which Xponance® believes to be reliable, Xponance® does not guarantee its accuracy, and such information may be incomplete or condensed. Additional information is available from Xponance® upon request. All performance and other projections are historical and do not guarantee future performance. No assurance can be given that any particular investment objective or strategy will be achieved at a given time and actual investment results may vary over any given time.