
One of the arguments against the existence of an ESG alpha is that other non-ESG factors are entirely responsible for relative performance. For example, positive ESG exposure to large cap growth companies, particularly in the Information Technology and Communication Services sectors and an underweight exposure to value tilted “brown ESG” sectors such as Energy, Industrials and Utilities has been used to explain relative performance of ESG portfolios targeting a better or worse ESG profile versus a cap weighted benchmark. The rationale for this view is that performance is explained by differences in sector, industry, and style factor exposures and not because of ESG characteristics.
We try to address this debate in this post using internal research to analyze if there is alpha potential in ESG, i.e., a return to ESG characteristics that is not fully captured by the sector, industry, or risk factor exposures of a portfolio.
Methodology
To analyze the alpha potential in ESG we adopted a methodology based on neutralizing exposures to sectors, industries, and risk factors. This approach isolates the contribution of ESG from other effects by constructing a pair of portfolios that maximize and minimize ESG scores while matching the key risk characteristics, sector, and industry weights of a selected index. The resulting return difference between the two portfolios represents the ESG return premium or alpha potential, as all other factors have been neutralized.
The ESG Return Premium is measured as the differences in the returns between the exposure neutralized Min ESG Risk and Max ESG Risk portfolios:
ESG Return Premium = Ret (Min ESG Risk Portfolio) – Ret (Max ESG Risk Portfolio)
We used Sustainalytics ESG Risk Scores for this research and simulated portfolios using a monthly rebalancing process. The targeted benchmark is the S&P 500. ESG Risk Scores measure a company’s exposure to material ESG risks and how well it is managing those risks. As the Sustainalytics scores measure ESG risk, lower scores indicate that a company has lower exposure to material ESG risks, and higher scores indicate that a company has higher exposure to material ESG risks. Each simulation included two portfolios, created to minimize (Min ESG) and maximize (Max ESG) ESG Risk Scores versus the S&P 500 index. To eliminate the impact of non-ESG factors on relative performance, sector, industry, and risk factor exposures were neutralized. Specifically, we match the S&P 500’s sector weights, industry weights, and the risk factors during the monthly rebalance process in each of the two portfolios.
We created four pairs of simulated portfolios. In the first iteration sector and factor exposures were neutralized. In a second iteration, we build portfolios that are also industry-neutral in addition to being sector-neutral and factor-neutral. Portfolio construction constraints for the four simulation pairs are shown in Table 1.
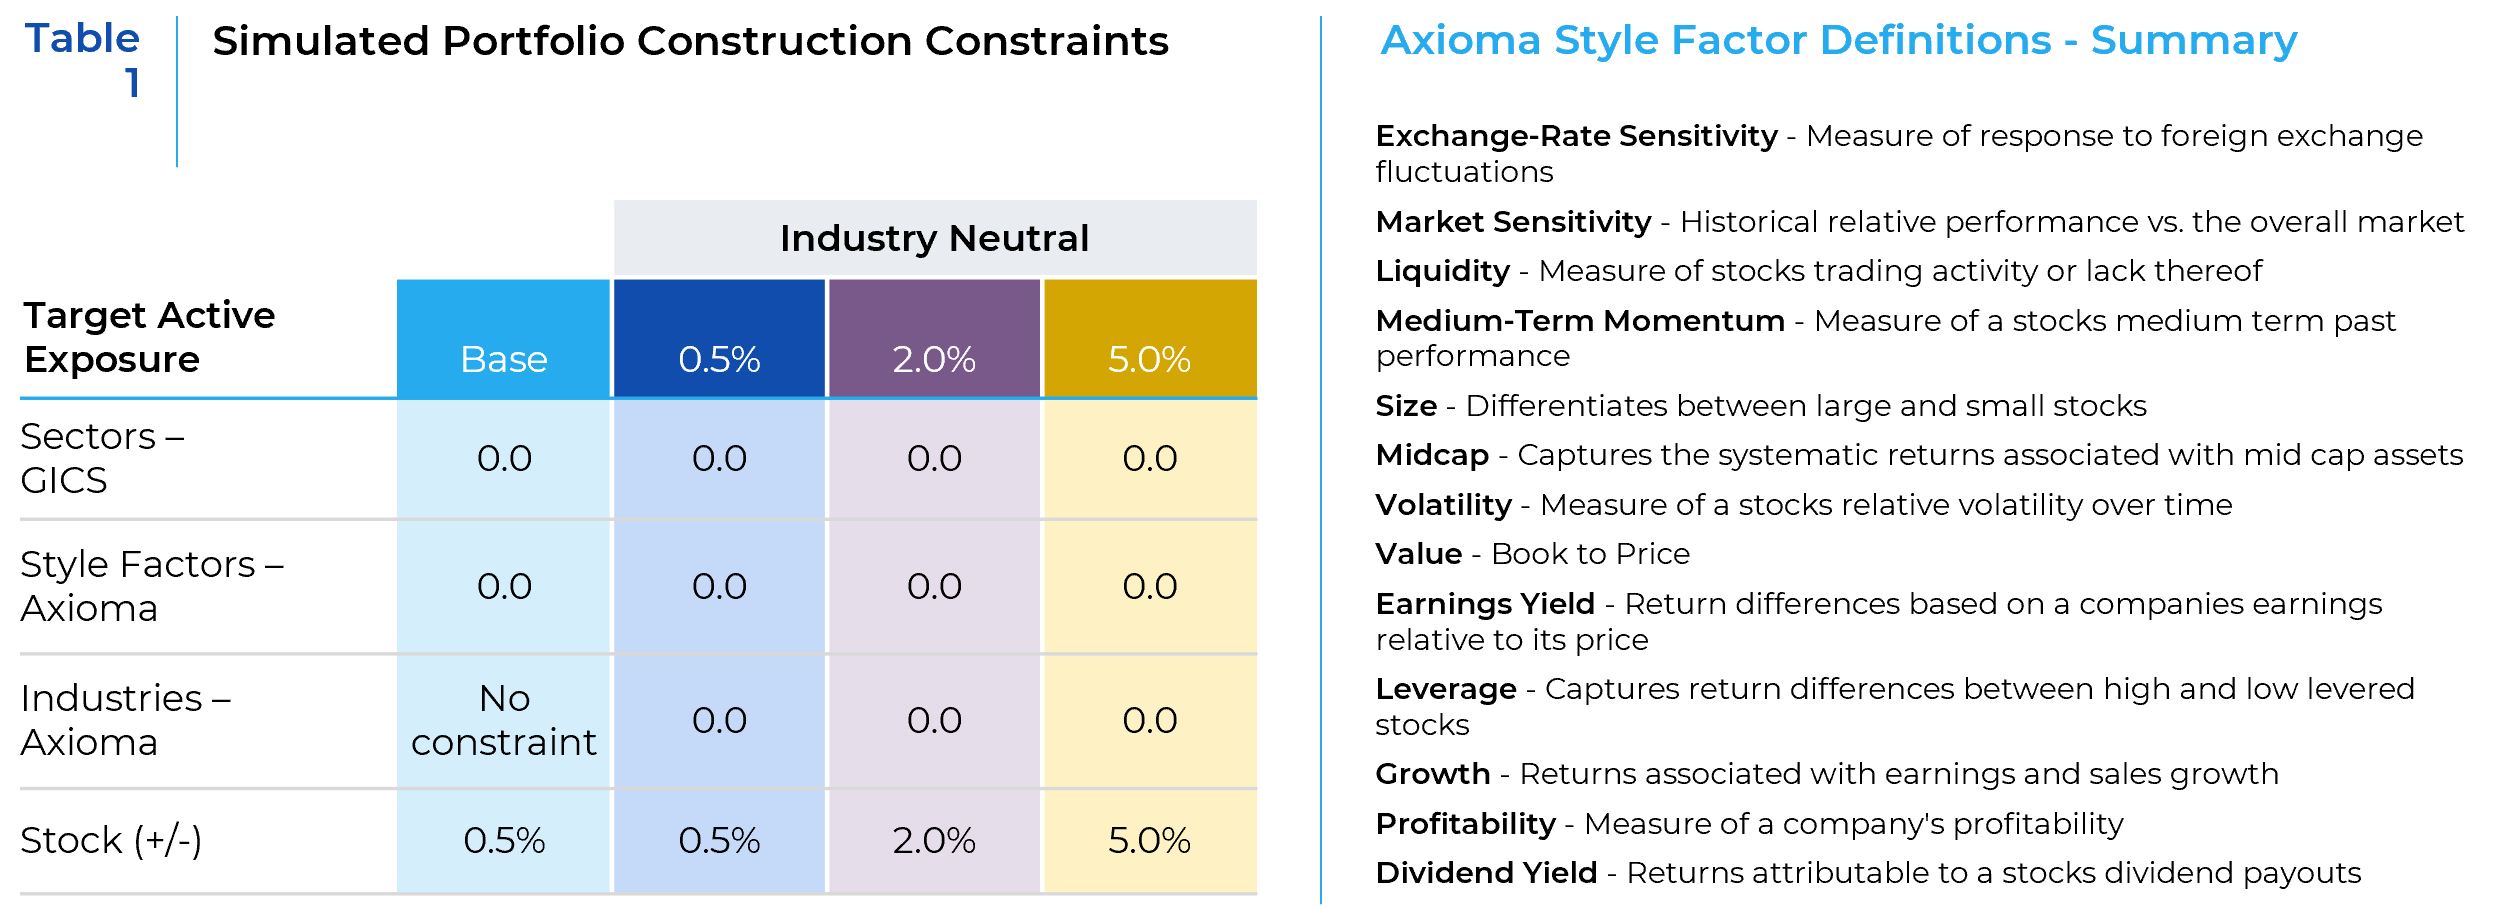
In the Base Case sector and factor exposures are neutralized but there are no constraints on industry exposure and active stock weights are capped at +/- 0.5%. The three additional simulations neutralized sector, factor, and industry exposures but targeted active stock exposures at +/-0.5%, +/-2.0%, and +/-5.0% levels respectively. The objective function used in the monthly rebalancing process was targeted to minimize or maximize the portfolio ESG Risk Scores. The period for the study is 12/31/15 to 06/30/22, the available history for the ESG Risk scores. Because the two portfolios differ only in their ESG exposures, their return difference, the ESG Return Premium, can for the most part be attributable to ESG risk exposures.
Research Findings and Analysis of Results
We look at both portfolio characteristics and portfolio performance to draw conclusions about the alpha potential in ESG exposures.
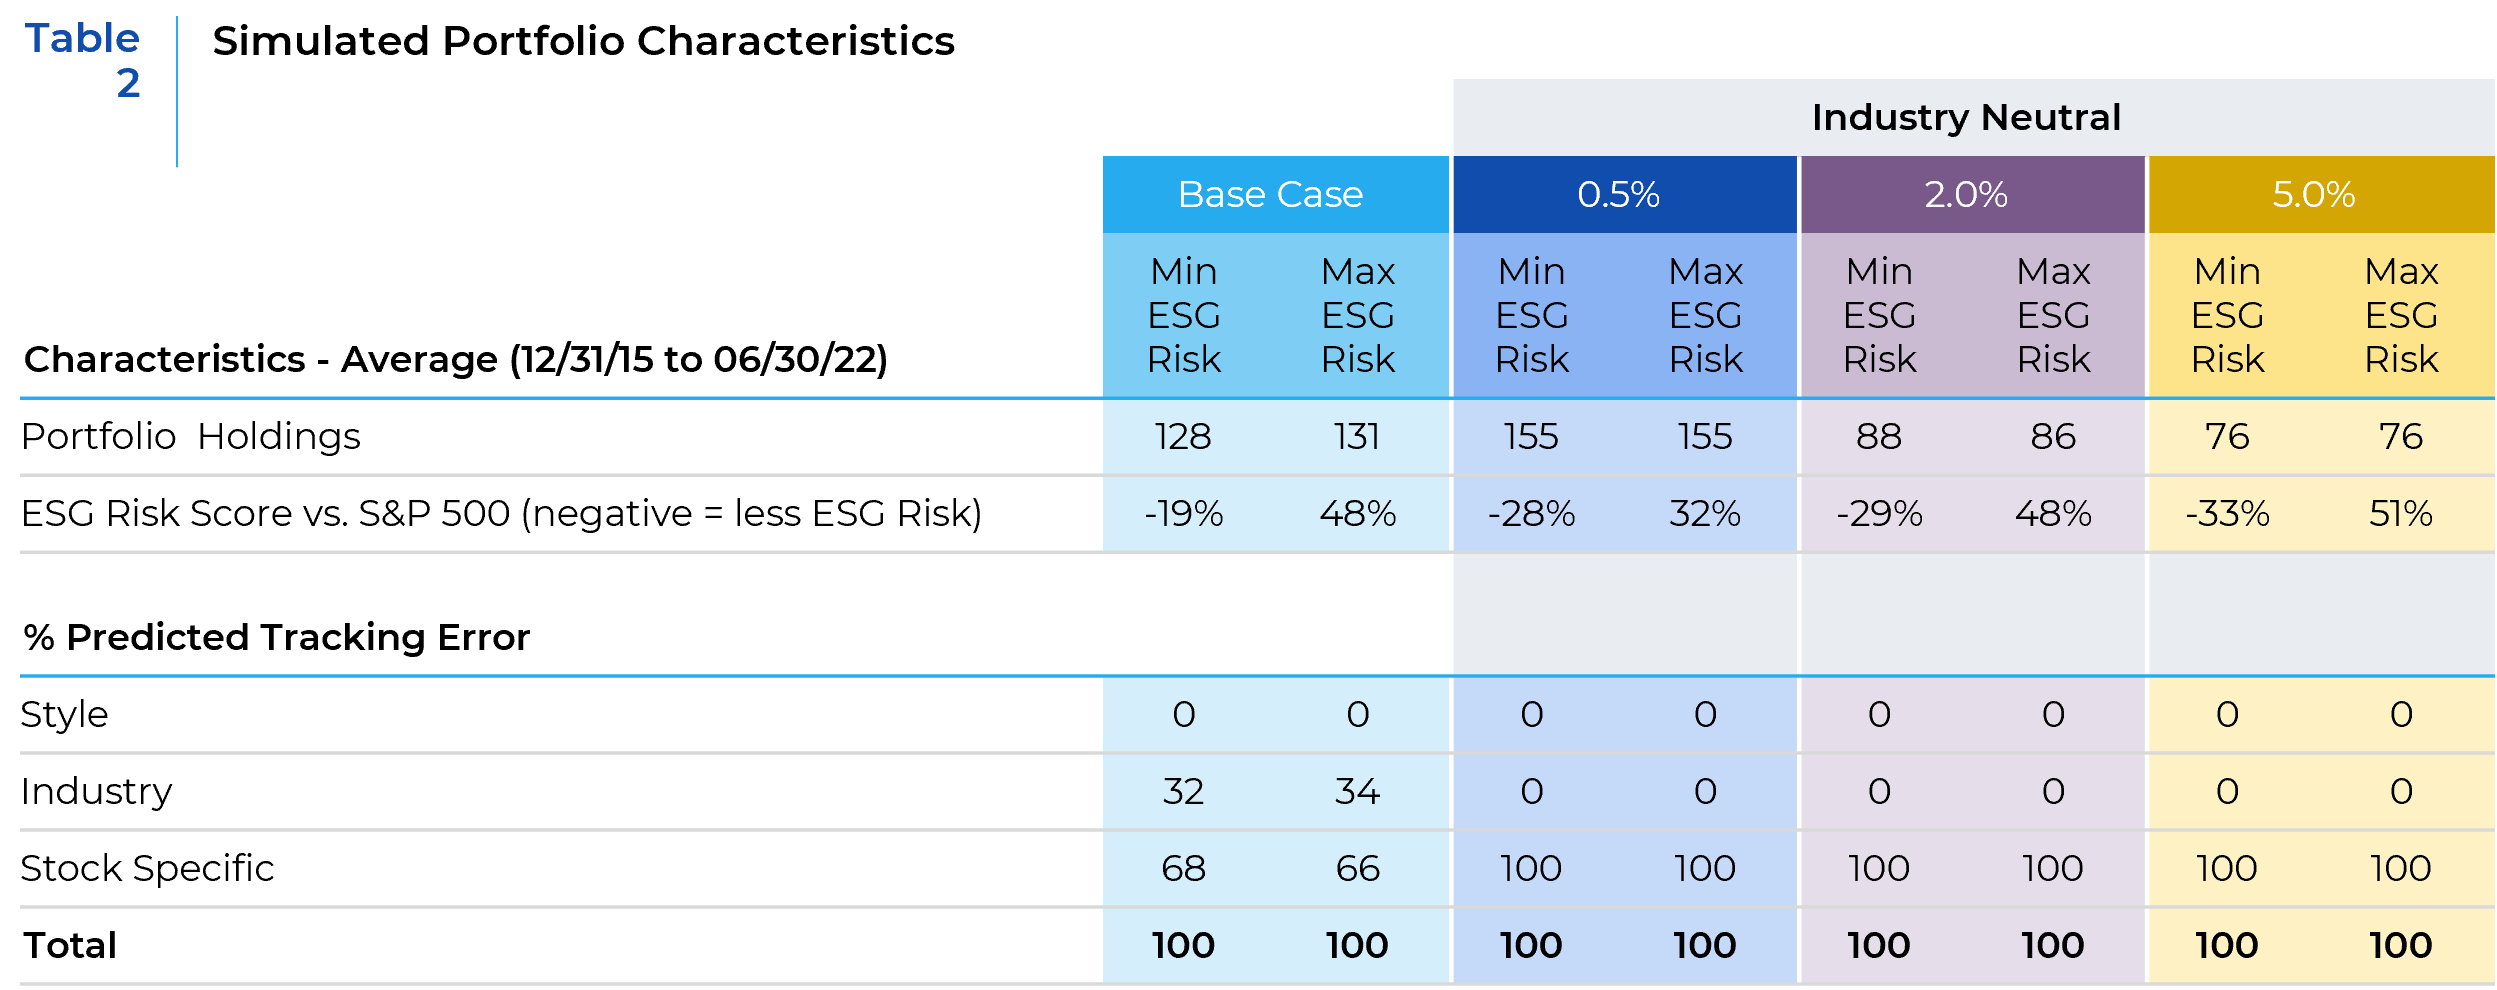
As Table 2 shows, on average, each simulation represents a diversified portfolio of 76 to 155 holdings. The number of holdings decreases as active stock weight constraints are relaxed. Each of the Min ESG Risk portfolios have much better ESG profiles when compared to the S&P 500. The opposite applies to the Max ESG Risk portfolios. Analysis of the average predicted tracking error highlights that for the Base Case simulations with no industry constraint an average of approximately 67% of the predicted tracking error or active risk is attributed to stock specific exposure with the remaining 33% allocated to industry exposure. As expected, when the industry constraint is added, stock specific risk jumps to 100% of active risk. In other words, for the portfolios with all constraints (sector, industry, and factors) in place, all the excess returns versus the benchmark, whether positive or negative, can be attributed to the stocks in the portfolio.
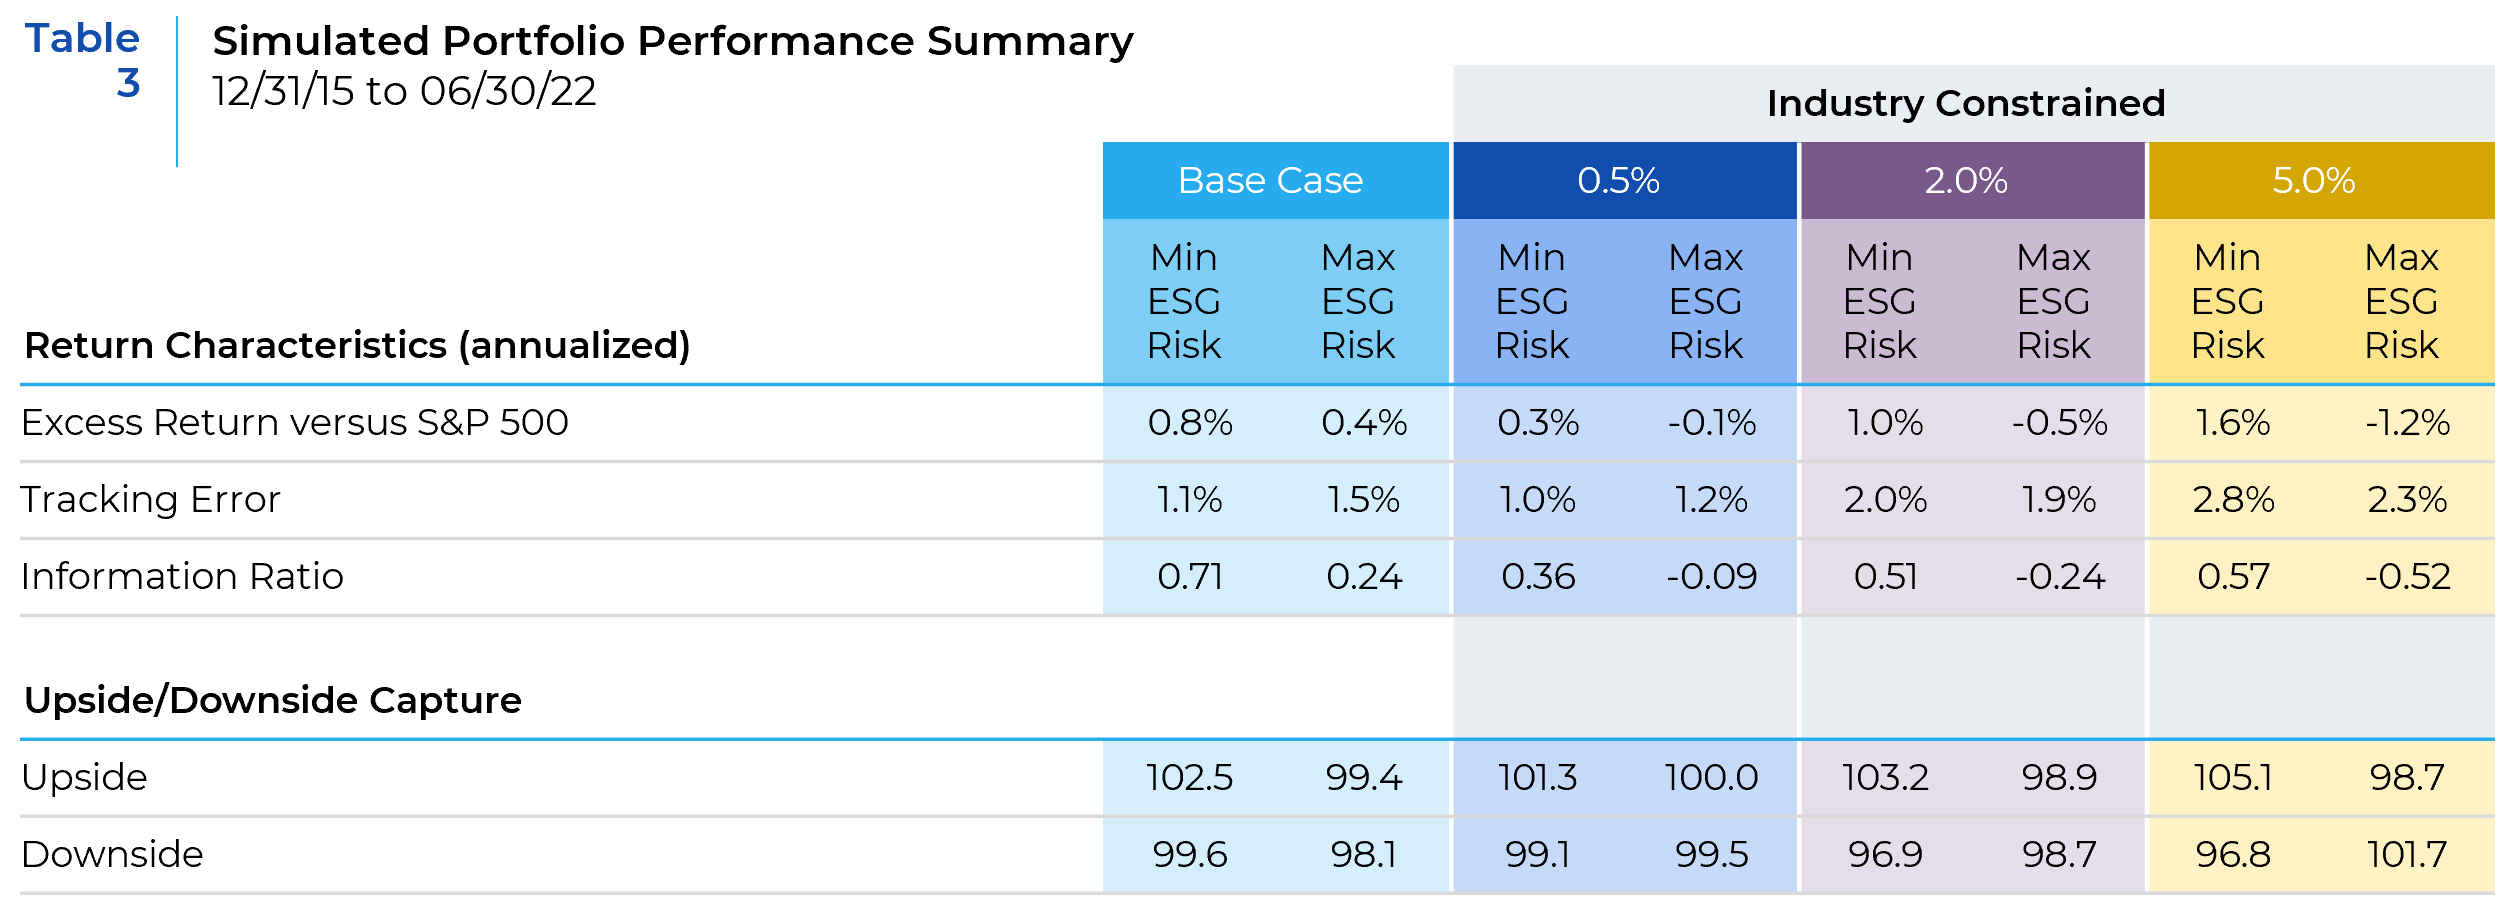
In reviewing the performance summary (Table 3), it is apparent that in each simulation comparison, the Min ESG Risk portfolio has higher excess return, lower tracking error, and a higher Information Ratio than the Max ESG Risk portfolio. Realized tracking error for all simulations is less than 3%, indicating reasonable risk levels for all the portfolios. The Upside/Downside capture characteristics of the Min ESG Risk portfolio highlight their effectiveness in generating excess return in both positive and negative equity markets. That is not always the case with the Max ESG Risk portfolios. Relaxing the active stock exposure constraints improved performance characteristics of the industry constrained simulations. This indicates that the information or alpha potential in the ESG Risk Scores is more effectively manifested in the portfolios in these simulations.
The analysis of this study shows that there was a positive ESG Return Premium between the performance of portfolios with lower ESG Risk (Min ESG) versus portfolios with higher ESG Risk (Max ESG). This positive ESG Premium was achieved while neutralizing the impact of sector, industry, and style factor exposures, i.e., stock selection was the driver of return. The ESG return premium increased as the active stock constraint was relaxed.

In Table 4, we use the monthly time series of the ESG premium to calculate annualized statistics and examine the trends. The information ratio is substantially higher for the ESG return premium derived from the pair of portfolios with the least constraint on active stock weights. It is not surprising that this is the series with the highest excess returns and also the highest tracking error. In other words, the more active the portfolio, the higher the potential for alpha using ESG characteristics.
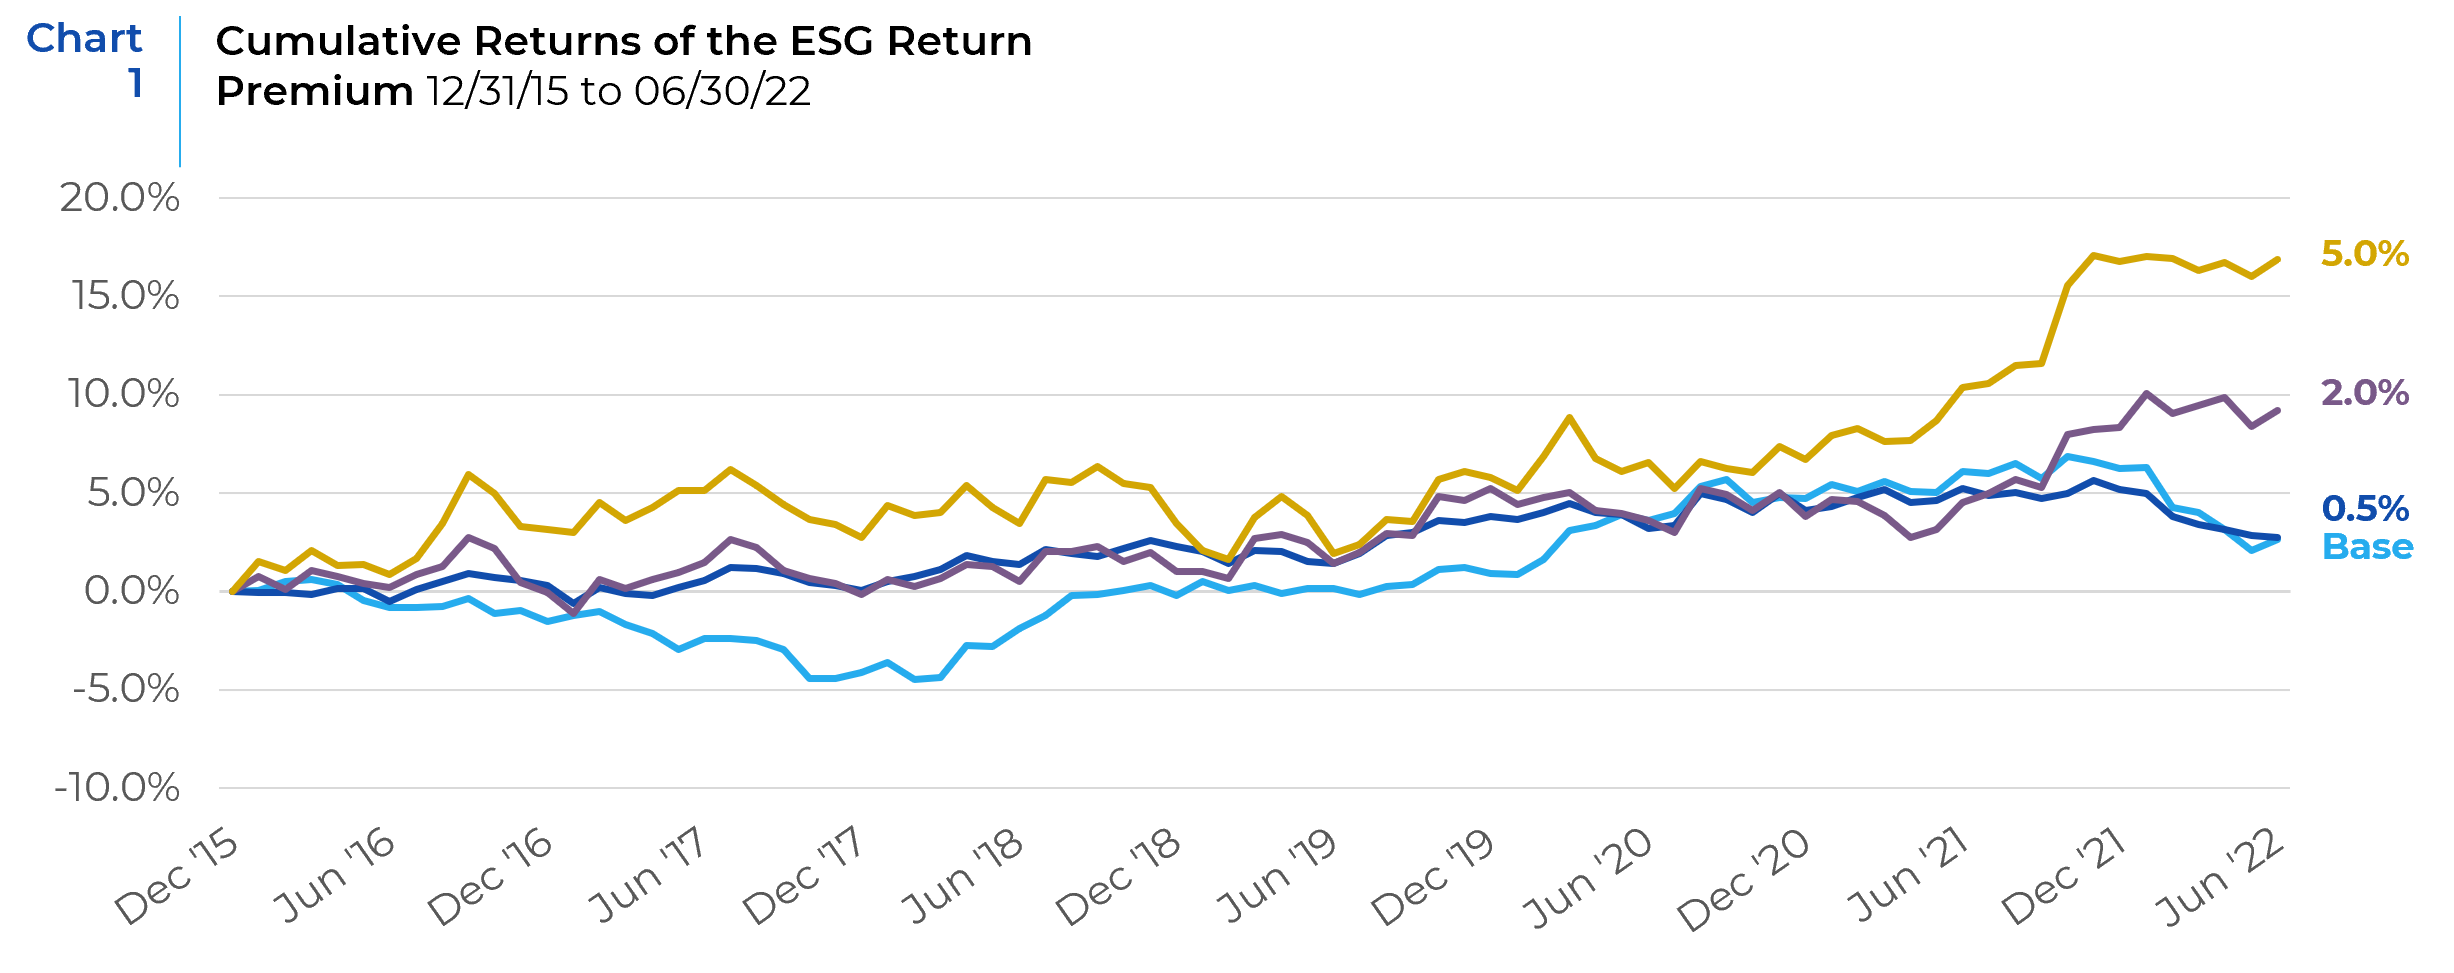
Chart 1 highlights the more consistent performance of the industry neutralized simulations versus the Base Case. The +/-5.0% active stock weight simulations recorded the strongest return premium throughout. The Base Case premium was negative early in the study before turning positive in 2018.
The excess return over the S&P 500 index achieved by the Min ESG Risk simulations indicates the potential for a long only implementation of this approach. Further, the positive Min ESG Risk vs. Max ESG Risk premium is supportive of a possible long/short implementation. The results shown in this post provide some empirical evidence that there is a non-priced alpha associated with the Sustainalytics ESG Risk Scores.
Economic Rationale for the Alpha Potential in ESG
The results presented above point out that there is alpha potential attributable to the ESG factor. These can be justified by sound economic rationale. The value potential of the “E” in ESG can come from both risk mitigation and opportunity capture. Risks stem from current negative externalities that a company may be forced to address to protect itself in the future. For example, carbon emitters and other polluters may have to bear disproportionate costs from adverse community action, customer sentiment, regulation, shareholder activism, and reputational damage. Proactive risk mitigation could mitigate these costs and lessen return volatility. Environmental opportunity capture relates to capitalizing on business and innovation opportunities generated by current environmental concerns. Such efforts could result in higher future profits. For example, servers in commercial data centers generate a lot of heat and require considerable resources for cooling. Locating such facilities in areas where naturally cooler temperatures and wind can be harnessed for cooling could reduce both energy costs and the eco-footprint. The “S” in ESG also has the potential to create considerable value. As an example, investment in employee development and growth could lead to better execution of internal business processes, which in turn could lead to enhanced product and service quality, customer satisfaction, and ultimately profits. The “G” in ESG is addressed through the adoption of governance mechanisms that facilitate the preservation of value and return to shareholders. For example, effective boards and active ownership by investors could encourage firms to pay out excess cash, thereby removing potential temptation for empire-building or over-investment by corporate executives. Therefore, ESG measures can serve as leading indicators of long-term financial performance.
Another reason for ESG performance to have alpha potential is that the market misprices its value potential. Such mispricing could result from incomplete disclosures by firms of their ESG efforts, difficulty in verifying what is disclosed in the absence of independent attestation, and heterogeneity in investor opinion about the value of ESG. In addition, even with an improvement in the underlying data, providers of ESG scoring systems can disagree on the relative attractiveness of companies based on their ESG characteristics.
The story of course is not one-sided. There are a number of potential concerns about the relationship between ESG and shareholder value. ESG efforts are not expected to be costless and, given diminishing returns to investment, more is not always better. Some ESG efforts might therefore represent over-investment. This is especially problematic if the payback period and return on investment are difficult to assess. For example, a bigger board could hamper timely decision-making and impose other coordination costs. As another example, excessively restrictive executive compensation policies could hurt a firm’s ability to hire the most talented executives who ordinarily have more employment options.
In essence, ESG efforts may impact the fundamental elements of shareholder value – profitability, future growth, and risk – in myriad ways. ESG efforts might lower short-run profitability but enhance growth and mitigate risk, thereby enhancing long-run shareholder value. Conversely, ignoring ESG might raise short-term profitability but reduce growth and raise risk, reducing long-run shareholder value. Alternatively, ESG efforts may penalize profitability without sufficiently offsetting effects on growth and risk. These arguments create concerns about the positive alpha potential of ESG and underscore the need to consider accurate and material ESG factors when assessing companies to invest in.
References:
Scientific Beta, “Honey, I Shrunk the ESG Alpha”: Risk-Adjusting ESG Portfolio Returns, April 2021
Causeway ESG White Paper Series, ESG and Alpha: The Role of Materiality, September 2017
Alpha Enhancement in Global Equity Markets with ESG Overlay on Factor-Based Investment Strategies, Subhransu S. Mohanty, Odette Mohanty, Mike Ivanof, June 2021
Barclays Research, “Measuring ESG Return Premium in the Equity Markets – the Right Way, July 2021
CFA Institute Certificate of ESG Investing Training Manual, 2021
This report is neither an offer to sell nor a solicitation to invest in any product offered by Xponance® and should not be considered as investment advice. This report was prepared for clients and prospective clients of Xponance® and is intended to be used solely by such clients and prospects for educational and illustrative purposes. The information contained herein is proprietary to Xponance® and may not be duplicated or used for any purpose other than the educational purpose for which it has been provided. Any unauthorized use, duplication or disclosure of this report is strictly prohibited.
This report is based on information believed to be correct, but is subject to revision. Although the information provided herein has been obtained from sources which Xponance® believes to be reliable, Xponance® does not guarantee its accuracy, and such information may be incomplete or condensed. Additional information is available from Xponance® upon request. All performance and other projections are historical and do not guarantee future performance. No assurance can be given that any particular investment objective or strategy will be achieved at a given time and actual investment results may vary over any given time.