
There has been a long-standing belief that the small-cap universe offers greater opportunity for active management to add value relative to a capitalization weighted benchmark than is the case for the large-cap universe. We compare the alpha generation potential of active managers in these two universes and attempt to identify some structural reasons behind this divergence in relative performance. Throughout, we use the S&P 500 and Russell 2000 indexes to represent the comparative benchmarks for large-cap and small-cap active managers, respectively.
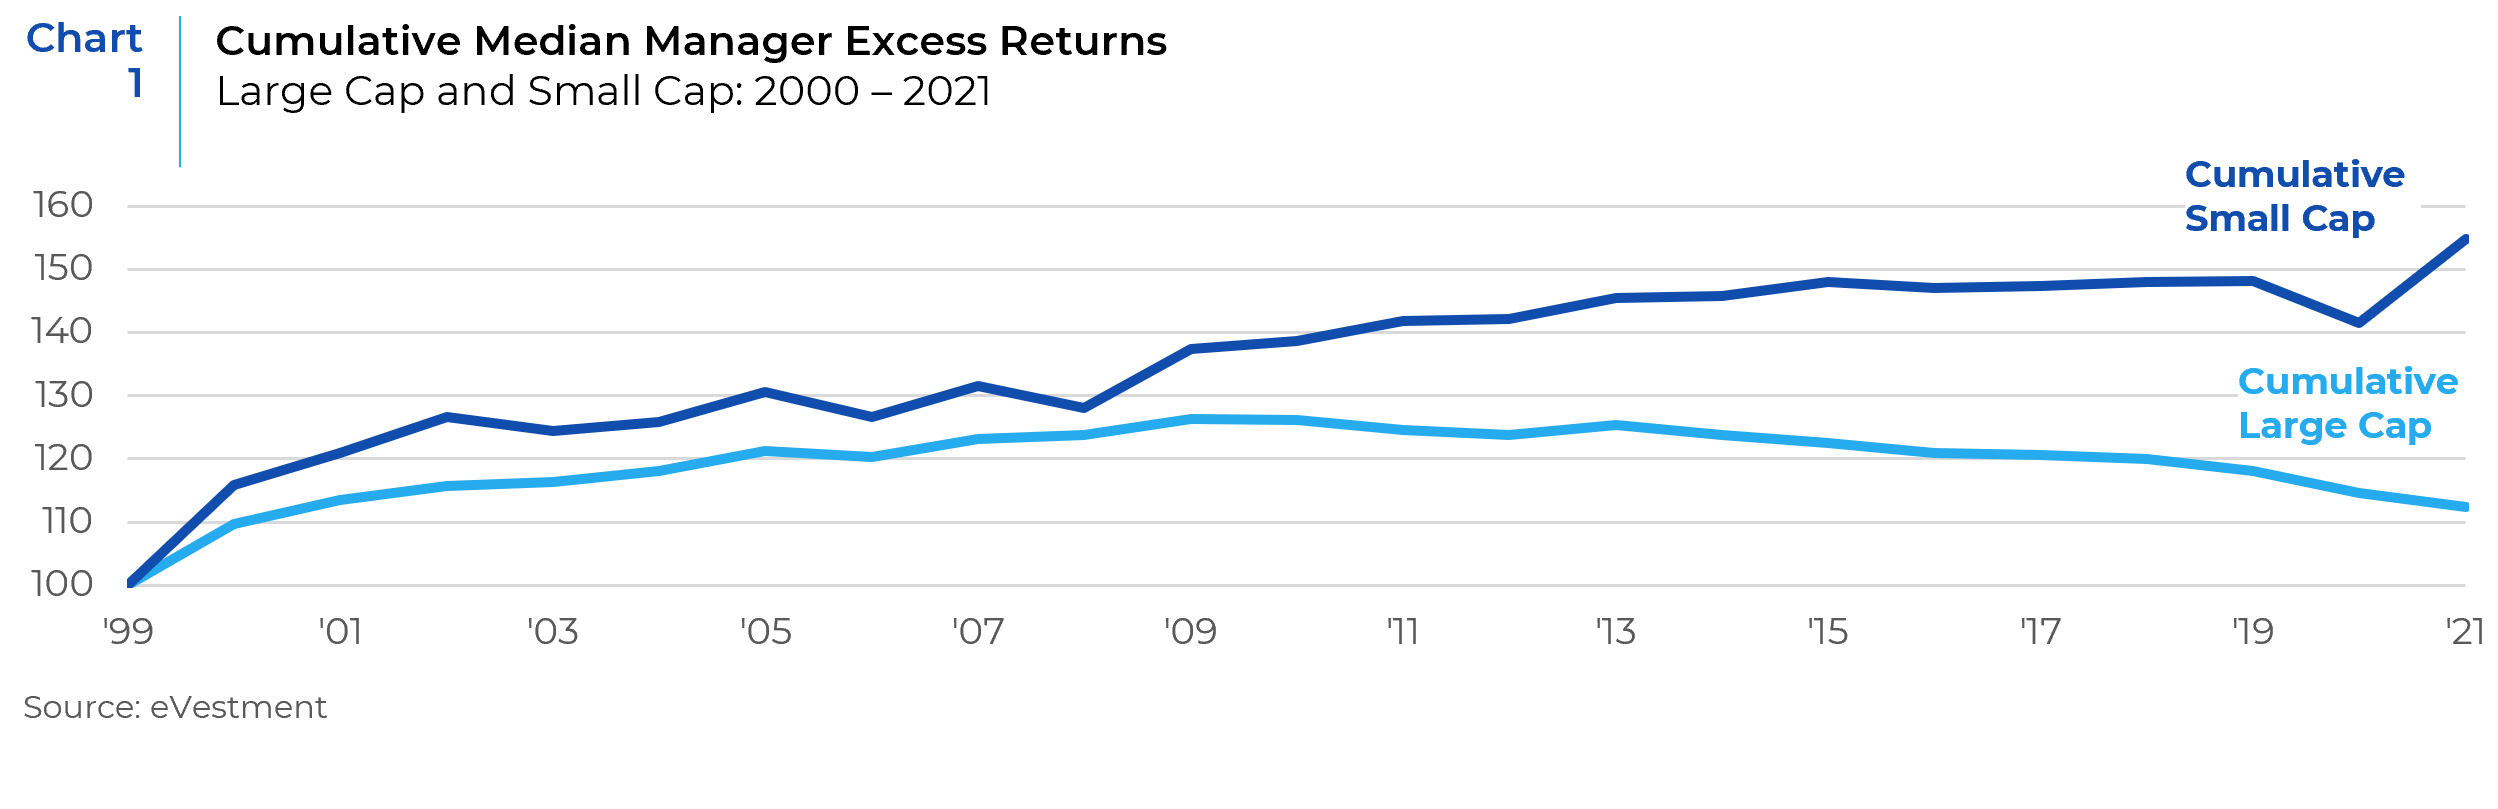
Chart 1 looks at the cumulative excess returns of the median manager in the large cap and small cap universes versus their respective benchmarks – S&P 500 and Russell 2000. This data was extracted from eVestment and covers a period of 21 years. There is a clear divergence in the generation of alpha in the two universes with the median small cap manager margin of outperformance versus the Russell 2000 being substantially larger than the margin of outperformance seen for the median large cap manager.
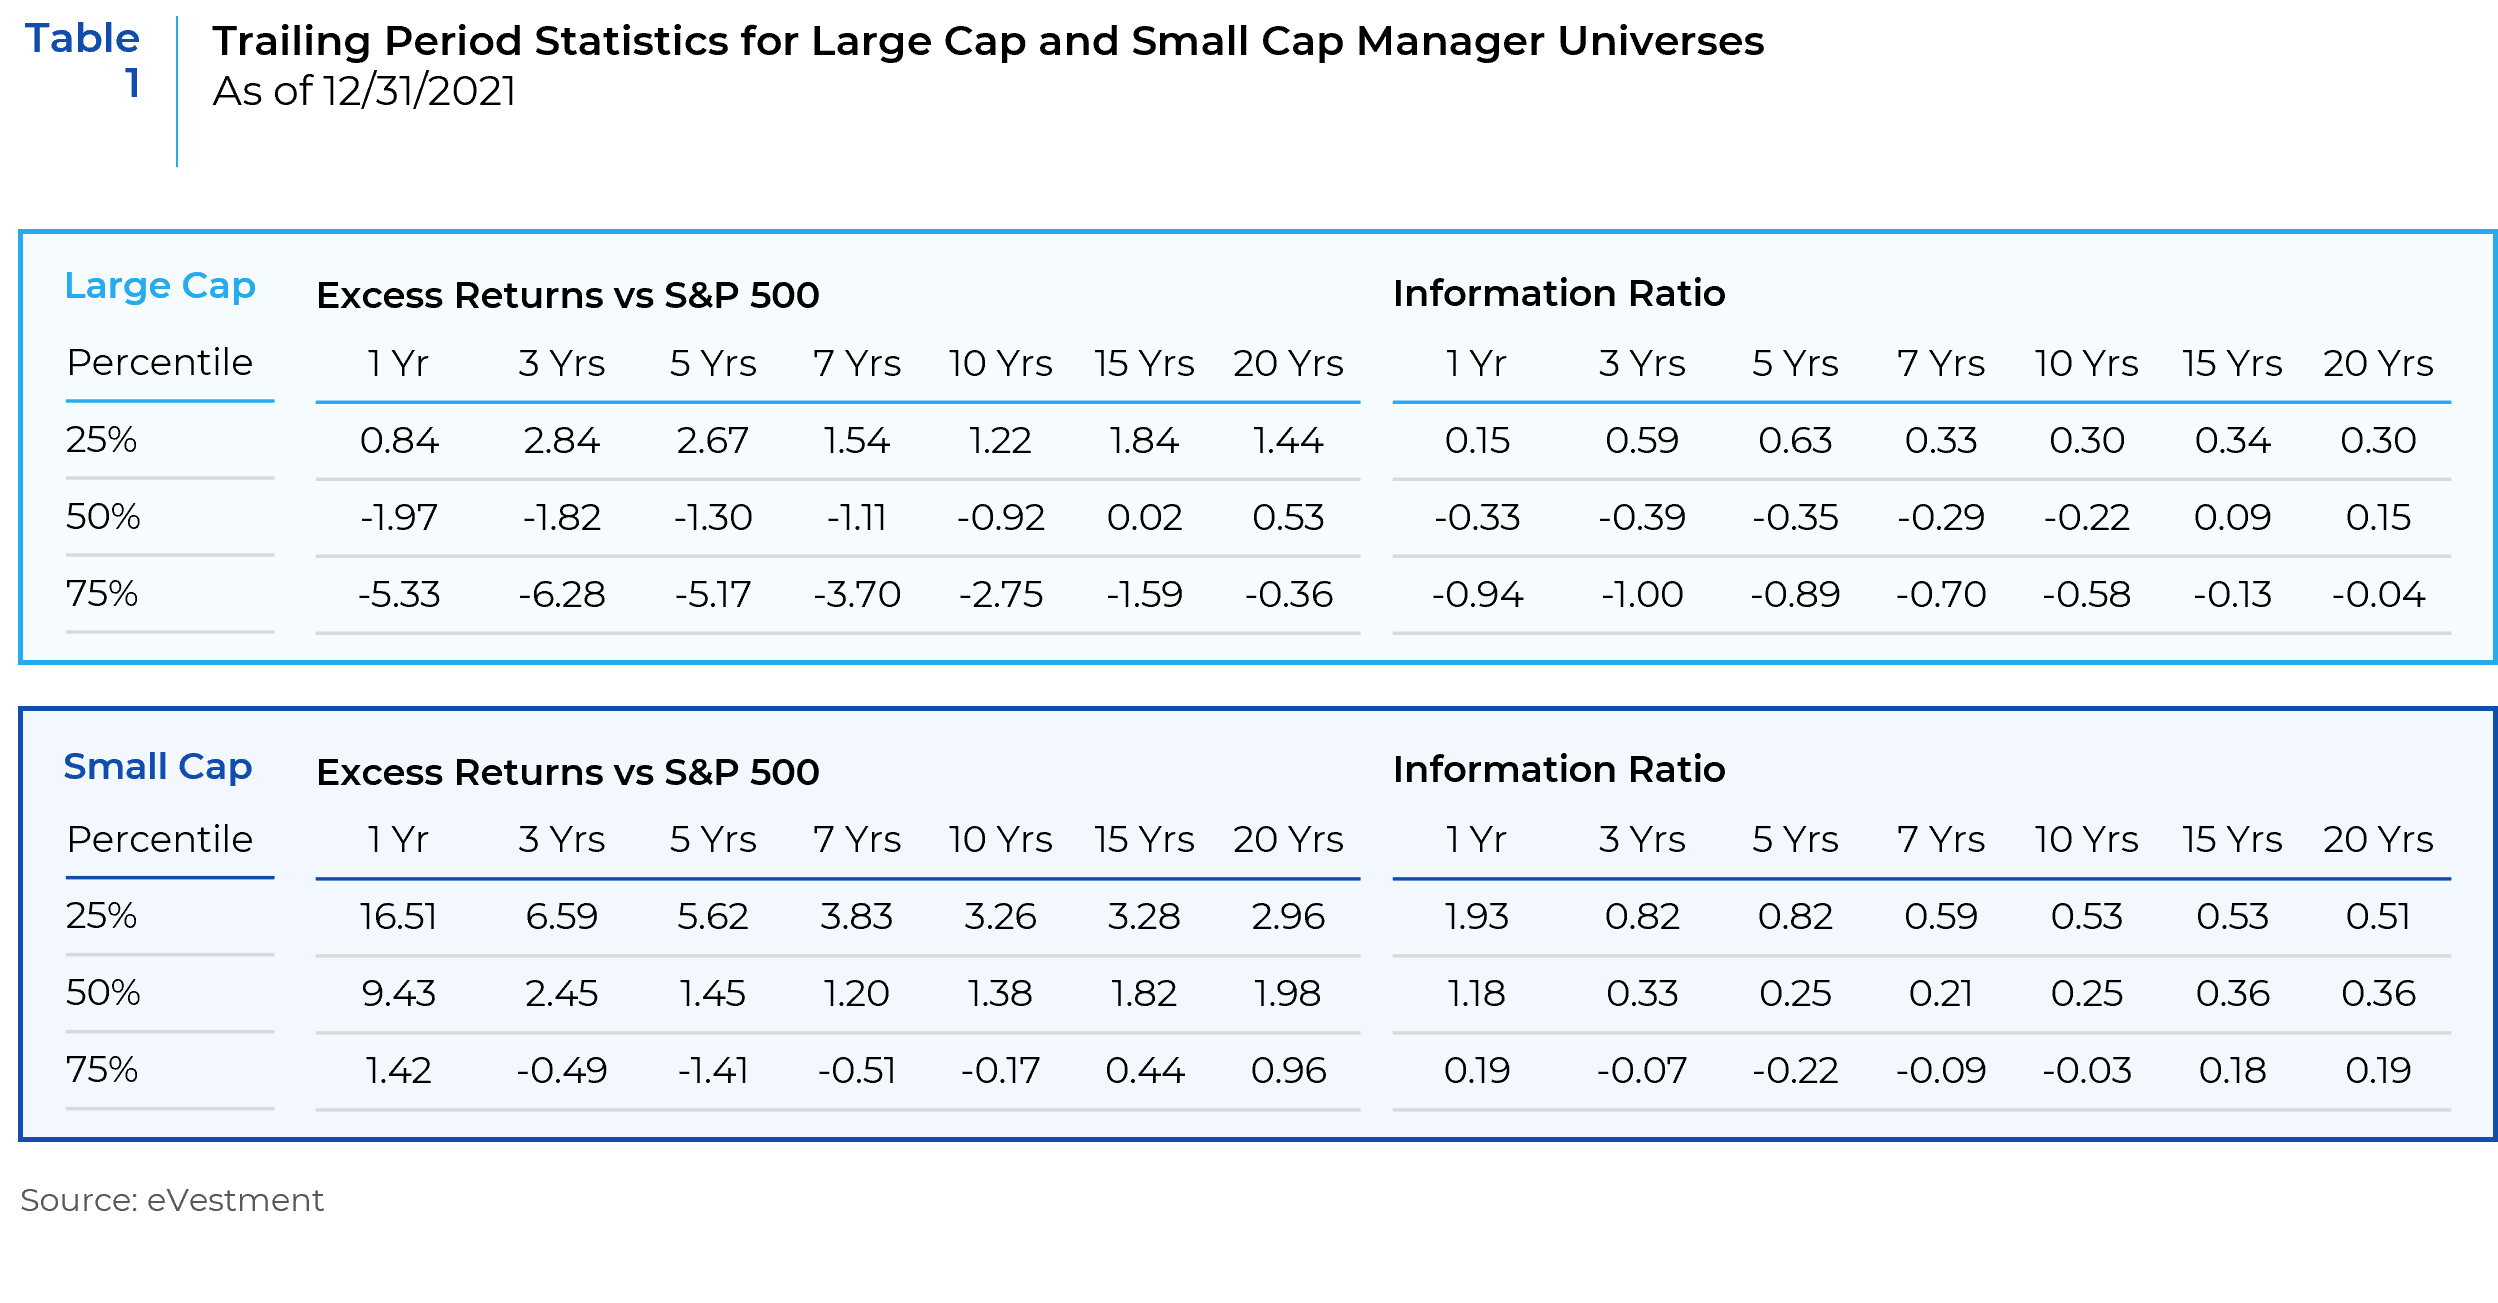
The table below (Table 1) shows the same trend where both excess returns and information ratios for all trailing periods are higher for small cap managers in the 25th, 50th, and 75th percentiles of their universe. The median small cap manager consistently outperformed the Russell 2000 while the median large cap manager failed to outperform the S&P 500 during most of the trailing periods. Similarly, large cap managers in the 75th percentile consistently underperformed the S&P 500 while the small cap managers in the same percentile managed to eke out positive returns and information ratios in several trailing periods.
There are several structural reasons that explain why active management in the small cap market has a higher probability of generating alpha when compared to active management in large cap investment strategies.
Analyst Coverage and Estimate Dispersion
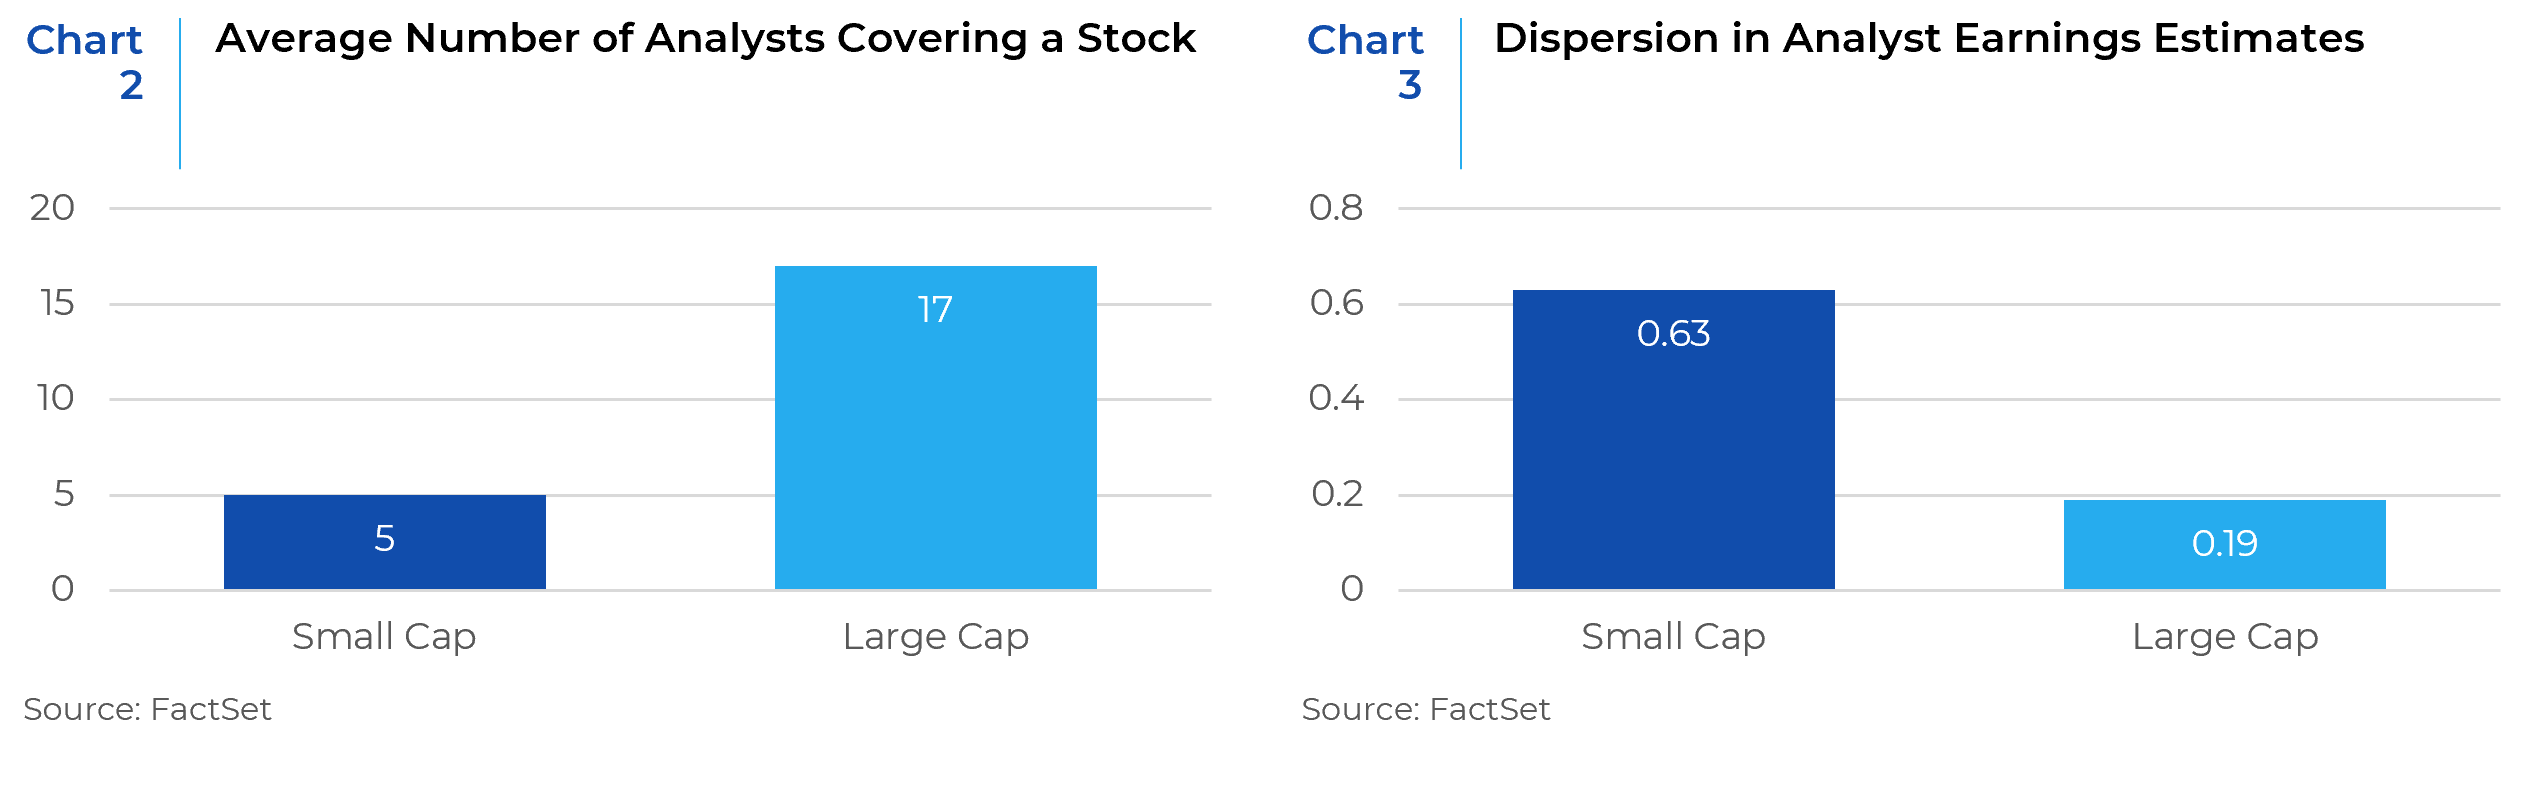
Large cap companies usually have a higher number of analysts covering them (Chart 2) and less dispersion in analyst estimates. Small cap companies, on the other hand, have fewer analysts covering them and much wider dispersion in earnings expectations (Chart 3). Dispersion is measured by the standard deviation of analyst estimates. Low dispersion signals consensus among analysts and decreases the likelihood of reported earnings being significantly different from the earnings expectations incorporated into a stock’s current price. Greater dispersion in earnings estimates creates “noise” around analyst forecasts, points to greater uncertainty around a company’s fundamentals, and increases the likelihood that reported earnings will differ from expectations. This relative lack of information and uncertainty around earnings estimates for small cap companies is more likely to create pricing inefficiencies in the small cap markets and hence better opportunities for alpha generation through good stock selection and active management.
Corporate Activity
As shown below (Chart 4), small cap companies are a popular fishing hole for mergers and acquisitions and they tend to have elevated levels of corporate activity when compared to large cap stocks. The increased level of corporate activity combined with the general lack of information availability for smaller names results in more mispricings in small cap stocks and gives stock pickers an analytical advantage. The high incidence of corporate activity therefore creates another opportunity for alpha generation.

Composition of Benchmarks
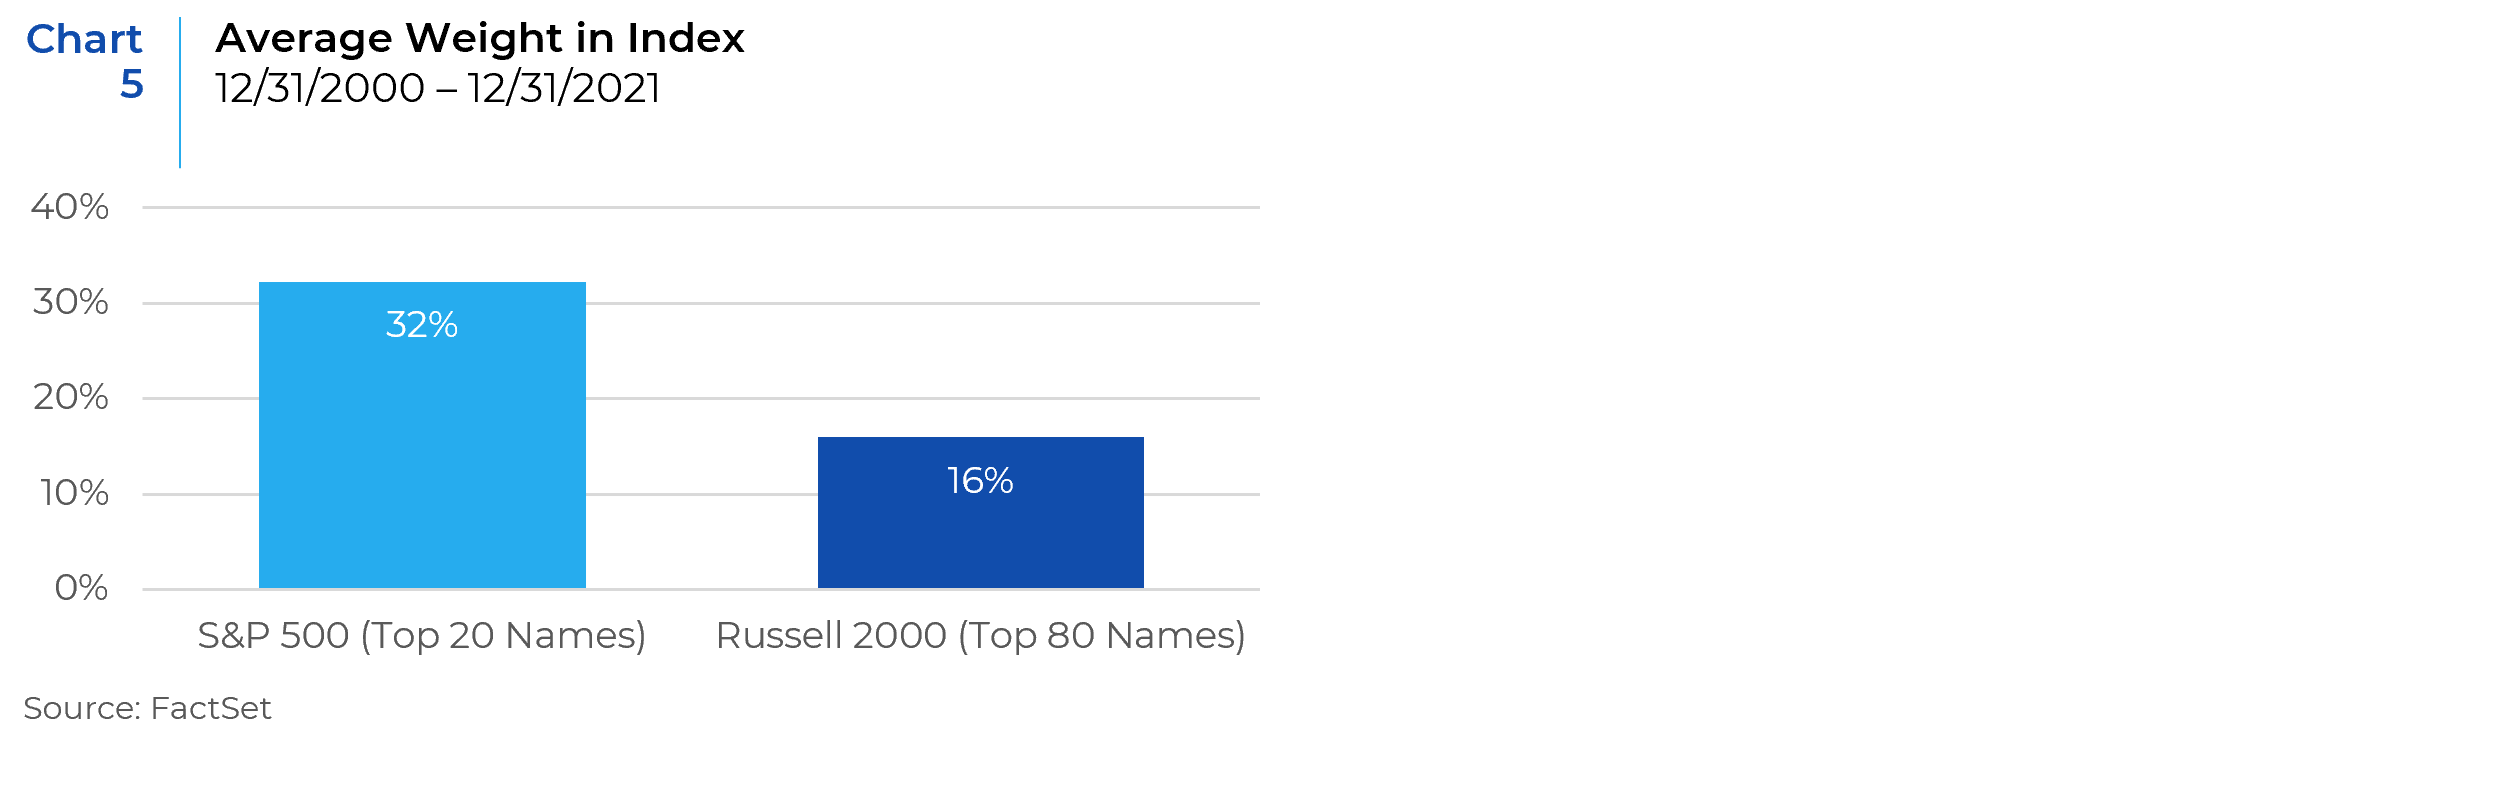
When a large cap benchmark like the S&P 500 is compared to a small cap benchmark like the Russell 2000, the higher concentration of stocks in the former can be clearly observed. As shown in Chart 5, the top 20 names in the S&P 500 have had an average weight of 32% over the past two decades. An equivalent group of 80 names in the Russell 2000 (approximately 4% of the benchmark names) has had an average weight of 16%, half of that of the large cap index, for the same period.
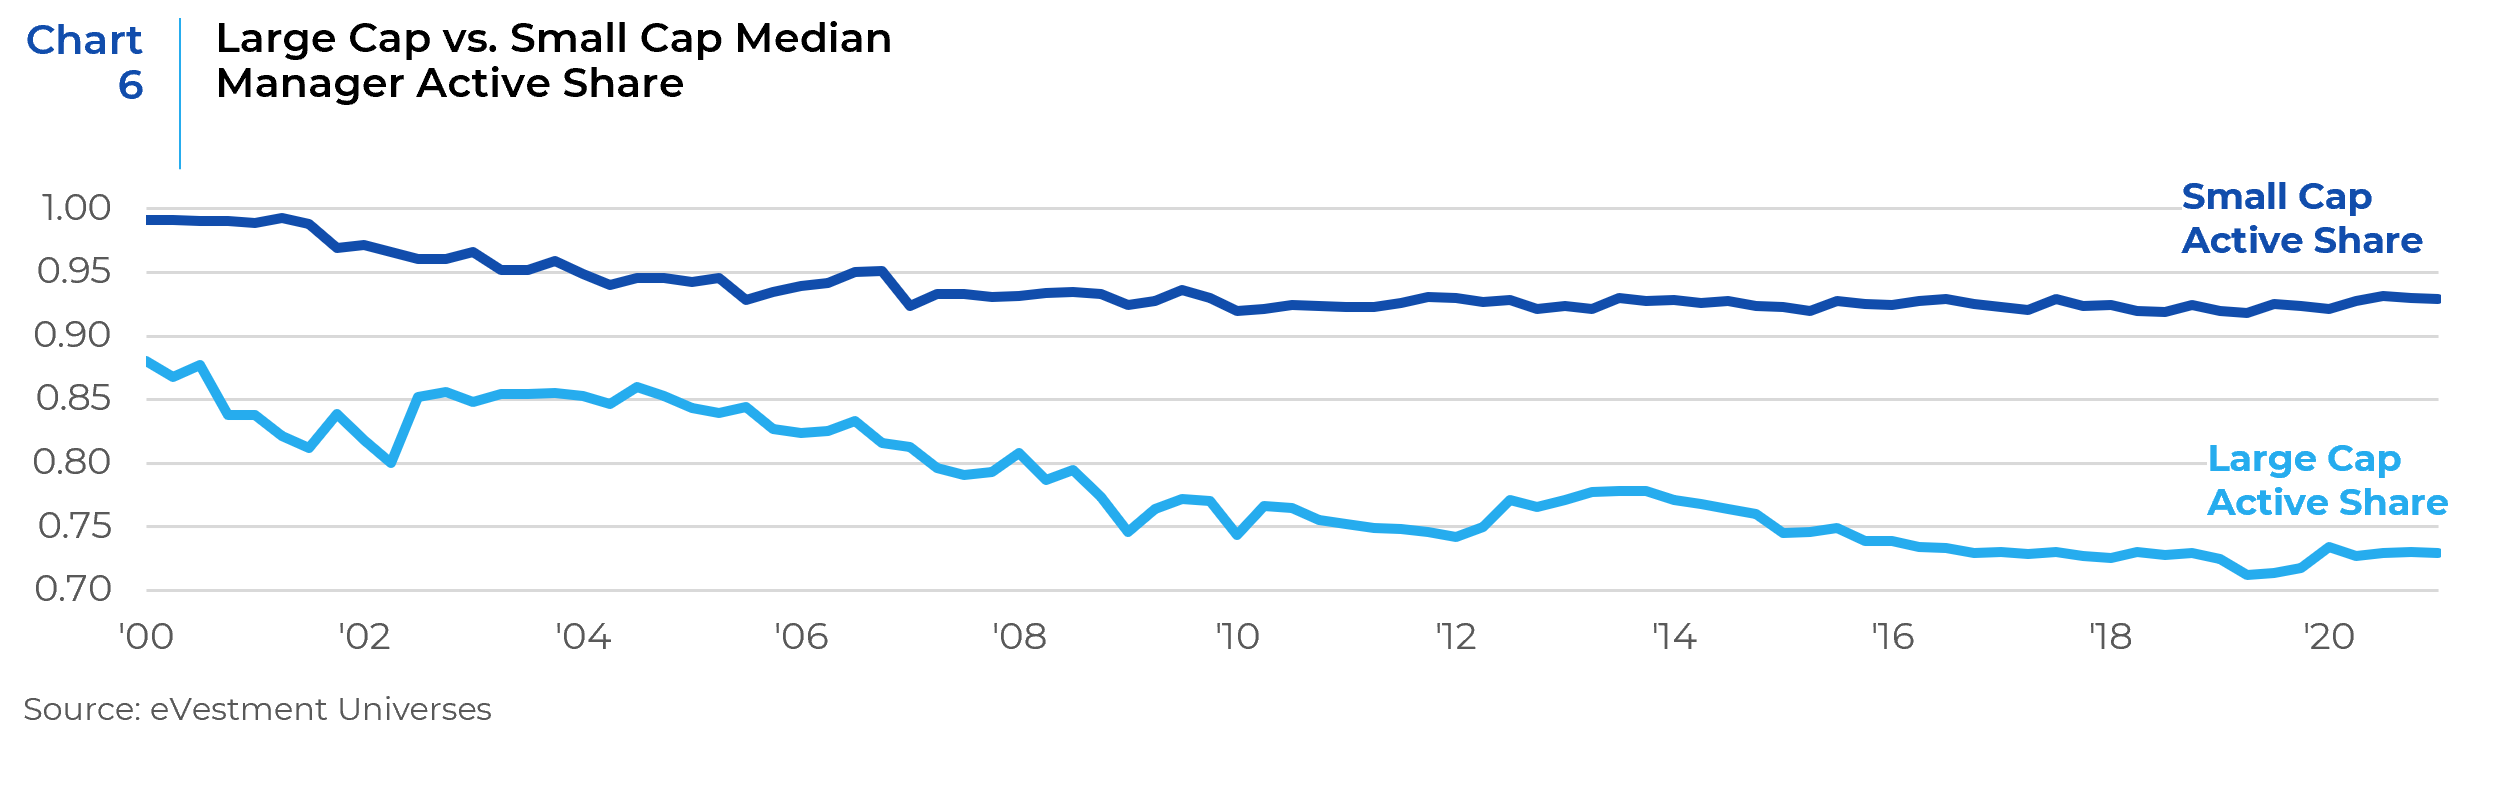
Small cap benchmarks are less concentrated and therefore allow managers to have a higher active share (Chart 6). Active share is a measure of the percentage of stock holdings in a manager’s portfolio that differs from the benchmark index. The higher the active share, the greater the probability of outperforming the benchmark by a significant margin. There is an inverse relationship between the level of concentration and active share in a portfolio. A benchmark that has a high concentration in fewer stocks structurally limits a manager’s ability to generate high active share. In concentrated benchmarks, expressing a bullish view on a position that has a large weight in the index requires the deployment of a good amount of portfolio capital with limited ability to generate high active weight. For example, to initiate a 1.0% active position in Apple Inc. (the largest S&P 500 weight at 12/31/21), it would have required a manager to deploy 7.9% of their portfolio’s capital, including the 6.9% benchmark weight of the stock. Alternatively, to employ the same active weight in the largest Russell 2000 holding, AMC Entertainment Holdings Inc. (0.5% weight), only 1.5% of the portfolio’s capital was required. In addition, in order to maintain risk control, an active strategy may need to hold some of the larger benchmark holdings even if there isn’t a bullish sentiment for those stocks. Large cap indices require more resources to generate meaningful active share because the manager is constrained by a smaller sub-universe of large weight stocks. The opportunity set of securities to initiate active positions in a more efficient manner is larger in a small cap index due to the absence of concentration in a few names.
In conclusion, small cap equities remain a more fertile ground for differentiated stock picking due to a number of structural inefficiencies. These include factors like less analyst coverage, greater dispersion in analyst estimates, more corporate activity, and the composition of small cap benchmarks. The inability of large-cap active managers to consistently outperform a capitalization benchmark such as the S&P 500 has been an important driver of the transition from active to passive investing in the large capitalization space. Alternatively, due in part to the structural drivers that we have identified, active management is more likely to result in outperformance versus a small cap benchmark and therefore should be the preferred investment approach.
References: Elena Ranguelova, Ph.D., Jonathan Feeney, Yi Lu, Ph.D.; July 2015; Under the Radar: Structural Alpha in the Small-Cap Equity Market; Investcorp
This report is neither an offer to sell nor a solicitation to invest in any product offered by Xponance® and should not be considered as investment advice. This report was prepared for clients and prospective clients of Xponance® and is intended to be used solely by such clients and prospects for educational and illustrative purposes. The information contained herein is proprietary to Xponance® and may not be duplicated or used for any purpose other than the educational purpose for which it has been provided. Any unauthorized use, duplication or disclosure of this report is strictly prohibited.
This report is based on information believed to be correct, but is subject to revision. Although the information provided herein has been obtained from sources which Xponance® believes to be reliable, Xponance® does not guarantee its accuracy, and such information may be incomplete or condensed. Additional information is available from Xponance® upon request. All performance and other projections are historical and do not guarantee future performance. No assurance can be given that any particular investment objective or strategy will be achieved at a given time and actual investment results may vary over any given time.