
Although equity markets have been steadily rising, quantitative strategies have found it challenging to beat broad market indices, especially for the past three years. A number of macro catalysts, most notably, the ongoing coronavirus pandemic, have created an unfavorable investment environment for systematic quantitative strategies. The underperformance has been especially pronounced in the U.S. large cap space. This post explores the reasons behind this underperformance and posits that the time for this to abate is near.
Quantitative strategies are most challenged at inflection points in the business cycle. These inflection points are defined by changing trends in economic activity that are caused by a combination of changes in the Fed’s monetary policy and exogenous shocks. When economic growth accelerates strongly, the Fed raises interest rates to control inflationary risks and prevent the economy from overheating. While initially this is helpful to control inflation and an overheated economy, continued tightening by the Fed causes the economy to slow down and the fear of a recession enters the picture. Most times the Fed tries to fine tune its response by increasing rates and then easing again to engineer a soft landing and stop a recession from occurring. These tactics usually succeed for a year or two, but the end result of tightening monetary policy is invariably the onset of recession. As the Fed continues to raise rates, economic growth starts slowing and markets become narrow in nature. There is a scarcity of growth in this slowing environment and investors gravitate towards secular growth companies that appear immune to the business cycle. Around this time, there is usually the bursting of speculative bubbles, like the tech crash in 2000 and the financial crisis of 2008. Economic uncertainty is the hallmark of these inflection phases which are also characterized by extreme divergence in the performance of style, sectors, and stocks. It is in this environment that well diversified, risk controlled systematic strategies are challenged. Once the Fed starts easing aggressively again and the aftermath of the prevailing economic shock clears, there is a resumption of broad-based growth, equity markets stabilize, and systematic strategies find stable ground again. As shown in Charts 1 and 2, during inflection periods, a lower percentage of quantitative managers outperform a broad market index like the S&P 500.
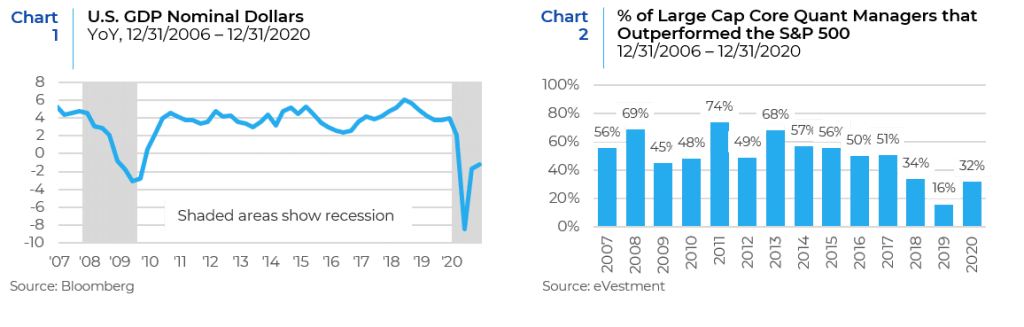
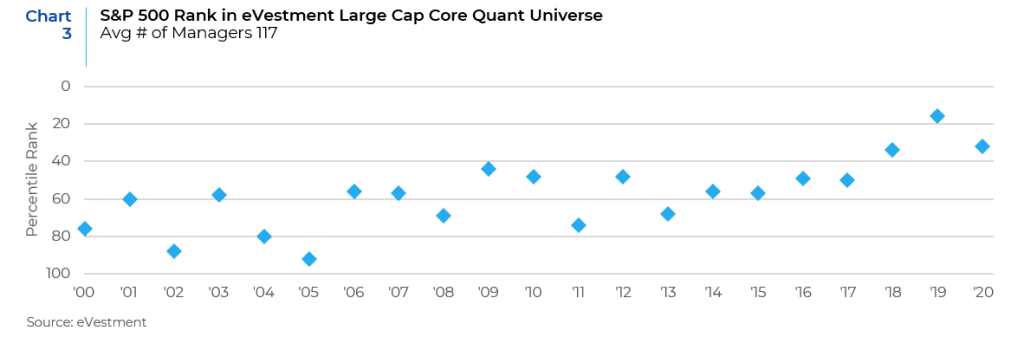
Chart 3 shows the high rank of the S&P 500 index in this universe underscoring the fact that diversified systematic strategies that use multifactor models have a tough time beating a broad benchmark where performance is dominated by a small group of names.
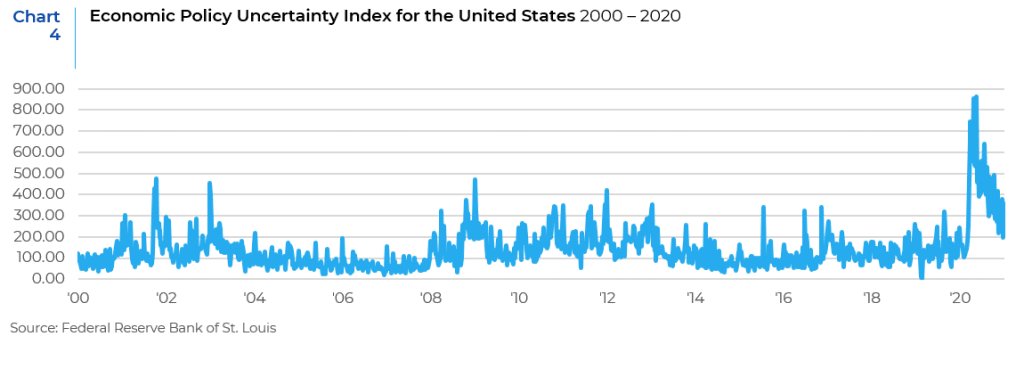
Historically High Levels of Economic Uncertainty
Inflection periods are always marked by economic uncertainty. Policy uncertainty is a class of economic risk where the future path of government policy is uncertain, raising risk premia and leading businesses and individuals to delay spending and investment until this uncertainty has been resolved. Policy uncertainty may refer to uncertainty about monetary or fiscal policy, the tax or regulatory regime, or uncertainty over electoral outcomes that will influence political leadership. In the unusual environment that we are currently facing, a combination of all these uncertainties are impacting markets.
The Fed first started raising rates in December of 2015, followed by another raise in 2016, and 3 raises in 2017. The tightening continued in 2018 with 4 more raises that caused equity markets to post steep losses and market uncertainty spiked up. In order to prevent growth from slowing down and stabilize equity markets, rates were eased 3 times in 2019. A soft landing could have been possibly engineered in 2020 if not for the health crisis sparked by the coronavirus pandemic. With the onset of recession in 2020, which also happens to be a Presidential election year, the Economic Policy Uncertainty Index touched new peaks.
Dominating Performance of Large Cap Growth Stocks
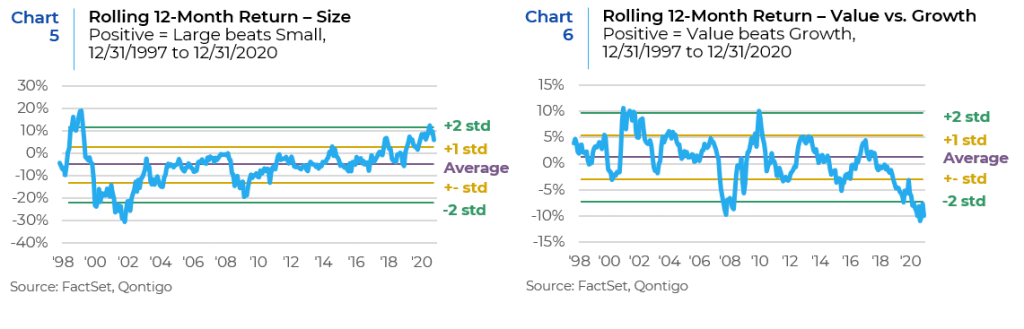
Since the Great Financial Crisis, there has been an increasing dispersion in the performance of stocks by size and style. This divergence between large cap stocks versus small cap stocks and between value and growth stocks has picked up steam since the end of 2017. In 2020, the performance of large caps versus small caps reached more than 2 standard deviations from the mean. This is even more pronounced when we compare value versus growth stocks. These are extreme disparities that are not sustainable over the long term. A reversion to the mean is bound to happen once there is a resumption of broad-based economic growth and equity markets normalize. However, the extreme performance disparities in size and style as seen in the current environment make it more difficult for diversified portfolios to outperform a broad benchmark.
Narrow Sector Performance
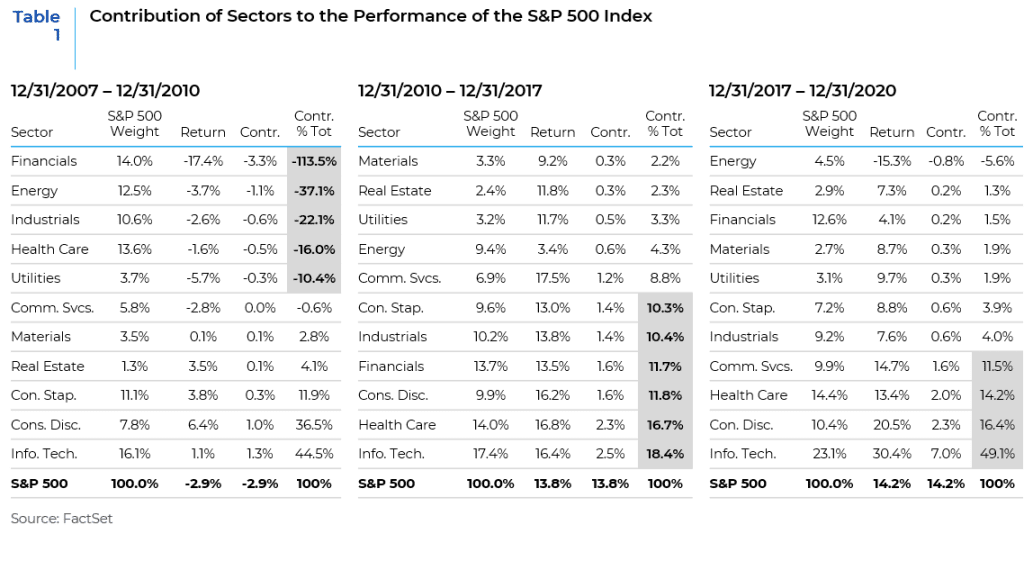
Viewed through the lens of sector performance, we again see a concentration of returns. At points of inflection we find that a few sectors, and specifically a few industries within these sectors, contribute most of the market’s return, whether positive or negative. For example, in the 2007-2010 period, the banks pulled down returns the most and since 2017, the biggest technology names have driven market performance higher, as shown in the next section. Having big overweight or underweight positions in those sectors can determine the relative return of the portfolio. This becomes a constraining factor for well diversified core portfolios that have small sector bets and own names across the broad benchmark. For example, in the 2008 GFC, big underweights in the Financials and Energy sectors would have allowed a portfolio to beat the S&P 500 and even post positive absolute returns. Similarly, in the current period, big over weights in Information Technology, Consumer Discretionary (Amazon Inc. to be more specific), and Communication Services would have enabled a portfolio to beat the high performing S&P 500 Index. But again, these kinds of skews would have violated risk and investment guidelines of a diversified core strategy.
S&P 500 Index Concentration at Record Levels
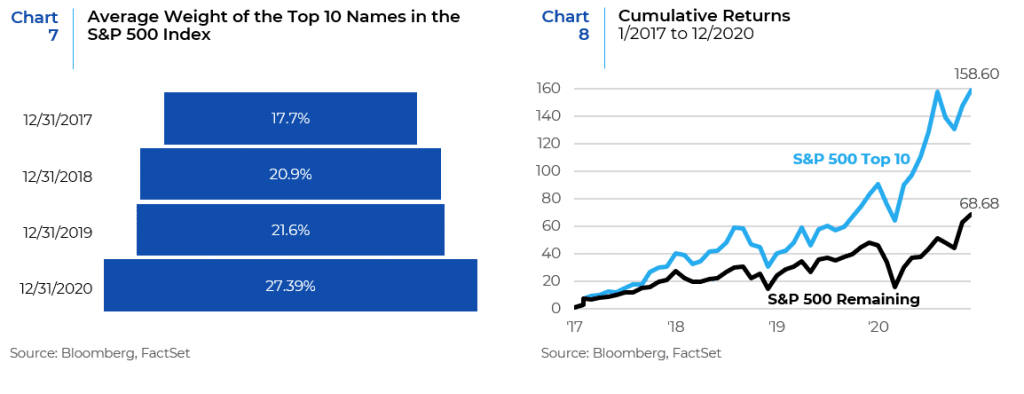
Since 2017 the S&P 500 has been gradually increasing its concentration in the highest weighted names in the index. The return disparity between the 10 largest stocks and the remaining names in the index has also grown with time. Leading into the coronavirus pandemic, equity markets had been propped up by a handful of mega-cap growth names like Microsoft, Apple, Amazon, Netflix, Alphabet (Google), and Facebook. These companies in the S&P 500 Index have accounted for over 20% of its total market capitalization since 2018, exceeding the 18% concentration level reached during the dot-com bubble. Charts 7 and 8 show the increasing weight of the top 10 names in the S&P 500 index and their corresponding dominant role in contributing to the returns of the index.
The implication of this trend for portfolio construction provides an interesting perspective. Continuing the theme of comparing the 10 largest names to the remaining companies in the index, Table 2 provides a summary of active risk predictions along with the risk factor exposures of the two portfolios for the past several years. The post Covid-19 increase in equity market and risk factor volatility has resulted in a sharp rise in the predicted tracking error of both portfolios since year-end 2019. At 12/31/20, a portfolio in the top 10 names had a tracking error of 12.42% vs. the S&P 500, well beyond the typical investment guidelines for diversified active managers.
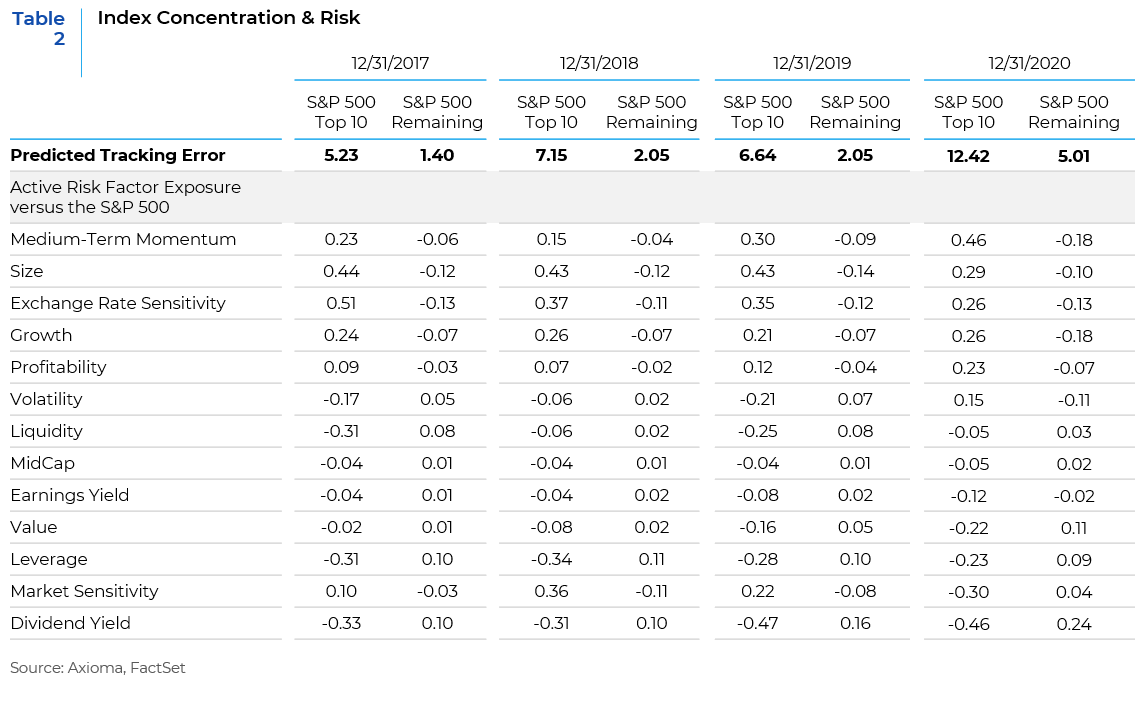
The chart also highlights the inherent factor biases of the top 10 companies versus the remaining names. In addition to the expected overweight exposure to Size (Large Cap), the portfolio has a positive exposure to Momentum, Growth and Profitability when compared to the remaining S&P 500 companies. Alternatively, the top 10 companies are underexposed to value factors like Dividend Yield, Value (Price/Book), and Earnings Yield, and Leverage. This has been a consistent trend over the period shown. The risk factor positioning of the two portfolios and their large divergence from each other creates a skewness in the markets that is hard to bridge using a well-diversified portfolio.
The extreme levels of index concentration that we are witnessing today have important implications for portfolio construction as discussed above. To outperform the S&P 500 Index, portfolios will need to be less diversified and riskier. Overweighting the highly concentrated portfolio consisting of the 10 biggest names in substantial margins would be the path to outperforming the index. That in turn would lead to a violation of portfolio guidelines.
Underperformance of Multi Factor Strategies
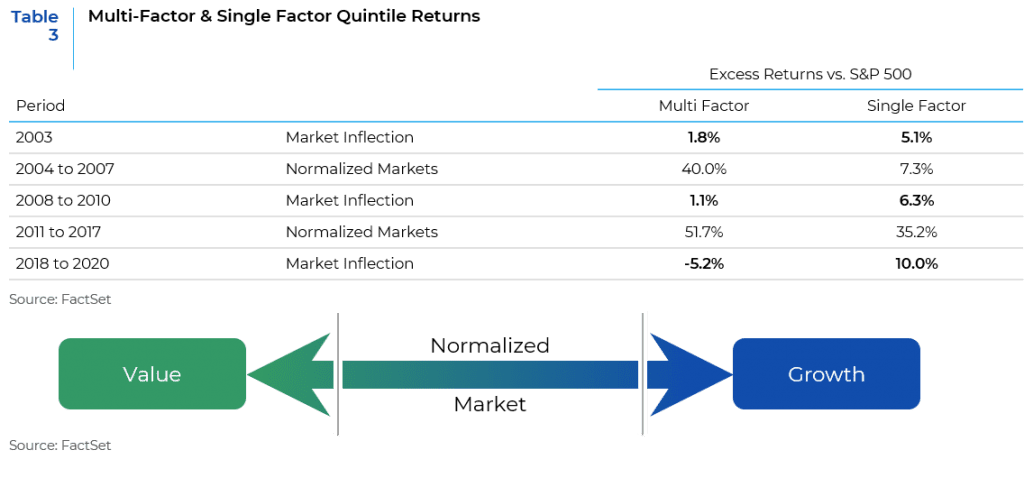
Another illustration of skewness at points of inflection comes from looking at the performance of stocks in the top quintile when ranked by attractiveness by a single factor like value, momentum, and quality versus the performance of top quintile stocks using a multifactor ranking system. At every point of inflection there is dominance of one or two factors and that allows single dimensional stocks to do better than those names that have an attractive multi-dimensional profile. The latter category of stocks are the ones that perform better in normalized markets and that would be highly ranked in most multifactor quantitative strategies. For example, stocks with reasonable valuations, clear earnings visibility, and good quality would rank higher than stocks with only one of these characteristics. However, that approach is challenged when markets are going through a transition and a period of turmoil.
For Performance of Systematic Strategies
The obvious question confronting us is that when will the underperformance of quantitative strategies abate and when will these strategies turn the corner? Fortunately, these periods of extremities tend to be sharp but short. While it is impossible to predict the exact point at which we will see this turn, it can be reasonably imputed that this is likely to happen by the middle of 2021 provided there isn’t another exogenous shock to the economy and markets. Given that we are dealing with a health crisis of unprecedented proportions it is more difficult to estimate when systematic strategies will find their footing again. However, in the past few months we have already started seeing some early signs of normalization as the disparities between growth and value, between large and small, and between defensive and cyclical areas of the market have lessened. The time is at hand for markets to start normalizing and for a significant improvement in the relative performance of multifactor strategies.
This report is neither an offer to sell nor a solicitation to invest in any product offered by Xponance® and should not be considered as investment advice. This report was prepared for clients and prospective clients of Xponance® and is intended to be used solely by such clients and prospects for educational and illustrative purposes. The information contained herein is proprietary to Xponance® and may not be duplicated or used for any purpose other than the educational purpose for which it has been provided. Any unauthorized use, duplication or disclosure of this report is strictly prohibited.
This report is based on information believed to be correct, but is subject to revision. Although the information provided herein has been obtained from sources which Xponance® believes to be reliable, Xponance® does not guarantee its accuracy, and such information may be incomplete or condensed. Additional information is available from Xponance® upon request. All performance and other projections are historical and do not guarantee future performance. No assurance can be given that any particular investment objective or strategy will be achieved at a given time and actual investment results may vary over any given time.