
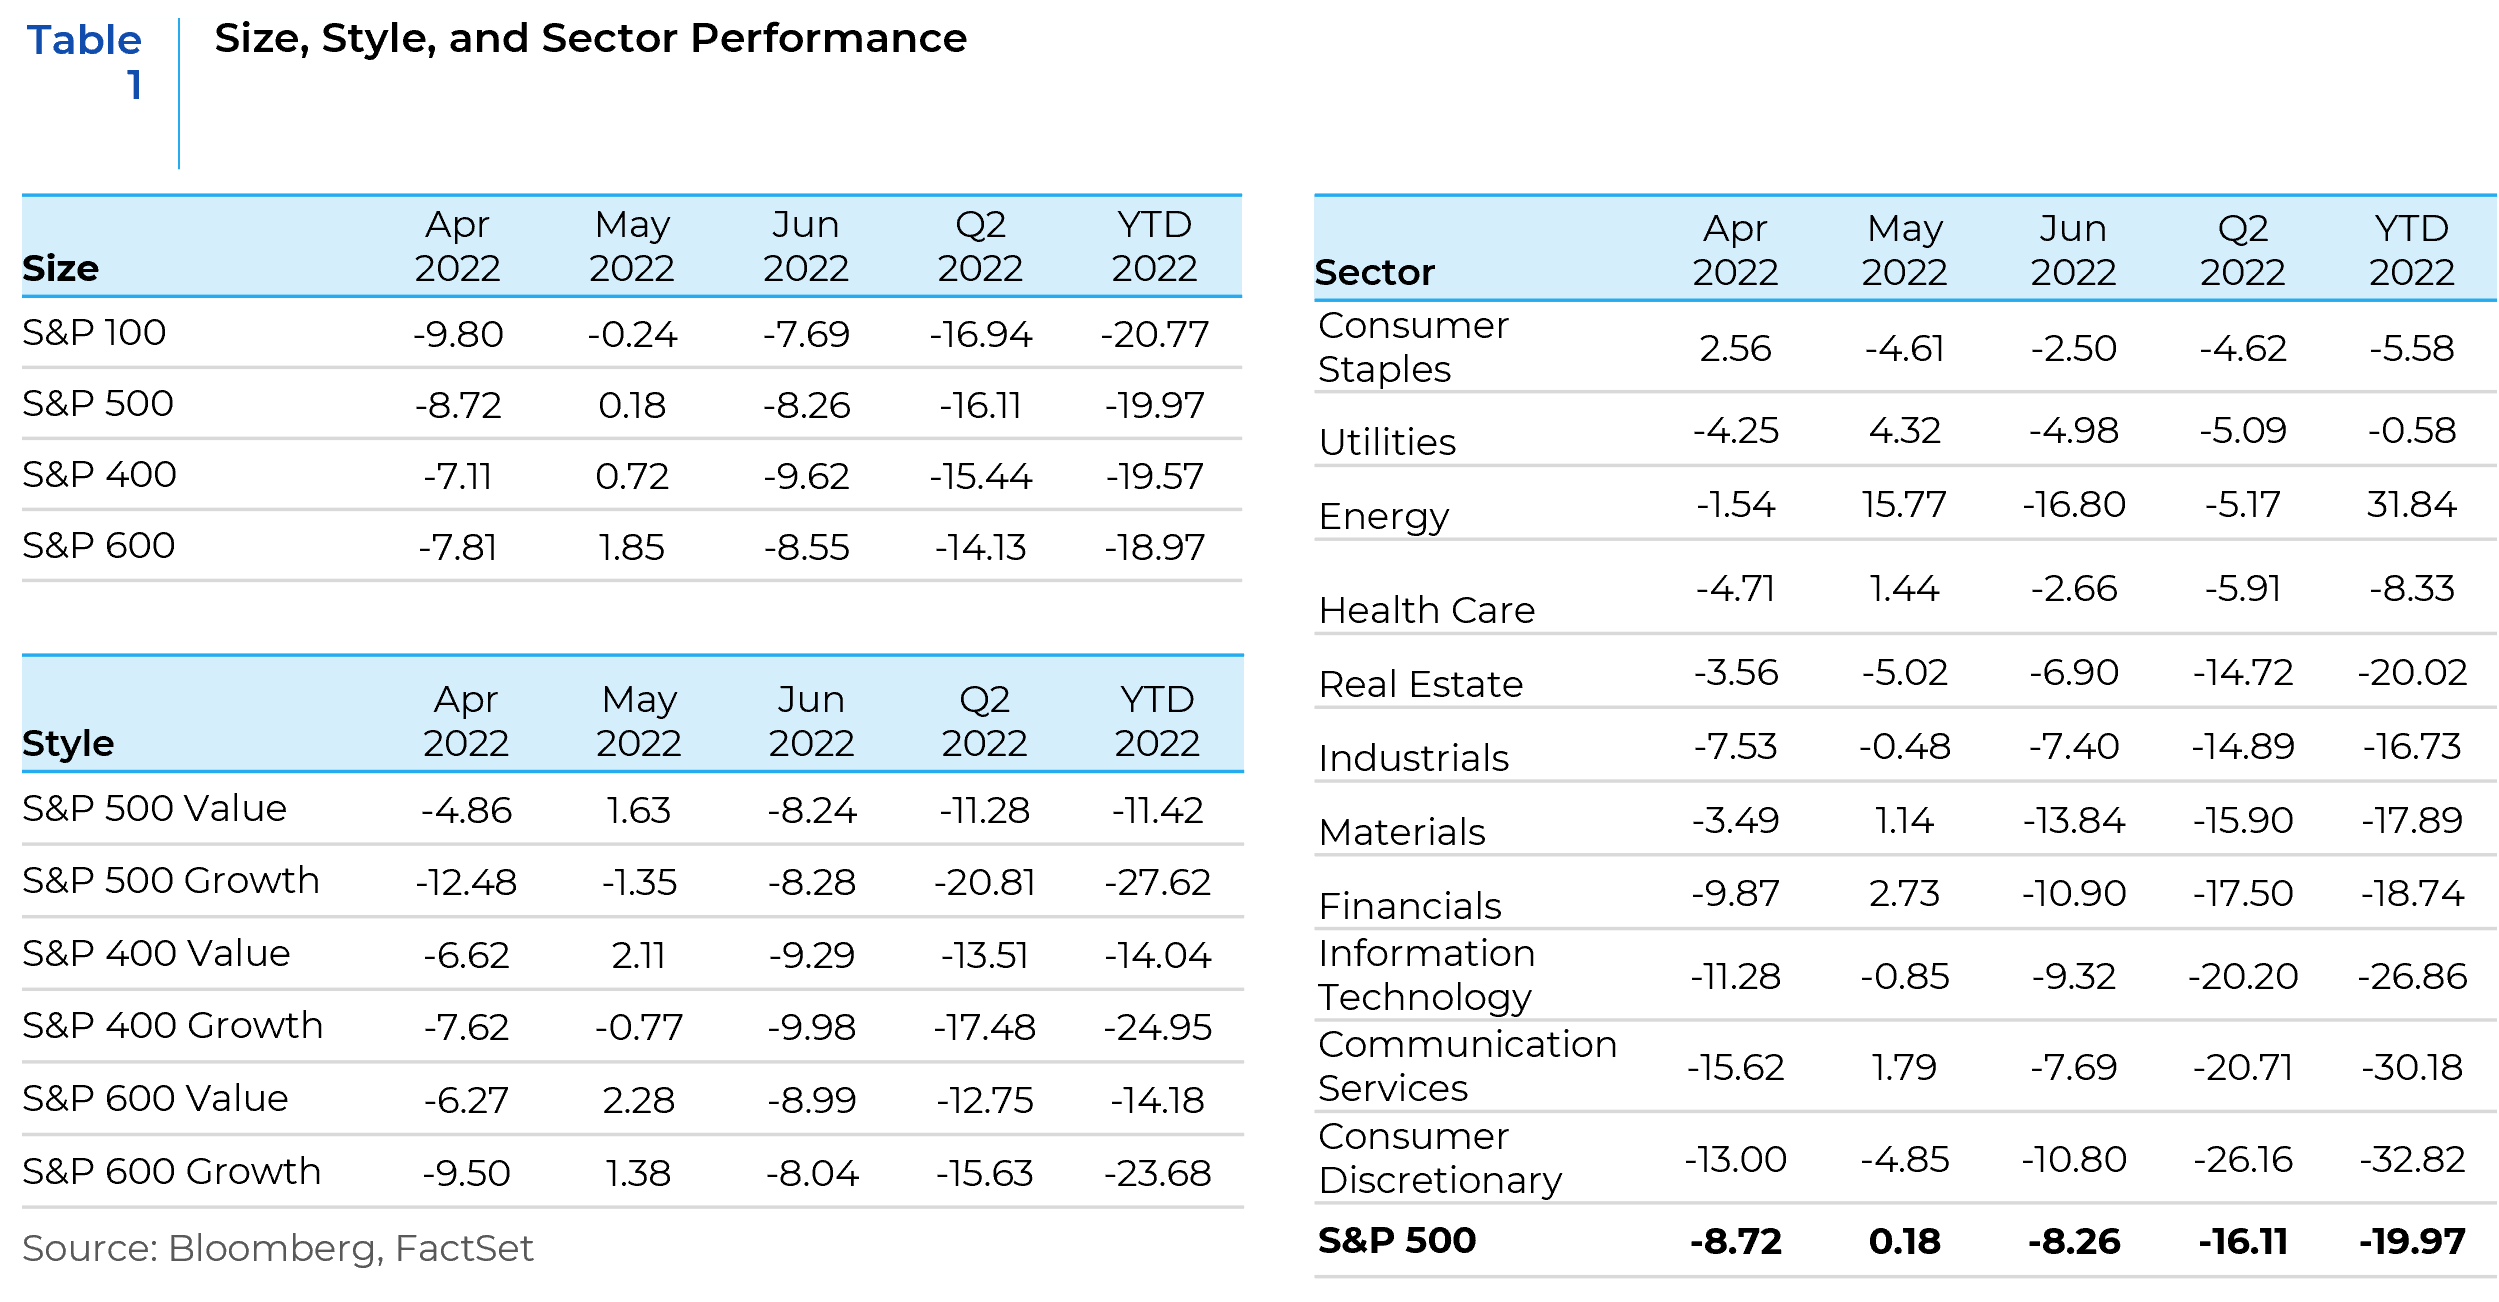
Market Review
The second quarter of 2022 saw equity markets finish lower for a second straight quarter. The decline in the S&P 500 in the first half of 2022 has been the largest since 1970. Inflation concerns were the biggest drag on risk sentiment in the second quarter. May headline CPI came in hotter than expected at a 1% increase month over month and an 8.6% increase year over year, the biggest annual increase since late 1981. Surging fuel and food prices were key upside drivers with geopolitical developments exacerbating the pressure. The Fed’s focus on inflation led to a more aggressive pace of rate hikes with a rate increase of 50 basis points in May and 75 basis points in June. Tightening financial conditions drove concerns about a growth slowdown with the Atlanta Fed GDPNow model estimating -1% growth for the second quarter following the -1.6% print in the first quarter. Growth concerns were also exacerbated by the widespread lockdowns in Shanghai related to China’s strict adherence to a zero COVID policy. While the drawdowns in equity markets were driven by multiple compression, a combination of slowing growth, tightening financial conditions, input price and supply chain pressures, and waning consumer sentiment drove a meaningful pickup in concerns about the downside risk to consensus earnings estimates. Investor sentiment was downright pessimistic as the first half of 2022 ended and the second half began amidst an environment of economic uncertainty.
Market Outlook
After a dismal first half, investors are starting the third quarter of 2022 with some of the same concerns in mind that kept them awake at night in the second quarter. The economic uncertainties have evolved, and some market trends have changed when compared to the last quarter. It is an unusual environment where inflation is rising, the Fed is raising rates, the job market continues to be somewhat resilient, earnings estimates remain positive, and yet there is talk of stagflation and recession. We discuss these themes and the associated investment implications in this mid-year write-up.
Inflation is Here to Stay
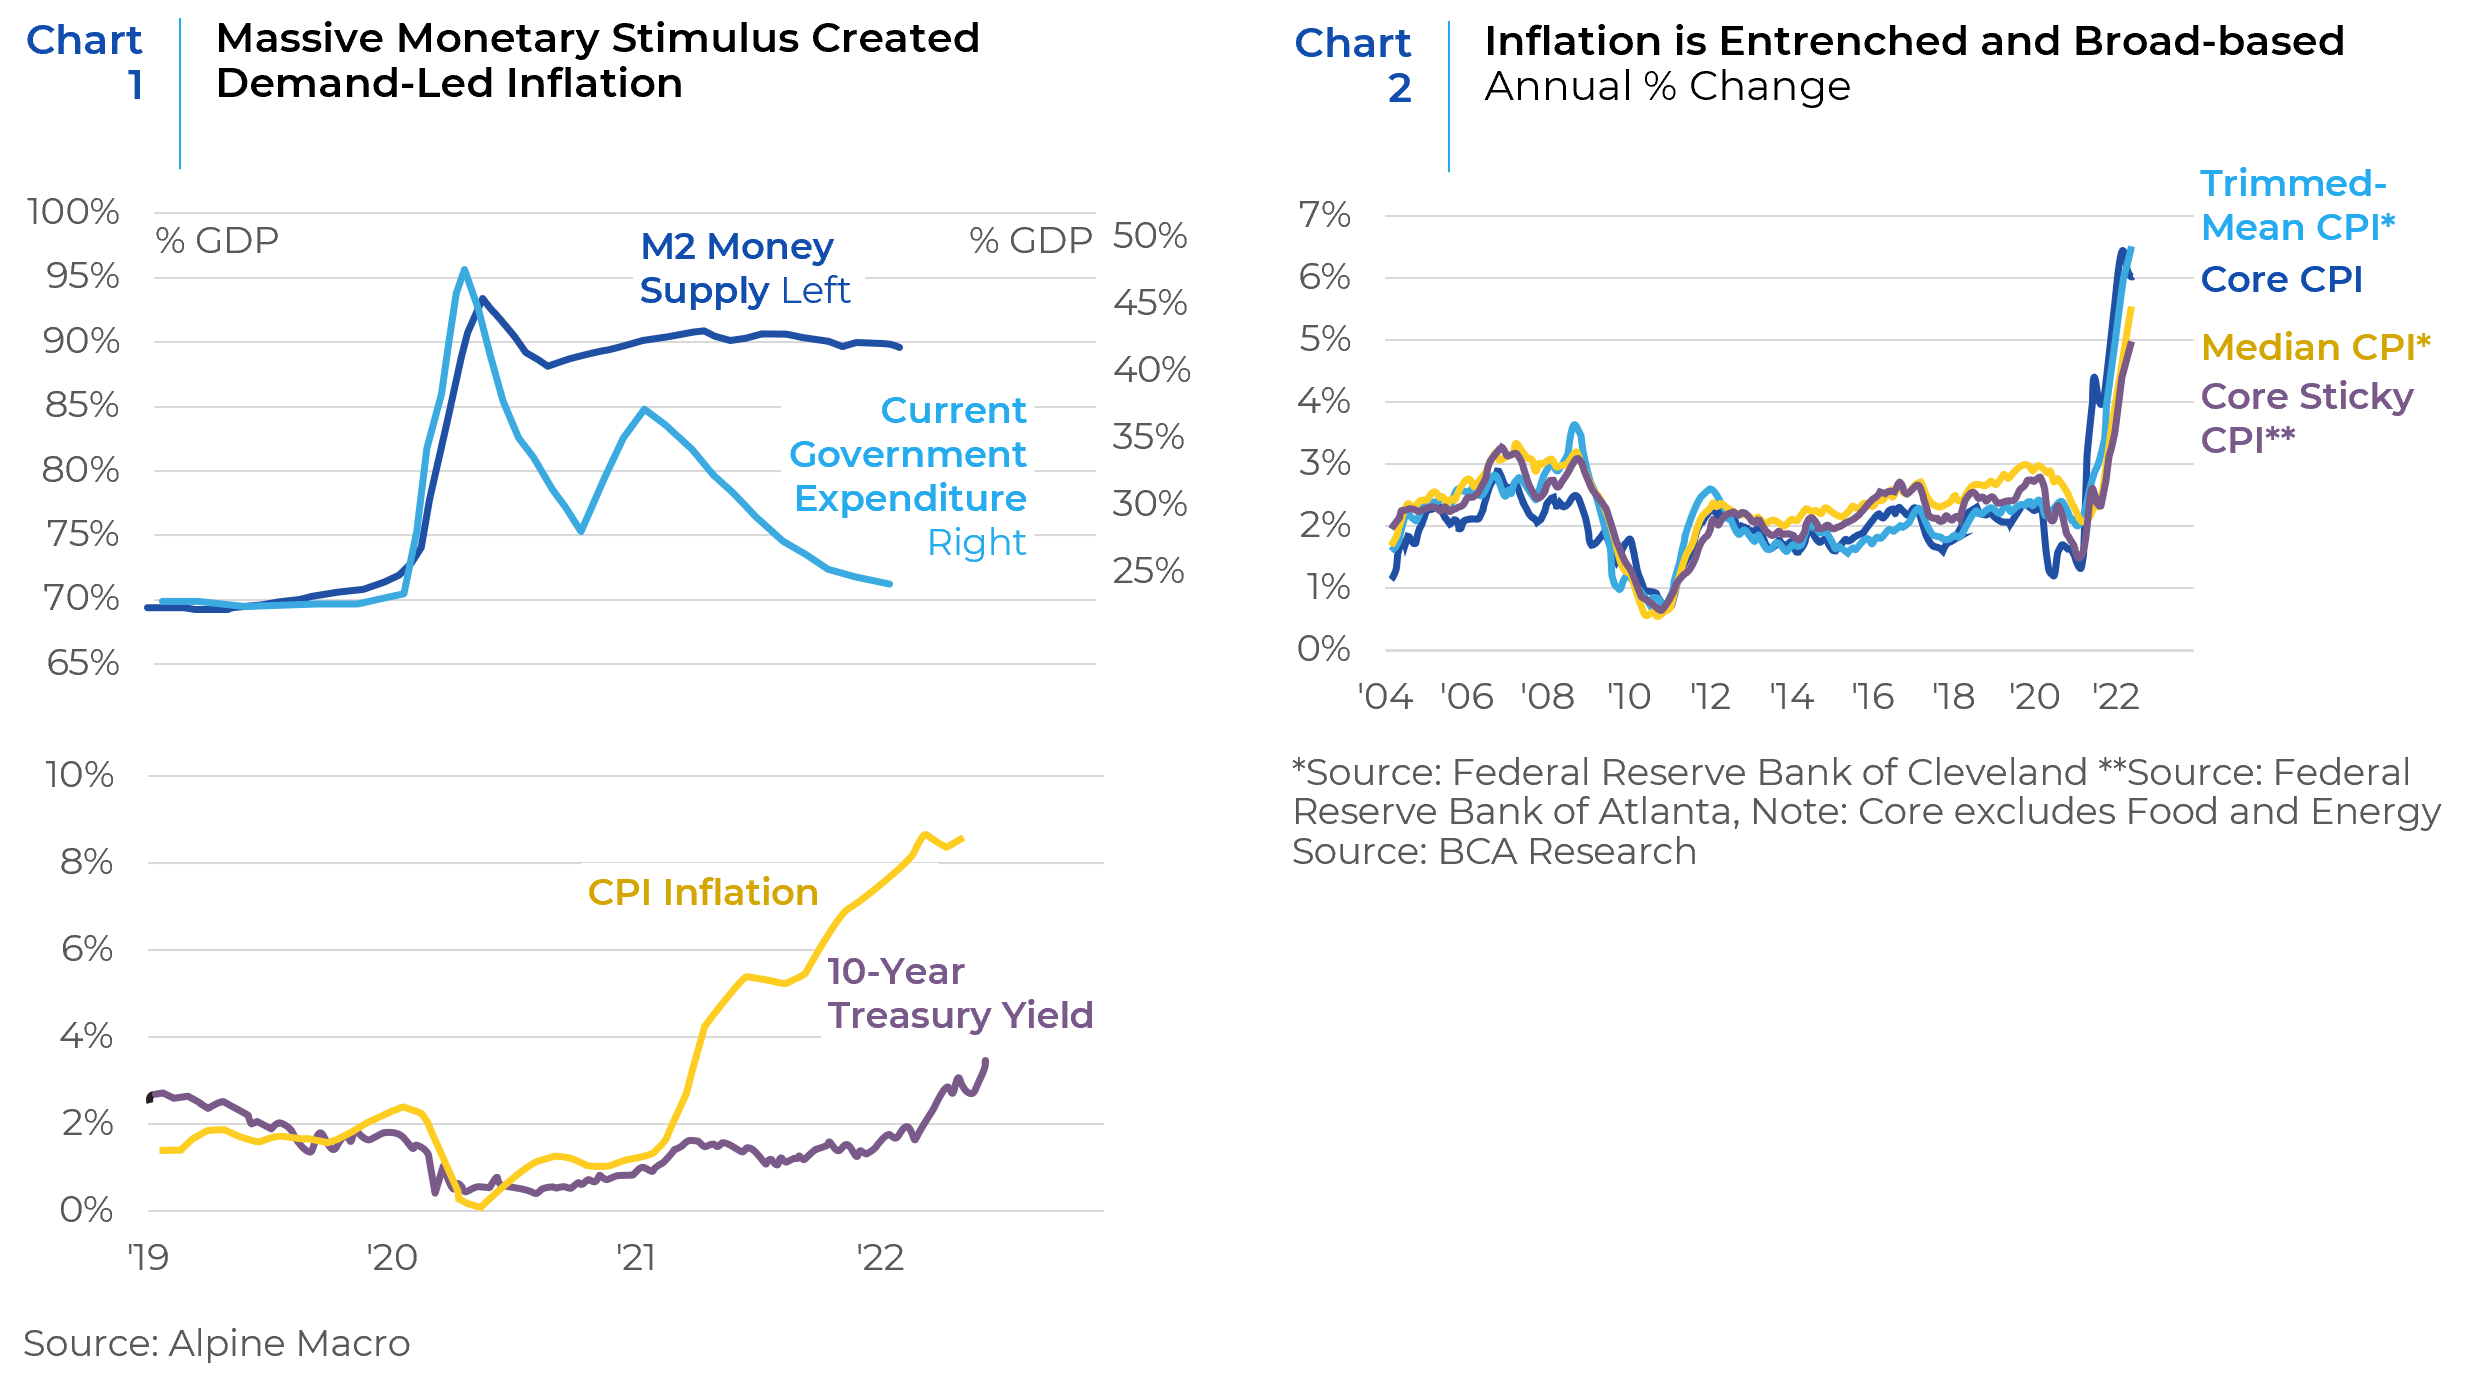
Inflation is a simple consequence of an imbalance between supply and demand. If demand exceeds supply, prices rise until balance is restored. The initial surge in inflation was caused by supply bottlenecks resulting from disruptions related to COVID lockdowns and the Russia-Ukraine war which was compounded by goosed up demand for goods (during lockdowns) and services (post lockdowns) which was buoyed by aggressive monetary and fiscal stimulus (Chart 1). Inflation forecasts initially underestimated the lasting impact of inflation believing that it would most likely be “transitory.” However, forecasts were ratcheted up sharply at the beginning of this year when realization dawned that inflation was more entrenched than estimated previously (Chart 2).
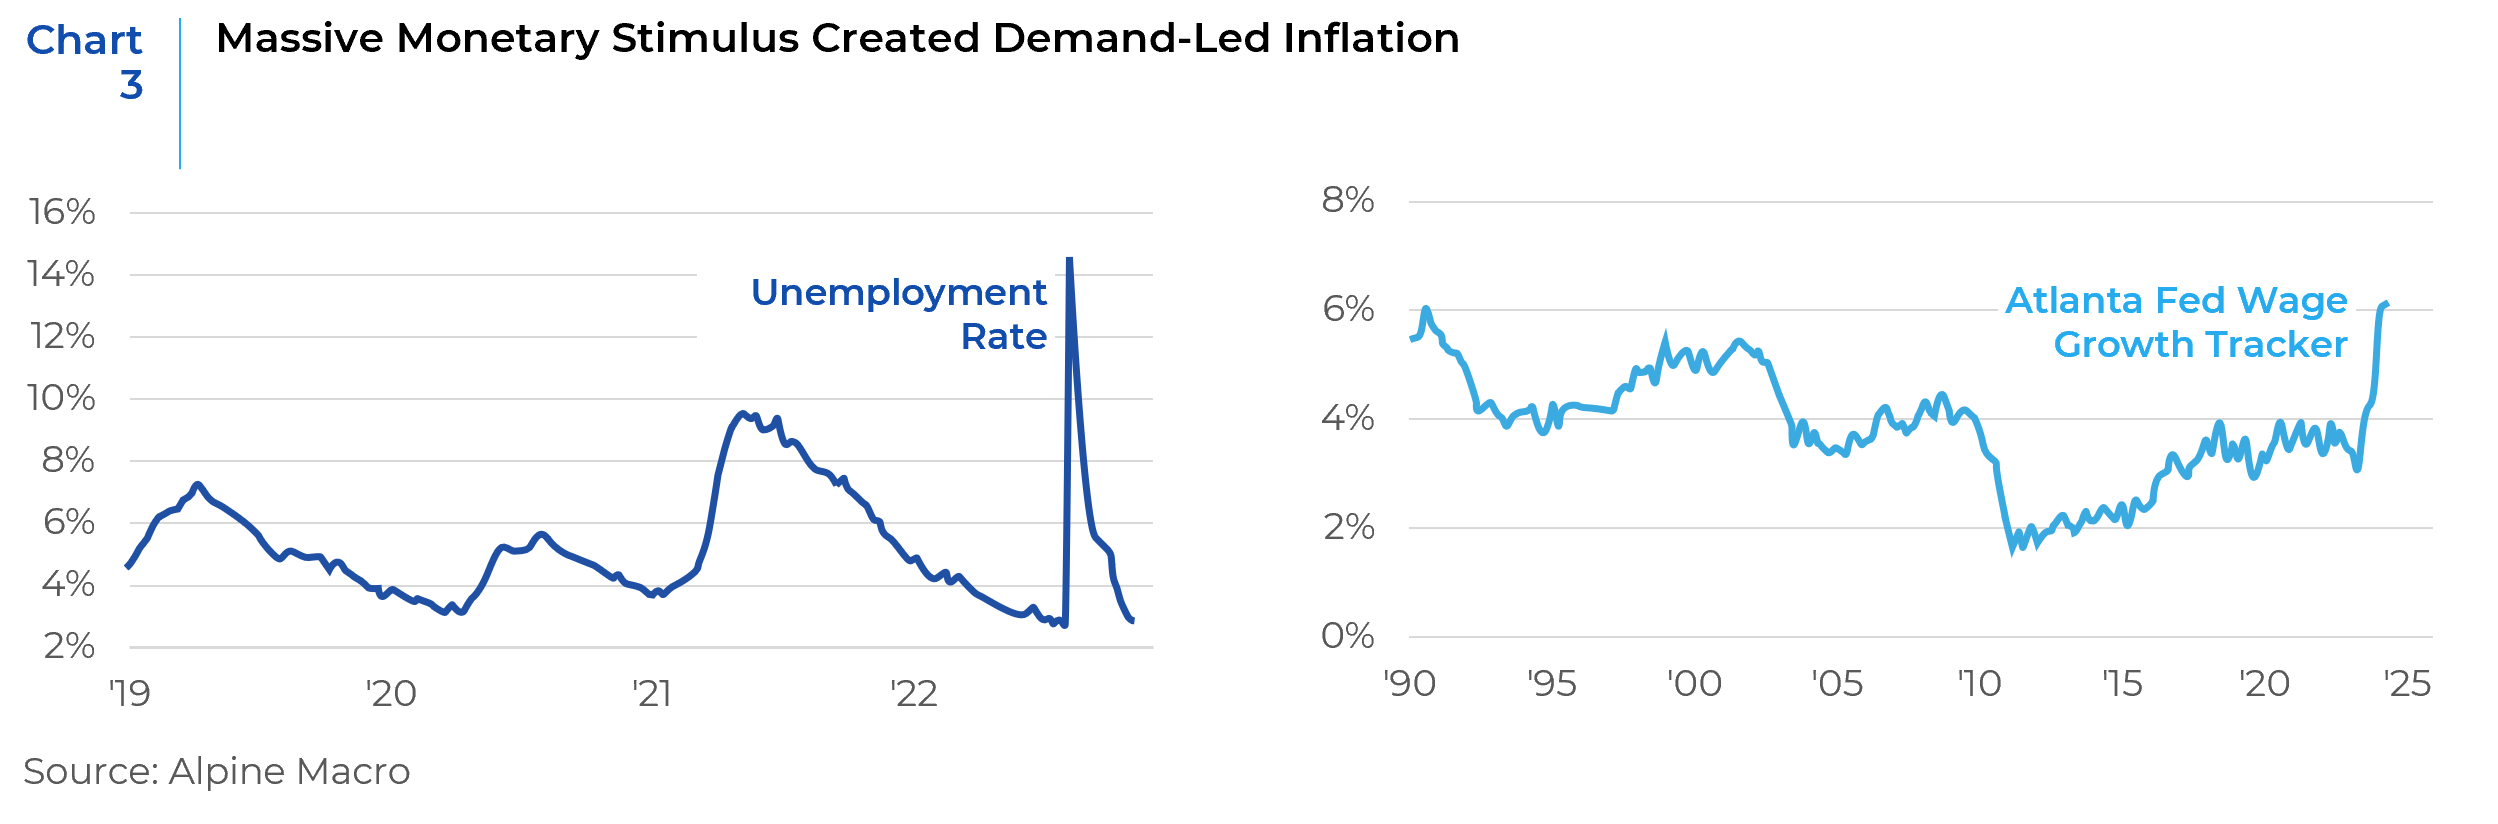
Inflationary momentum may not abate soon, even though supply bottlenecks are easing. The labor market is potentially another source of inflation. Although labor force participation has not increased substantially, unemployment rates remain low amidst a steady increase in wage growth (Chart 3).
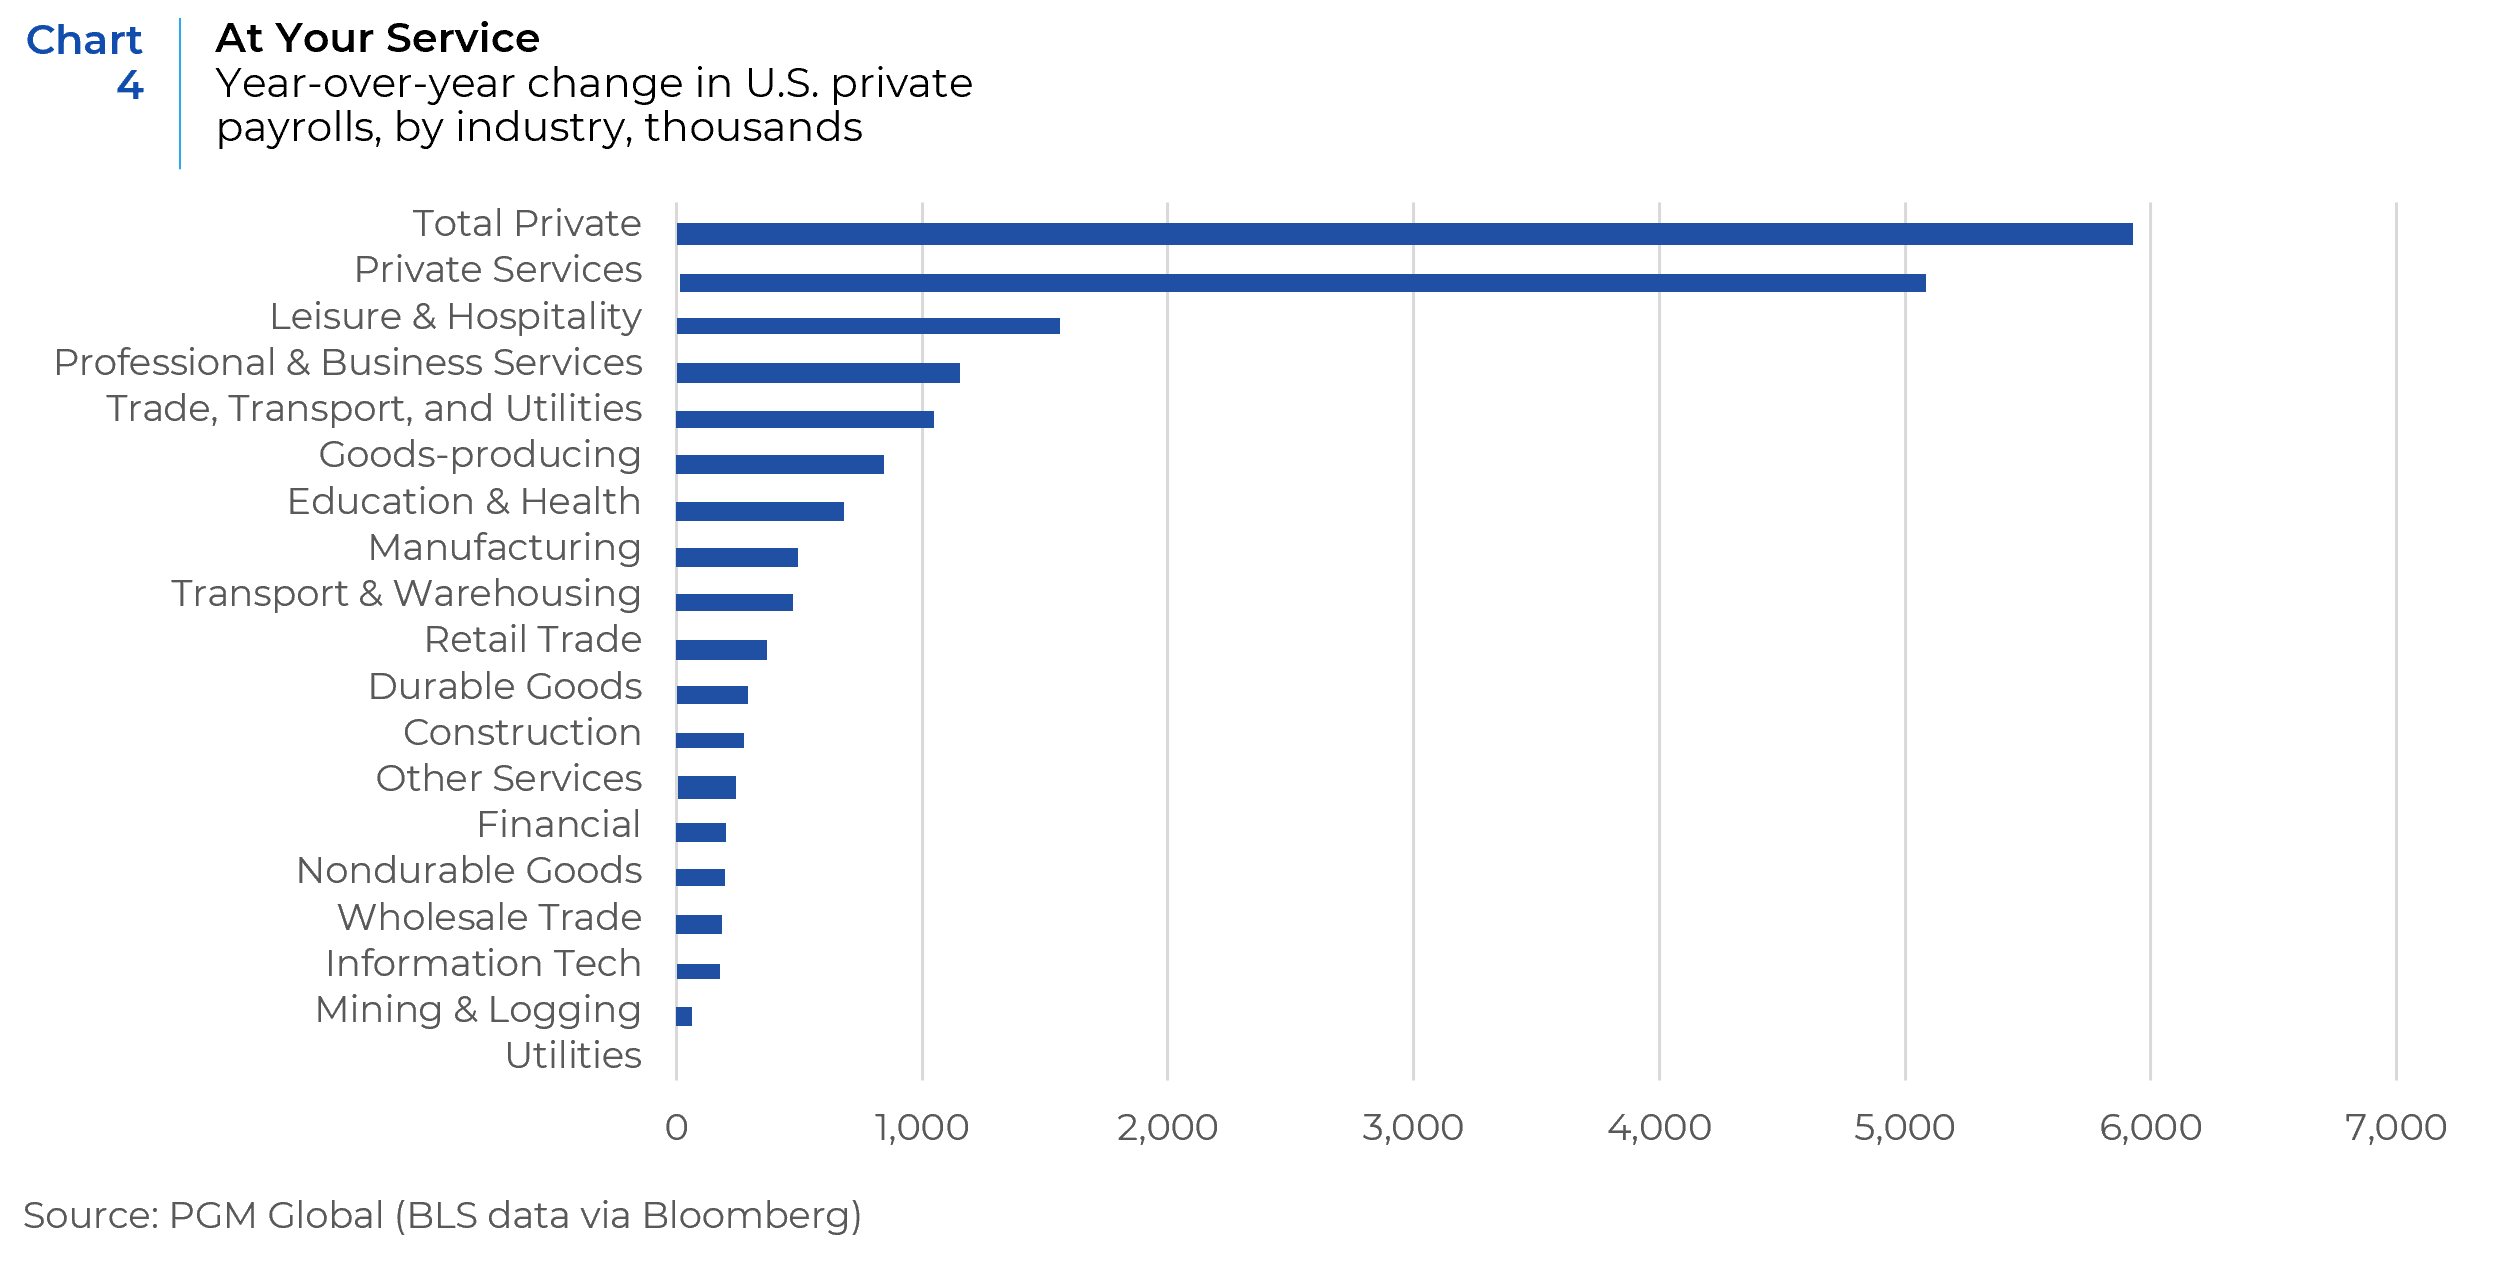
What is more important for investors is where jobs are and the implications this has for growth and inflation. As seen in Chart 4, jobs and wages have grown the most in the service sectors.
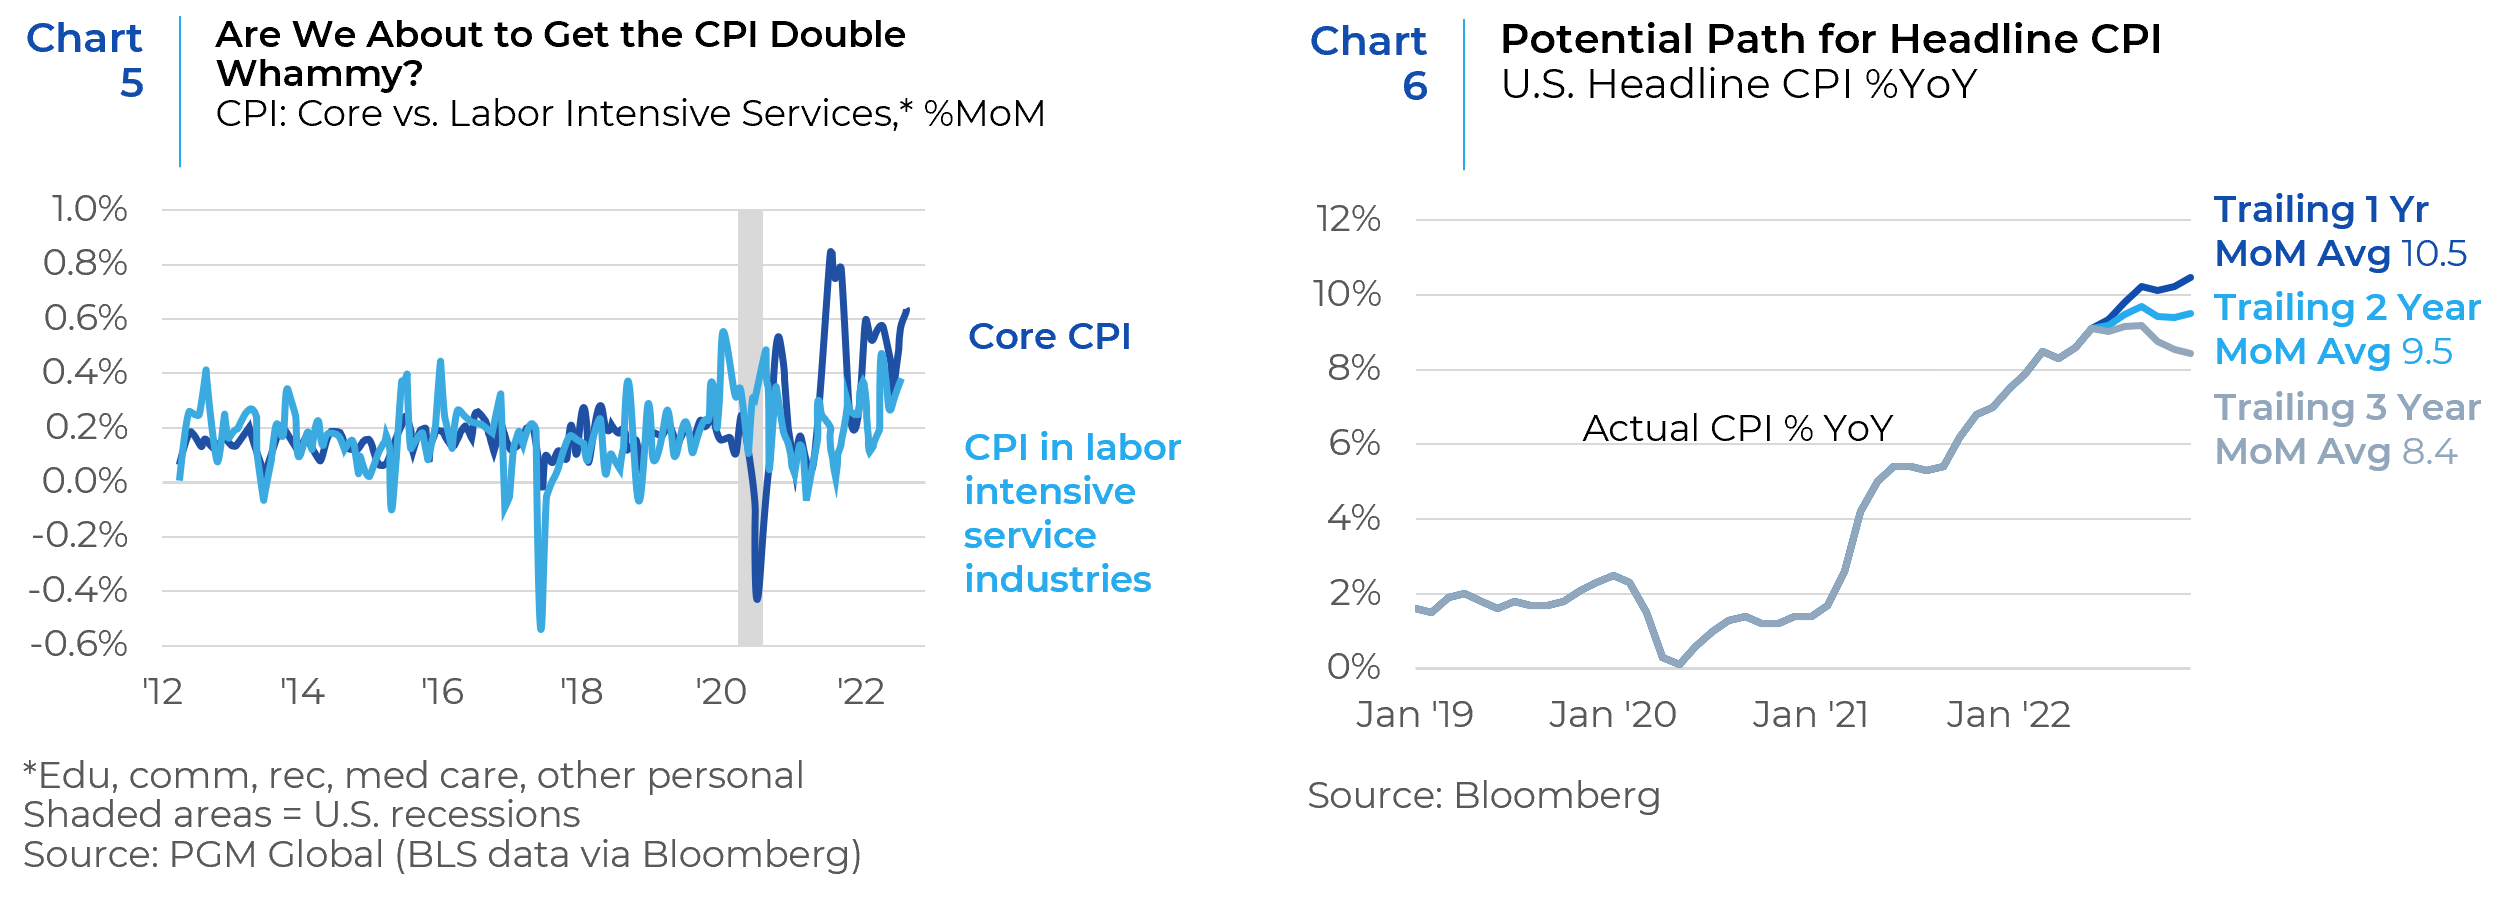
These employment trends are helping to push up CPI, particularly in services. Services comprise the majority of what Americans consume and where they work. Labor costs also tend to be a larger portion of total costs for service firms. Thus, rising food and energy costs, combined with rising inflation in service-intensive labor industries, is a toxic mix for a wage-price spiral (Chart 5).
Chart 6 shows that the near-term prognosis for inflation is not good. If inflation in each subsequent month through year-end 2022 matches the average inflation rate over the prior 12 months, we should finish the year at 10.5%. Alternatively, if monthly inflation recedes to match the trailing 24-month average or 36-month average, then inflation rates would be at 9.5% or 8.4% respectively at year-end. This simple analysis shows that inflation could likely get worse or at best, remain at elevated levels.
The Fed has started moving aggressively to tame inflation. The most recent increase of 0.75% in interest rates in June is the largest rate hike since 1994. If the Fed is too aggressive, they risk choking up economic growth and recession next year. In this market environment, real assets, small caps, and value-oriented stocks can be expected to have better relative performance.
The Consumer is Faltering
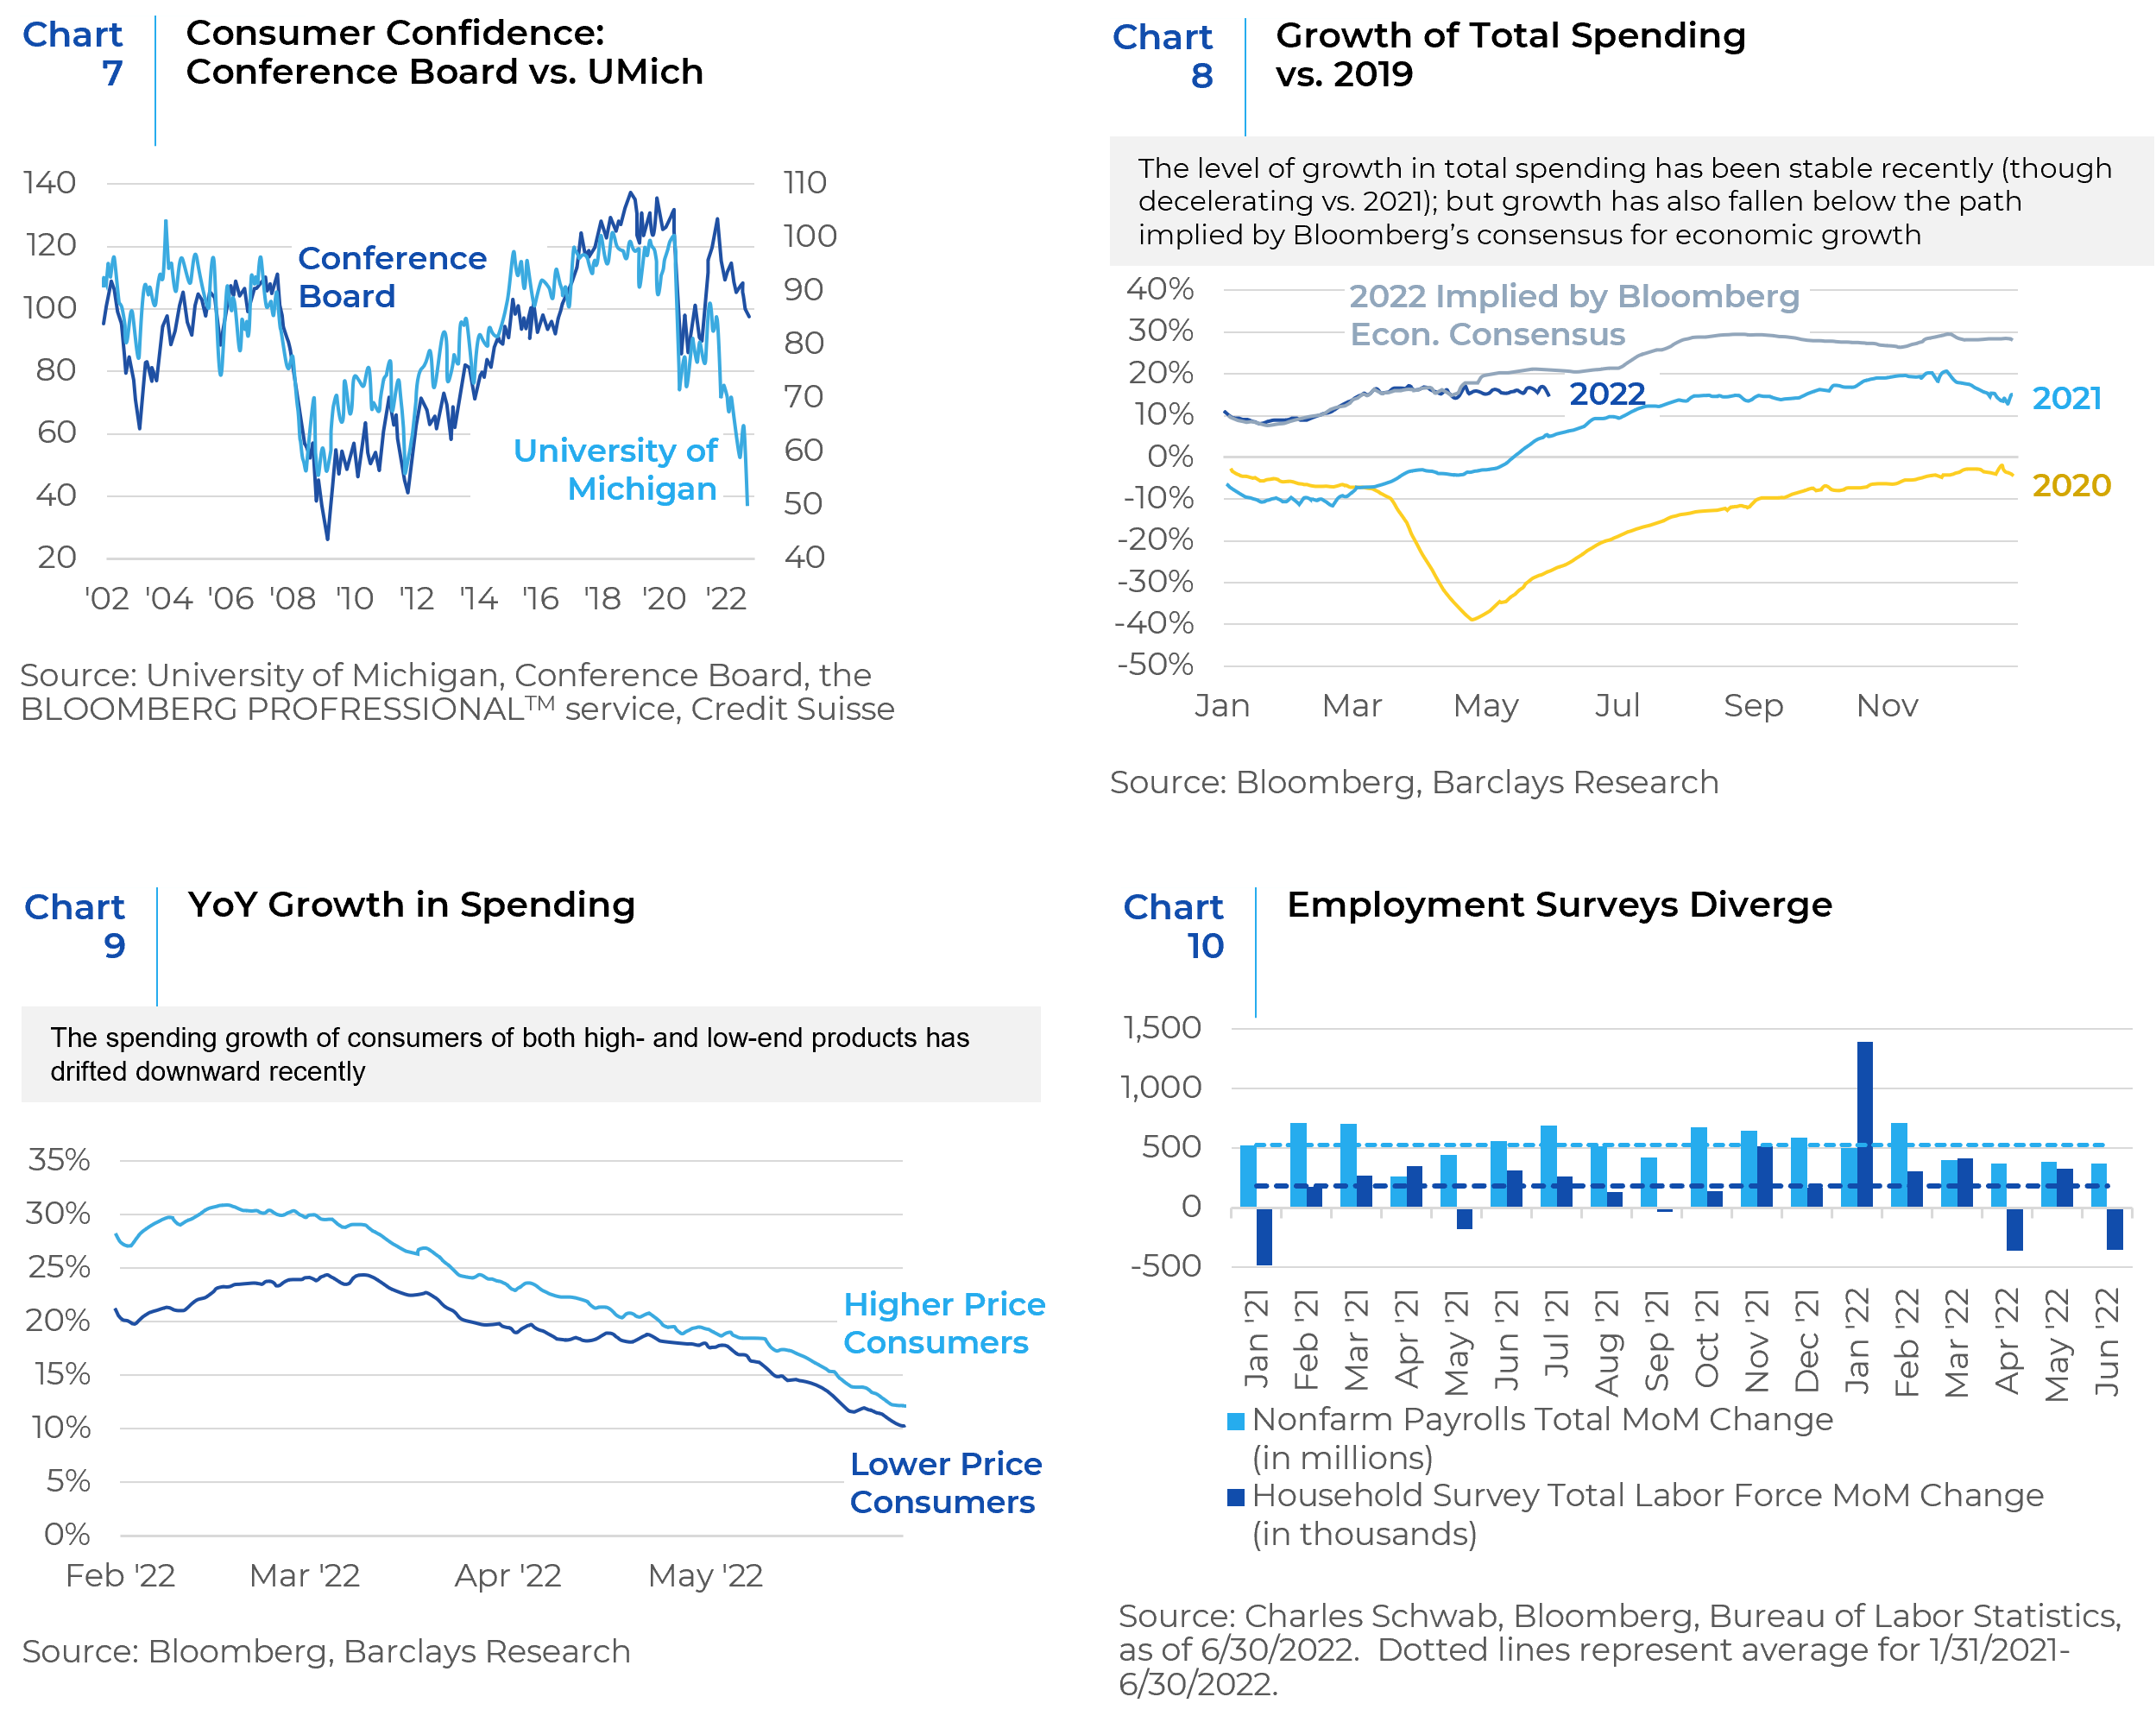
Consumer spending has been a key driver of COVID-era economic expansion, and more recently, a cushion as policy has tightened. US households entered 2022 in good shape, with a strong labor market and high levels of excess savings. Personal consumption expenditure (PCE) grew 3.1% in Q1, even as the overall economy shrank. Similarly, PCE is tracking at a healthy 2.5% according to the Atlanta Fed. The consumer has been bearing the burden of supporting the US economy this year. But that picture may be about to change. Consumer sentiment is beginning to sour, and consumer spending has started decelerating (Charts 7, 8, and 9). Household surveys which are used to calculate unemployment rates, are trending down (Chart 10). These surveys tend to lead payrolls around economic inflection points, and they indicate that employment has fallen in two of the past three months.
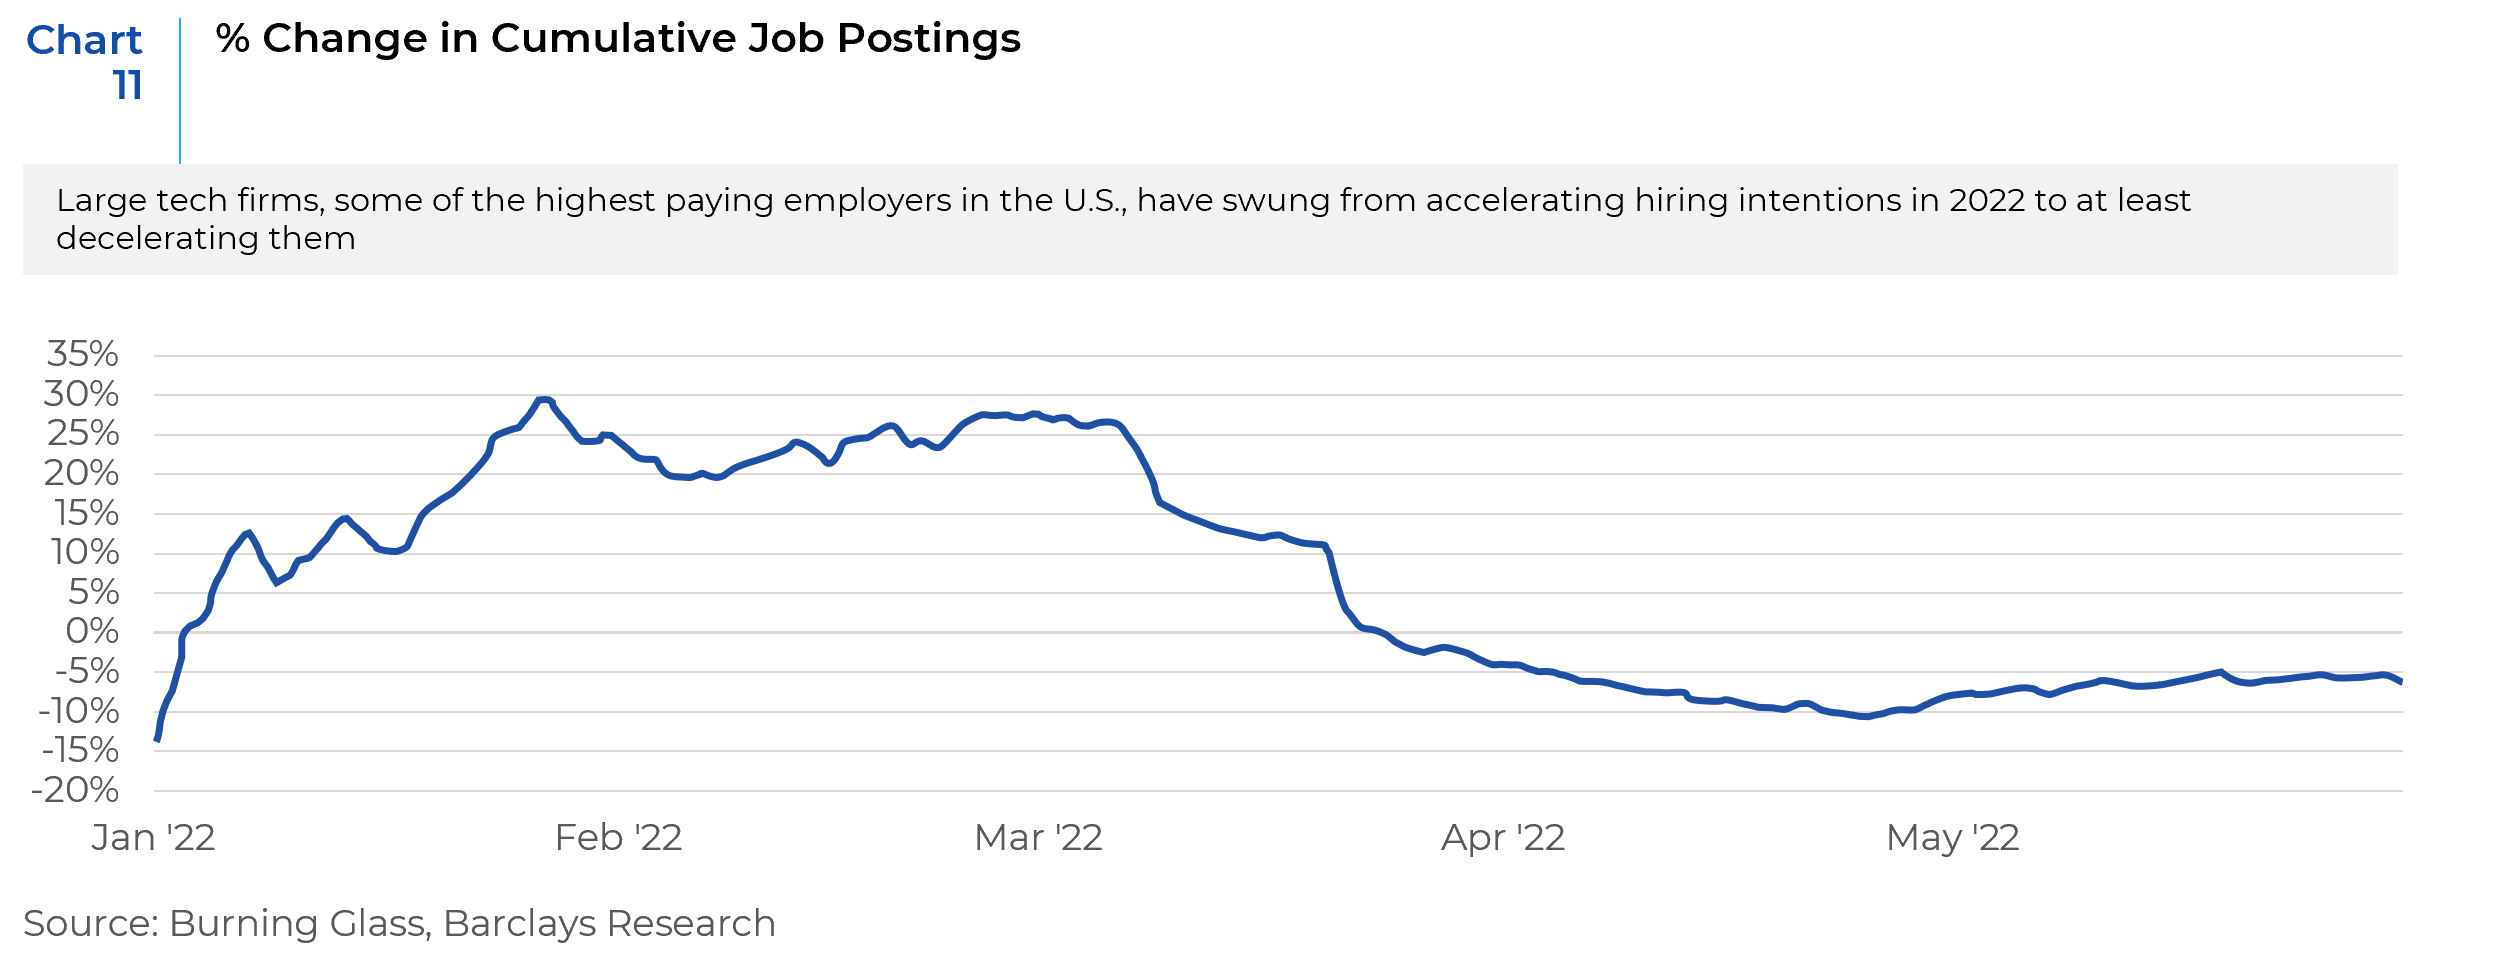
In addition, while the job market is still resilient some cracks are starting to show. Big tech firms have cut hiring intentions sharply These are the first signs that the market for higher-paying jobs in big tech and financial services is turning down (Chart 11).
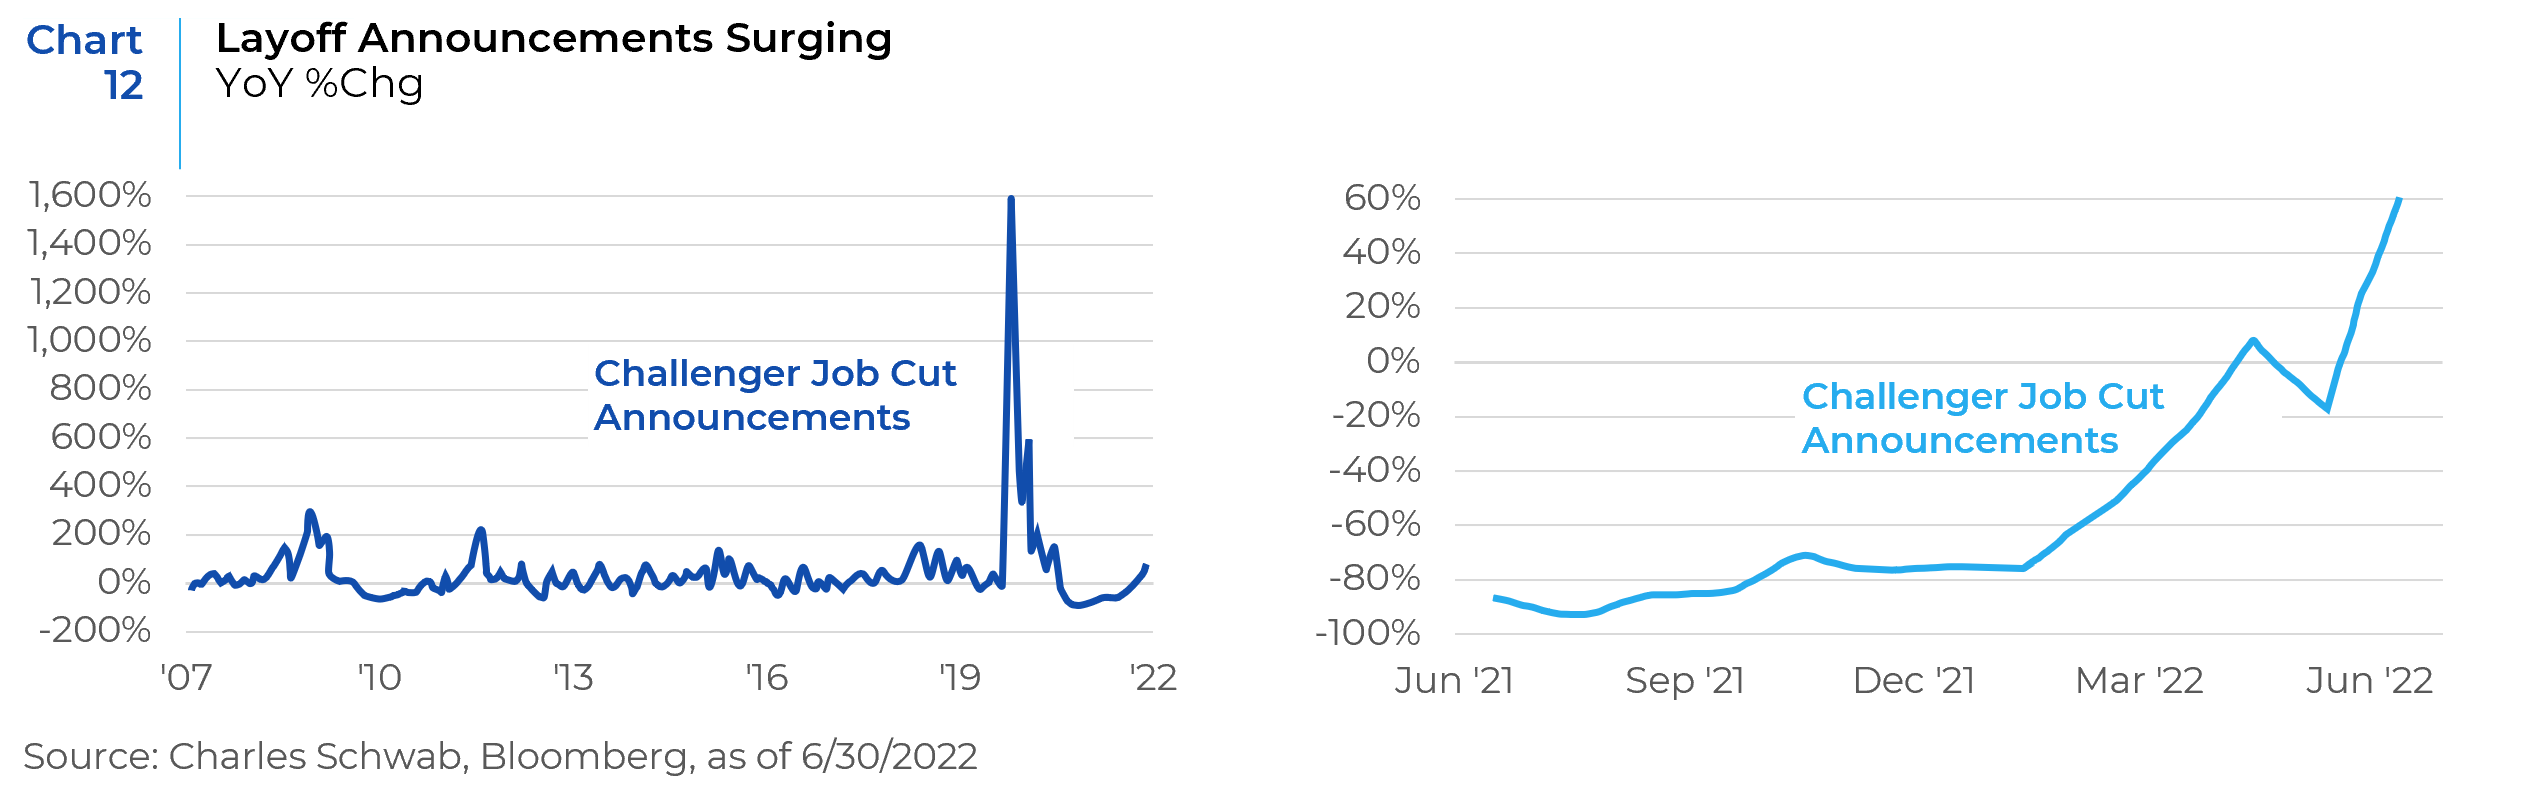
Often concurrent with waning job openings is an uptick in layoff announcements (Chart 12). The left chart below shows the Challenger measure of job-cut announcements back to the start of 2007. The right chart is a close-up look at the trend over the past year. There has been a clear move up, with the quarter-end reading up 60% year over year.
Inflation has also taken a bite out of real income and consumer spending is bound to be curtailed by rising food and fuel prices. These trends point to a slowing economy and higher chances of stagflation and recession. These dynamics should continue to challenge the relative performance of consumer discretionary stocks.
The State of Corporate Earnings
The recent pullback in equity markets was entirely driven by multiple contraction. However, going forward the S&P 500 performance is likely to be driven more by earnings. Consensus estimates expect earnings to grow at 10% over the next 12 months, despite negative corporate guidance (Chart 13). If estimates are not downgraded, earnings will disappoint, and we may see further pullback in equity markets.
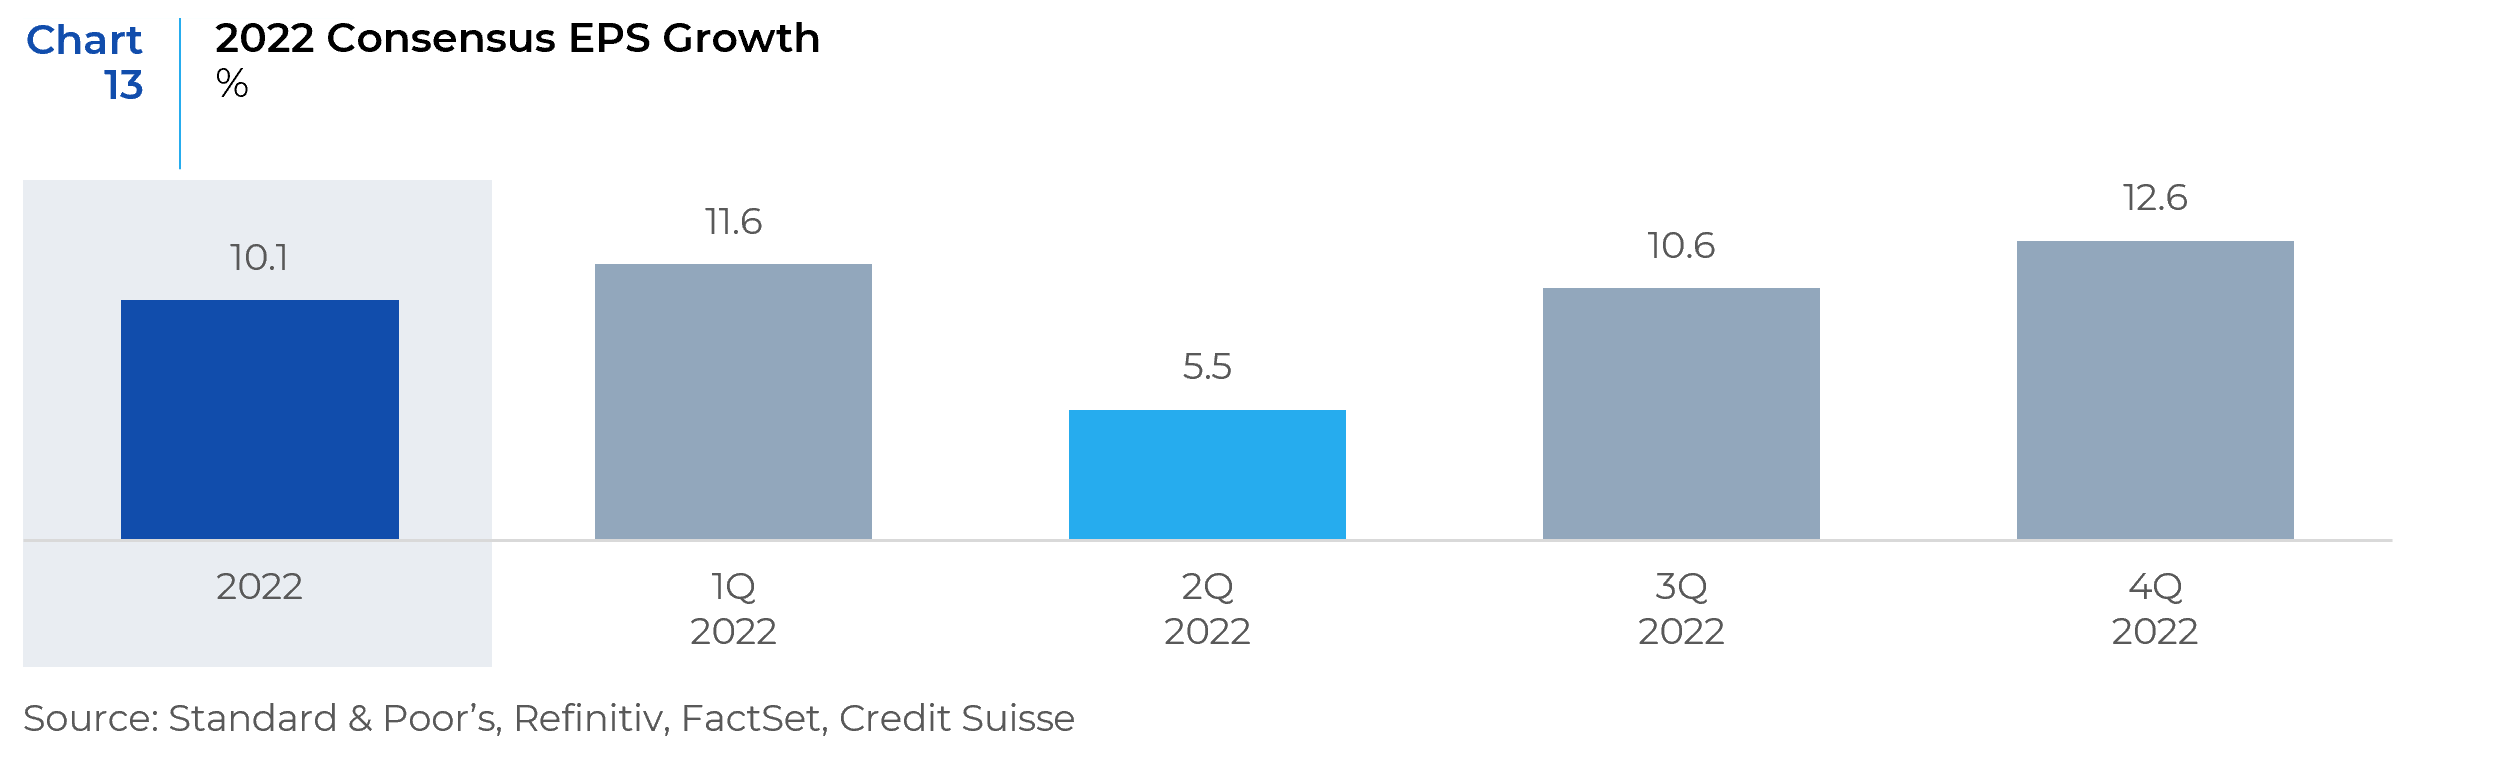
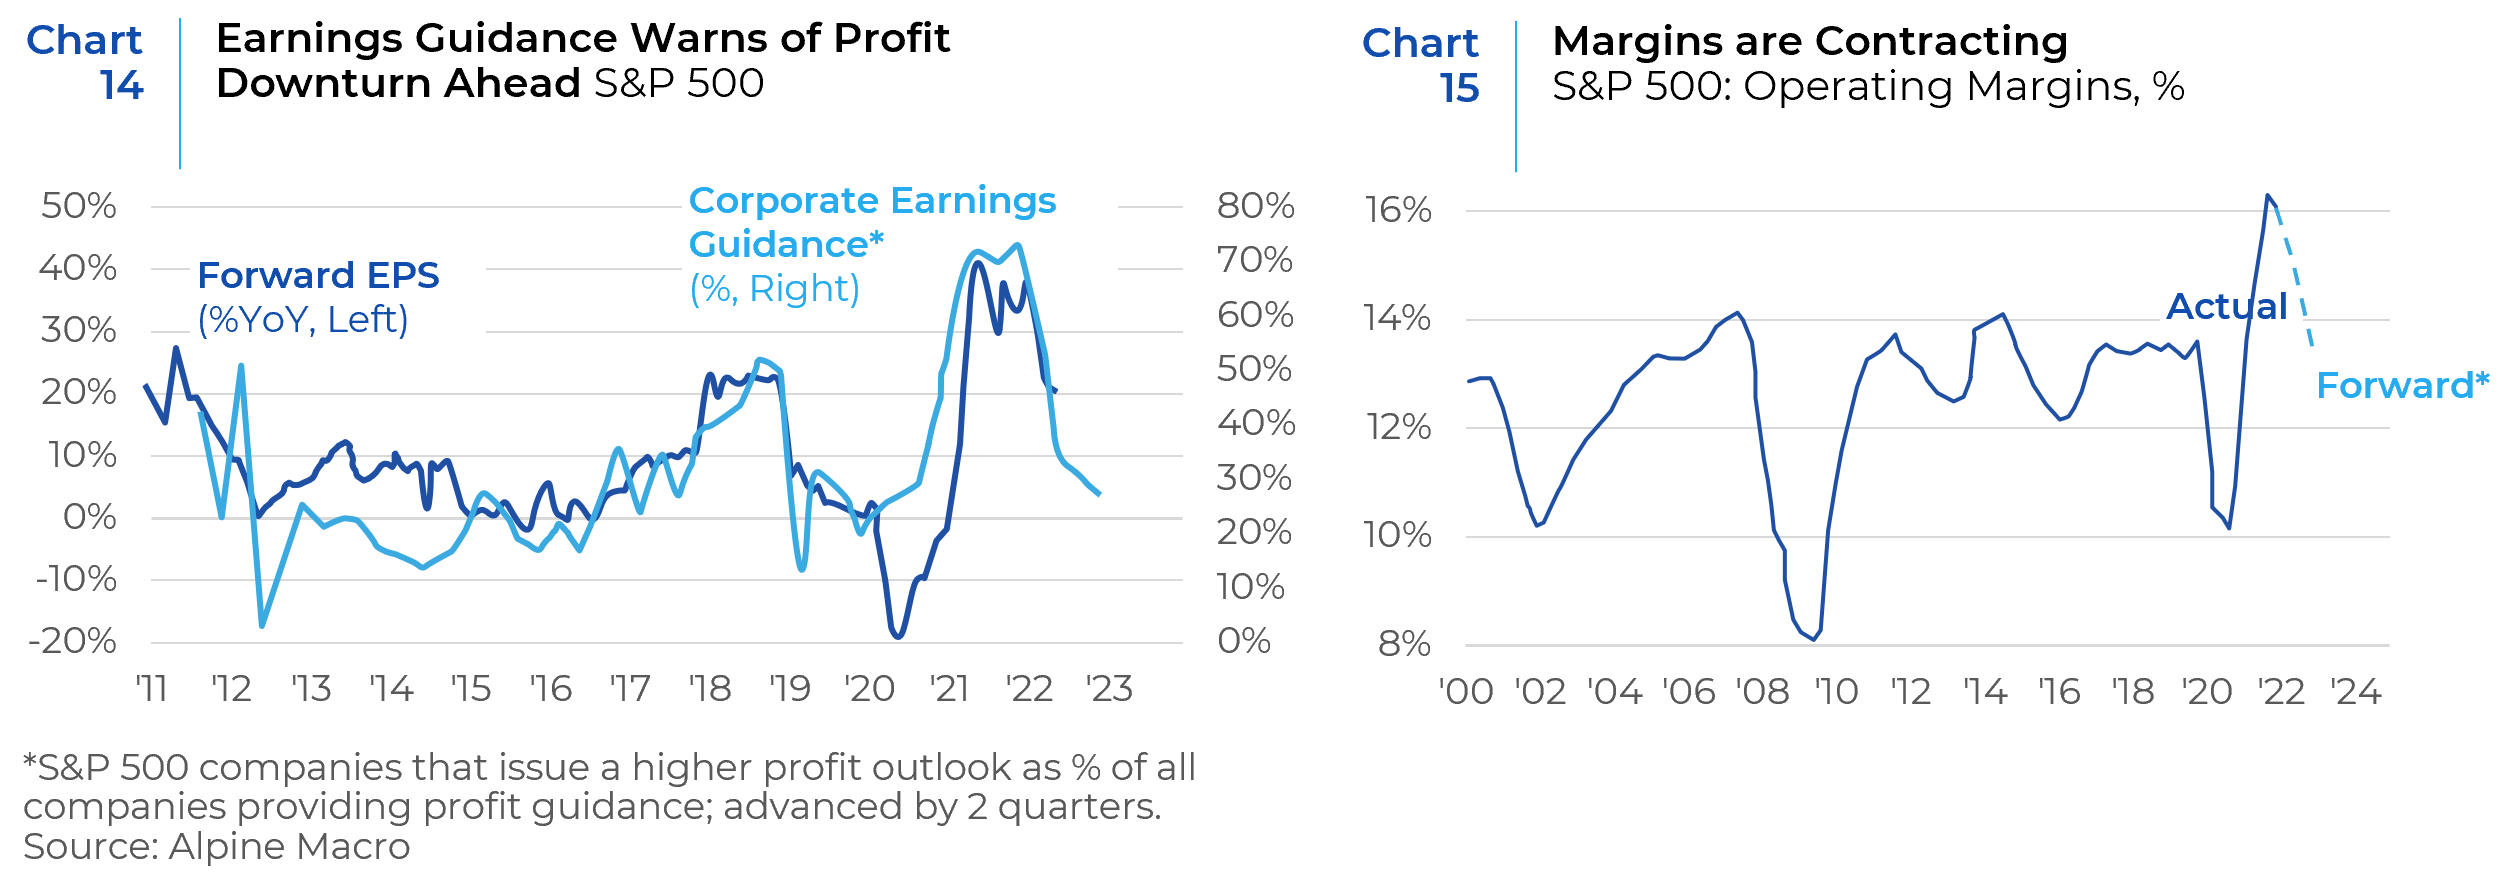
Chart 14 shows that corporate earnings guidance for the S&P 500 have dropped precipitously in recent weeks, which usually presages a sharp downturn in EPS. In addition, shrinking profit margins are likely to translate into flat to negative real earnings growth over the next 12 months (Chart 15).
All of this means that economic performance holds the key for stock market performance: in the case of a soft landing for the economy where there is no earnings contraction, the bear market in stocks may already be over as equity multiples have made the necessary downward adjustments. If, however, the economy slips into a recession in the coming months where earnings growth turns negative, there should be further declines in stock prices to account for EPS contraction.
Poor earnings environments historically have tended to favor the growth style, which typically is less threatened by cyclical downturns. But this time could be different, given the heavy weight the technology sector now carries in indices. These companies will face strong 2021 earnings comparisons in the second half and some late cycle effects of slowing growth. Consumer oriented technology platforms, such as streaming media, could be vulnerable to a cyclical slowdown in spending. These factors suggest that the back and forth style rotations seen since the pandemic recovery have tipped in favor of value-oriented and real asset-oriented sectors.
Trends in Factor Performance
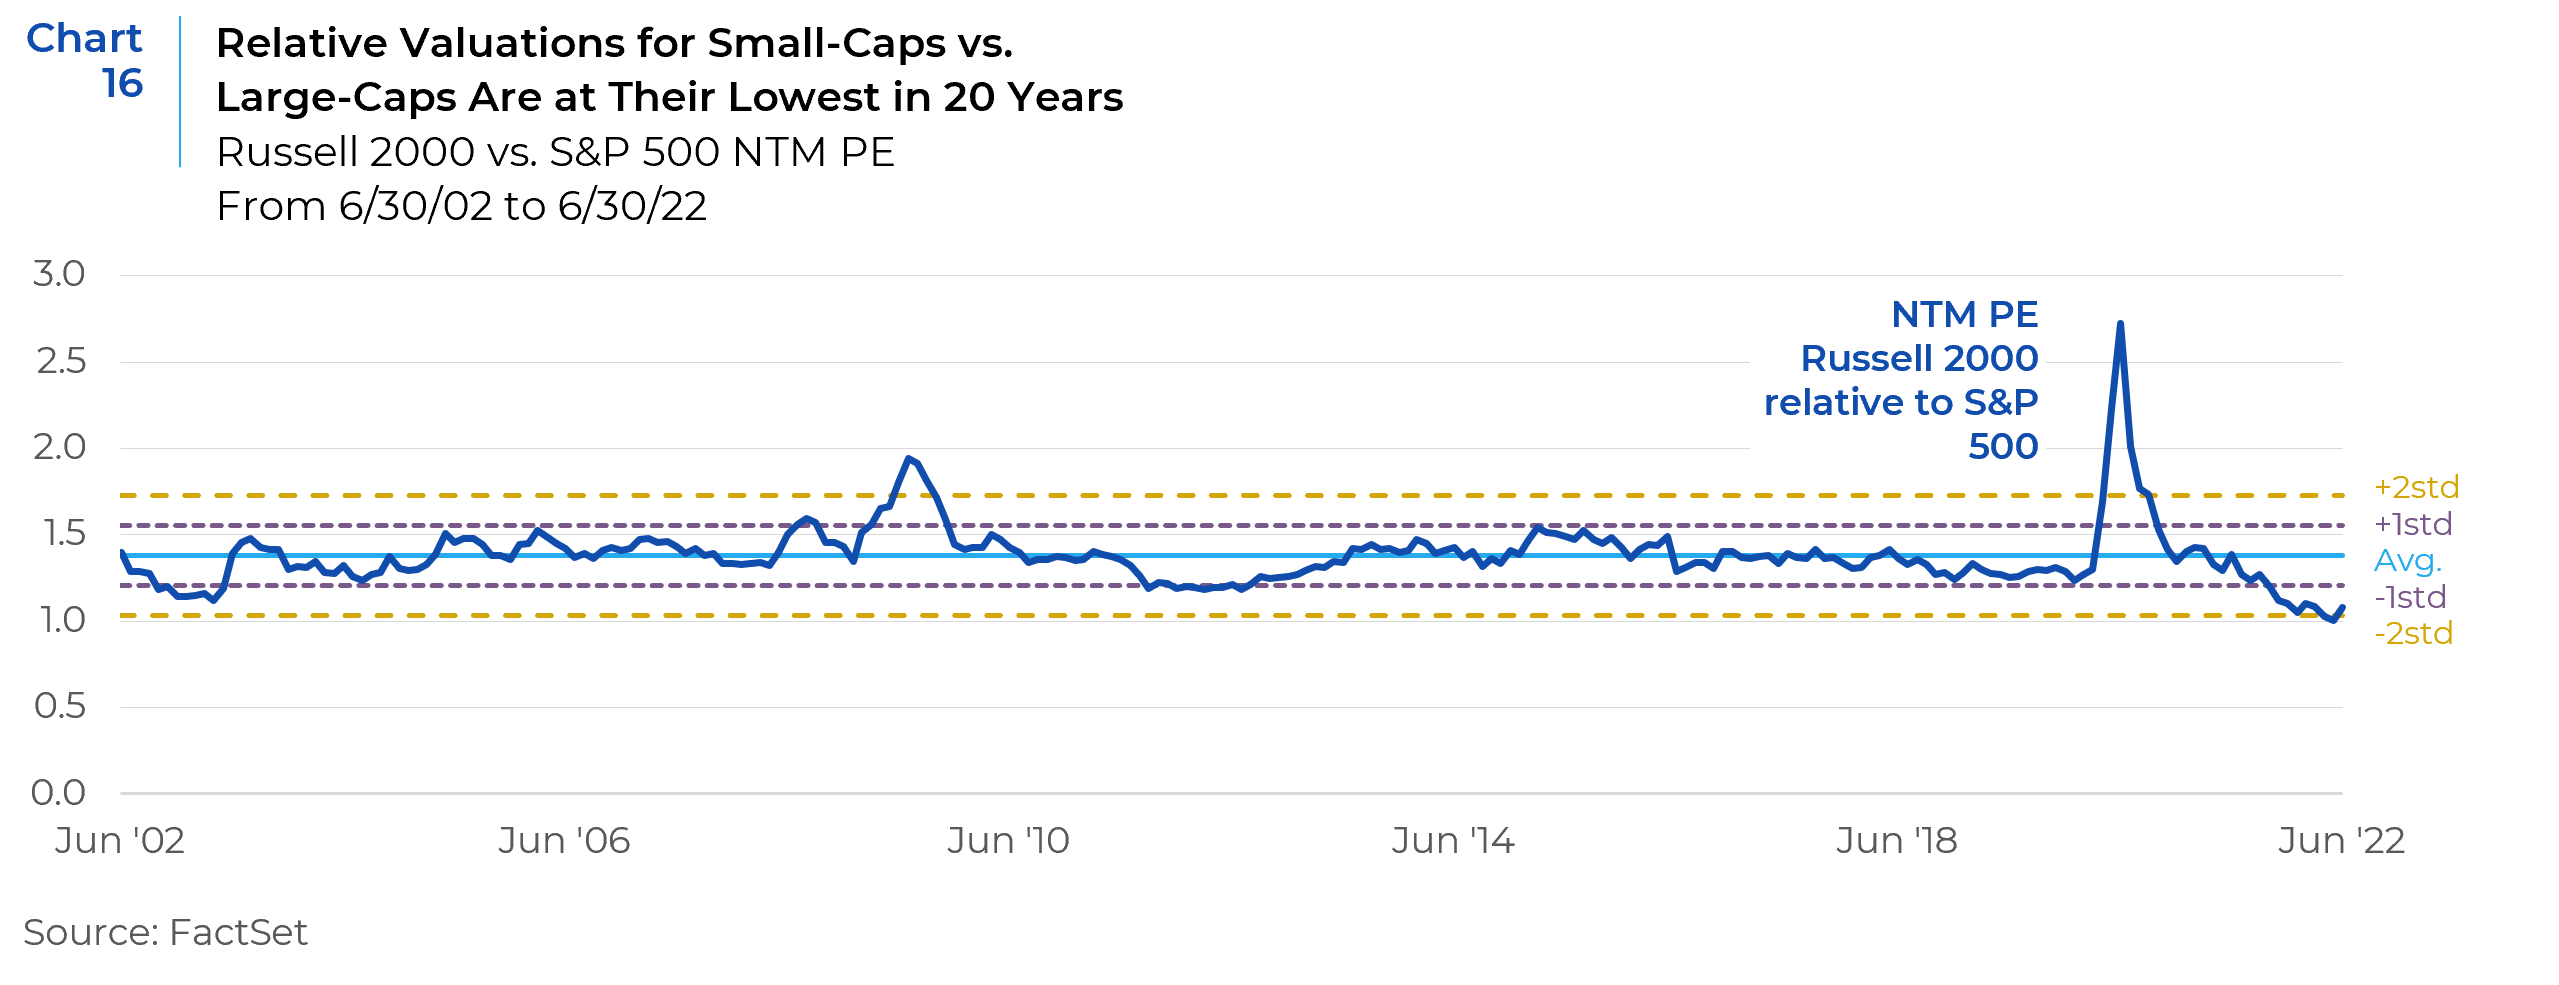
While uncertainty in the market environment and investor pessimism may lead to large caps outperforming small cap stocks, the extreme undervaluation of small caps is starting to make them look attractive. Small-caps have averaged a 38% premium to large-caps over the past 20 years. At the end of June, however, small-caps were at their lowest relative valuation versus large-caps in more than 20 years (Chart 16). They appear to be poised to rally at the slightest glimmer of light at the end of the tunnel.
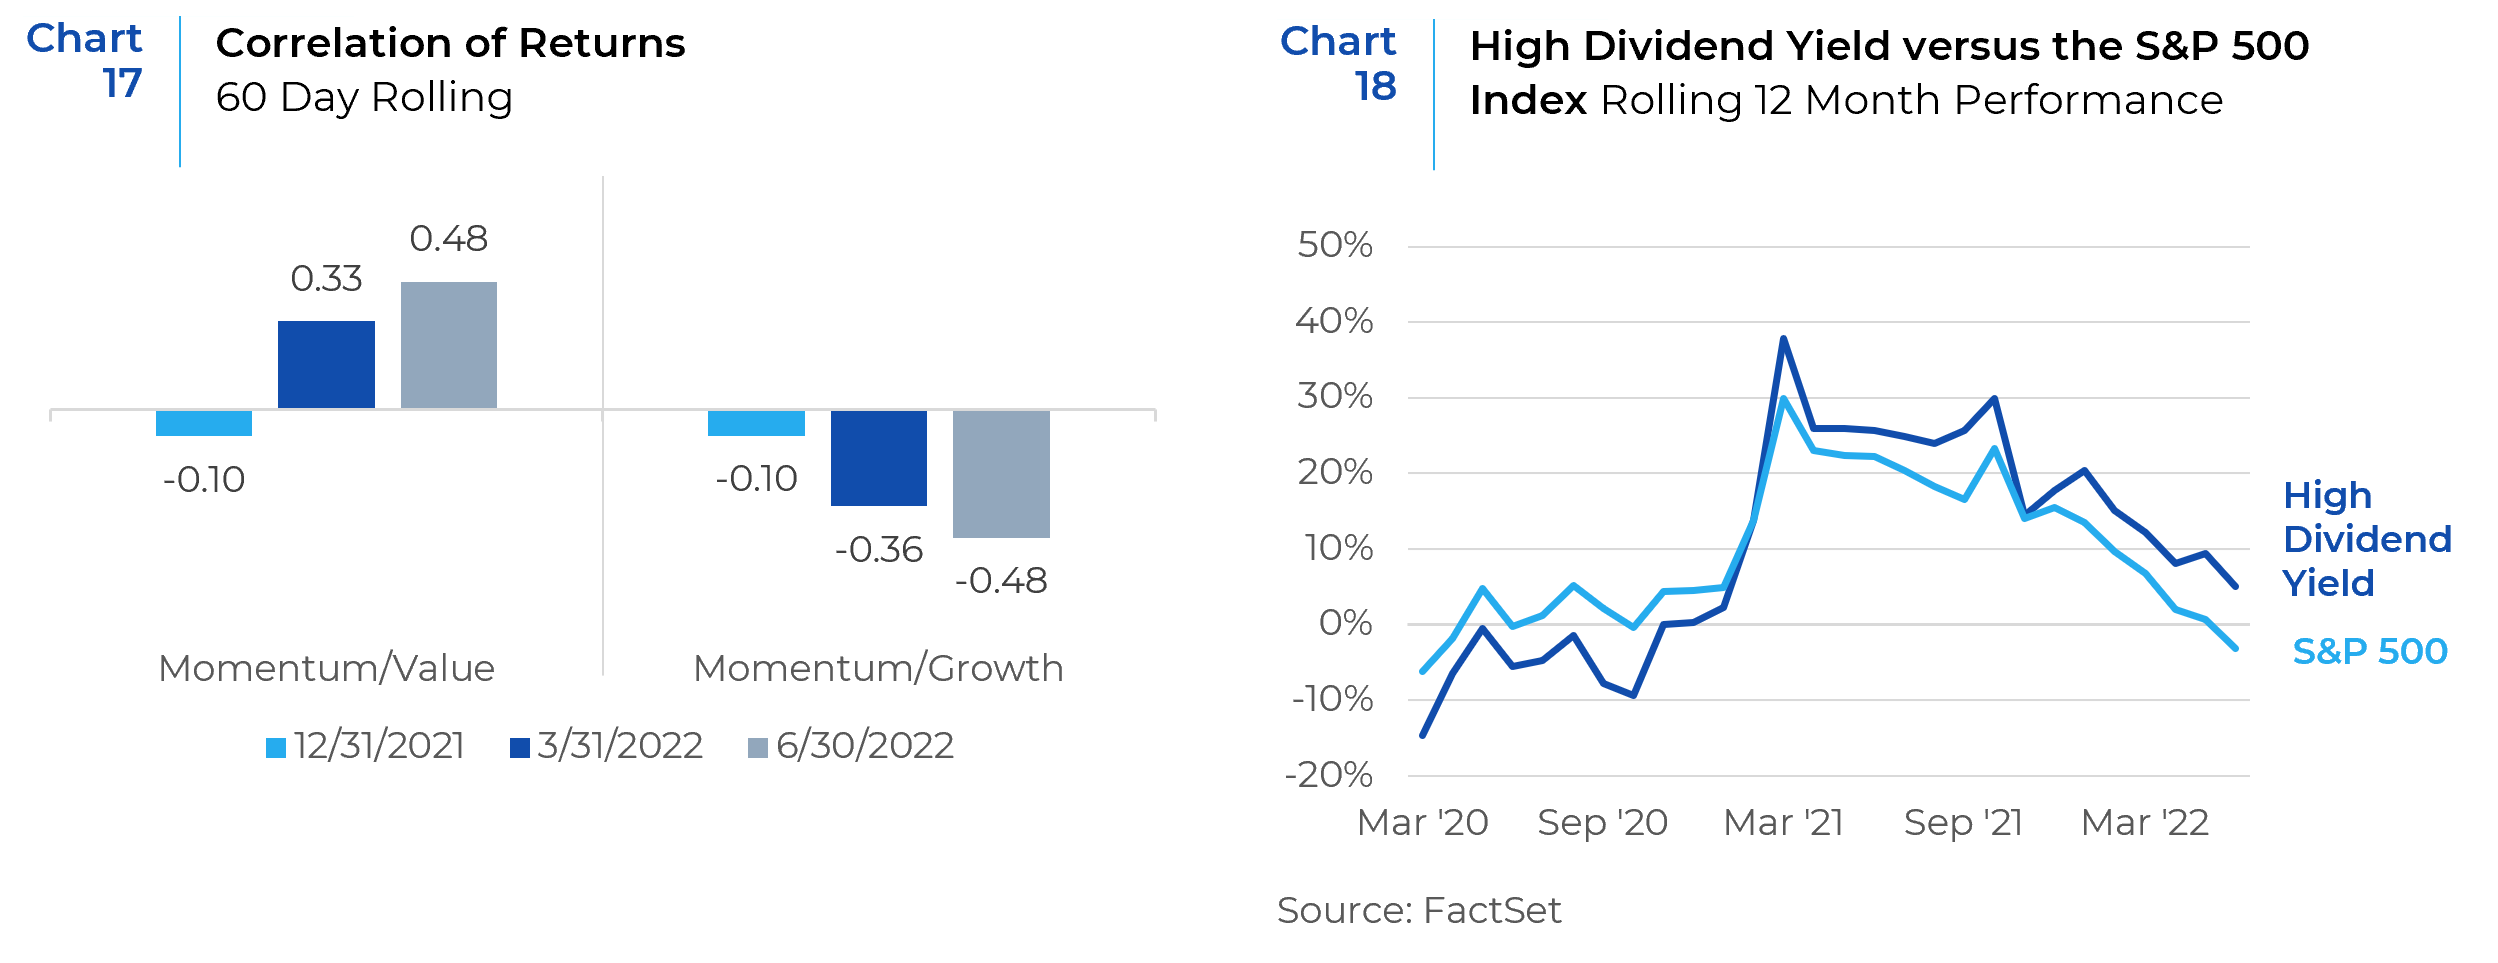
In a similar vein, value-oriented names have gained momentum and are expected to perform relatively better in the near to medium term. As seen below, the Momentum factor has become increasingly positively correlated with Value and negatively correlated with Growth since the beginning of the year (Chart 17). Value stocks tend to be smaller in size as the large cap space is dominated by growth-oriented technology and consumer discretionary companies. Therefore, the value style would also benefit from the outperformance of small cap over large cap.
High yielding companies lagged the S&P 500 in the initial post-pandemic equity rally. However, since then, the relative performance of high yielding companies has consistently outperformed. These companies currently offer attractive valuations and defensive characteristics such as low beta, which have helped them outperform during the recent equity market weakness. The highest dividend yielding companies within the S&P 500 (quartile 1) are down just -1% year to date, beating the S&P 500 by +20% (Chart 18). The outlook for slowing growth and the increased probability of a recession in the next 12 months are supportive of the outperformance of higher dividend yielding, lower beta companies.
Recession Lurking Around the Corner
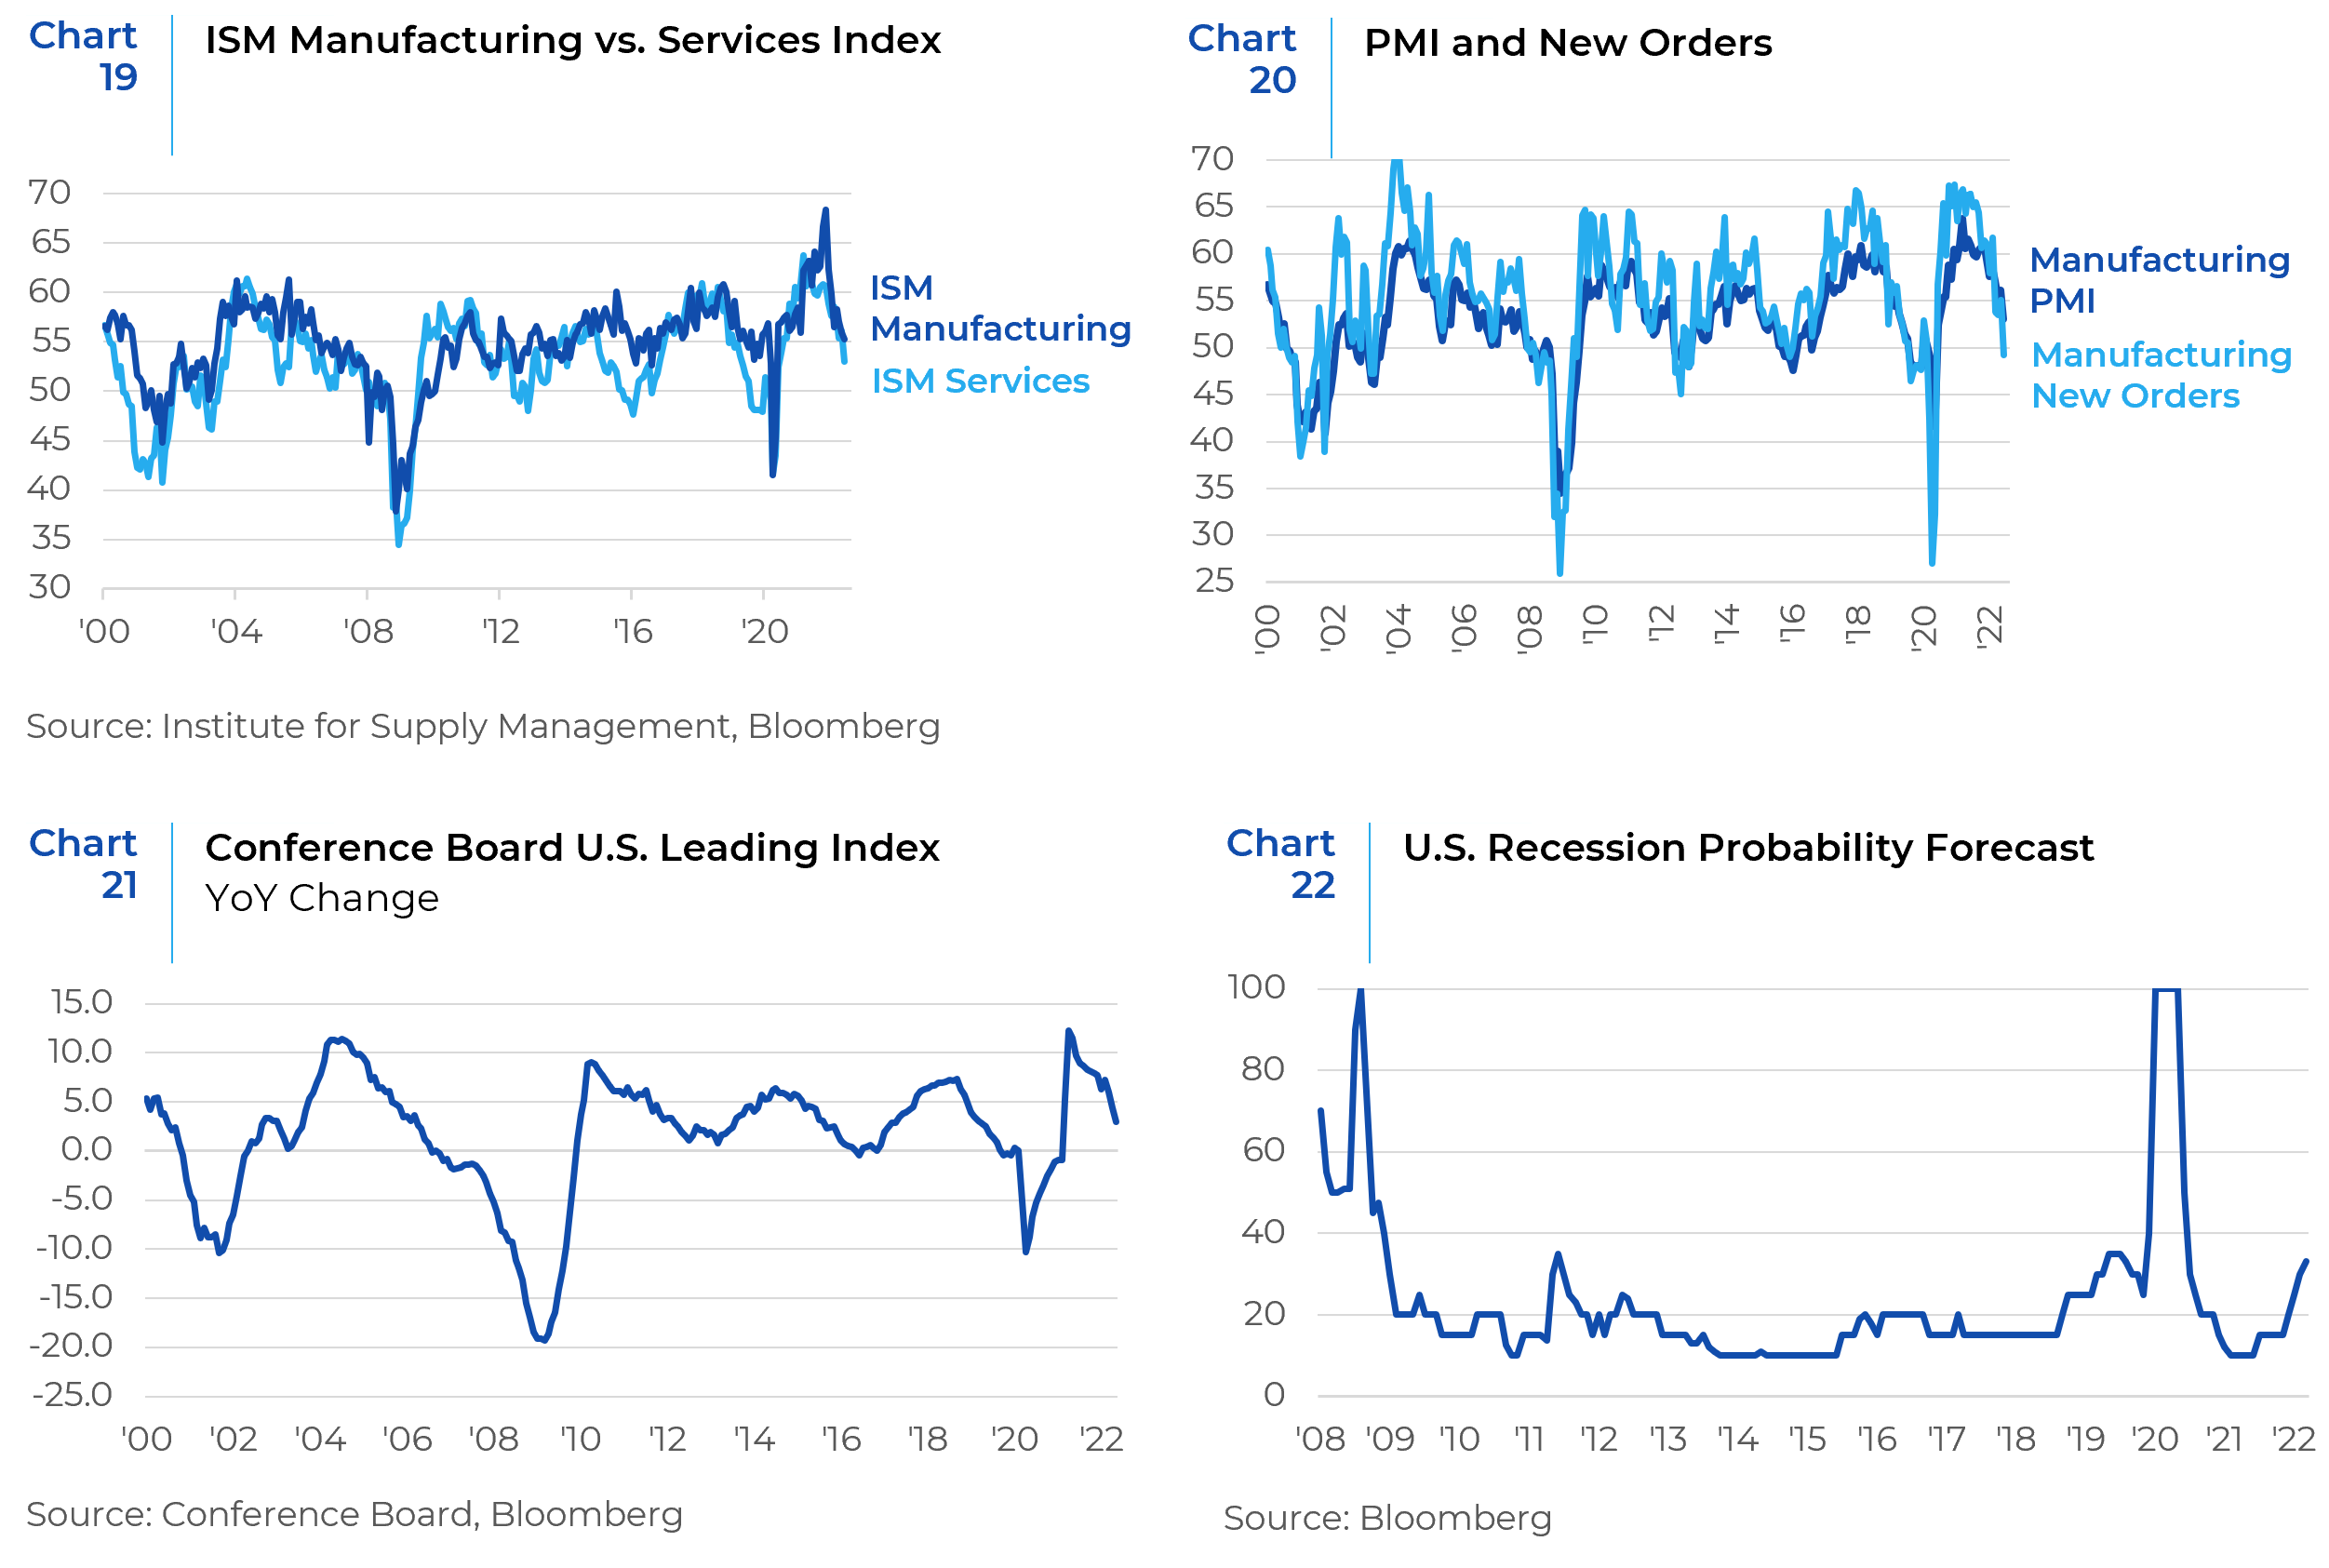
The risk of recession has clearly risen, though it is not yet a certainty. There’s ample reason to be concerned about the state of the economy. Fed interest rates hikes of this magnitude have generally precipitated a recession. So while a U.S. slowdown, perhaps a recession, seems probable, its severity as measured by depth and duration is unknown. Against this uncertain backdrop, there are heightened risks around the Fed’s ability to manage a soft landing, i.e. to slow the economy enough to bring down inflation without causing it to tip into a deep recession. Both the ISM Manufacturing and ISM Services Indices have started to trend down sharply (Chart 19). The same can be said about the PMI. Specifically, the new orders component of PMI has crossed 50 which is considered a sign of economic contraction (Chart 20). The Leading Indicator Index has started to decline, and the forecasted probability of a recession has started to go up (Charts 21 and 22). These are signs for most investors that a recession is lurking around the corner.
For equity markets to rally, investors will need to see that inflation has turned lower. Such a clear drop in inflation remains unlikely in Q3, with US headline CPI likely peaking in the third quarter. Energy is a related worry. Oil prices have risen 25% in Q2, despite hawkish central banks, a falloff in growth, and China lockdowns. This suggests that they could have further to rise, with more pain for consumers. Also, Russia has started to cut natural gas supplies to major European economies. A shut-down of all gas exports to Europe in the winter, once considered unthinkable, is now a real risk. Finally, China remains the one country that has still not had a major COVID wave – not anywhere along the scale of the million cases per day that the US had earlier this year. Given the far more contagious nature of recent variants, this is another risk to worry about. In all likelihood there is additional downside to US equities.
Upside Risks
Gloomy as the macro-outlook seems, there is a positive probability for upside surprises. Inflation could come down more quickly if the supply side of the labor market recovered, dampening wage growth and, therefore, inflation. Of course, the Fed could turn more dovish if there were signs that growth was collapsing, or if markets started to show signs of distress: For example, if equities fell another 20% or corporate bond spreads blew out, as they did in 2007 or 2020. Other upside risks include: More aggressive stimulus by China, a peace agreement between Russia and Ukraine, and increased oil supply lowering the price of crude. However, it is hard to find a convincing catalyst for an equity rebound, until either inflation has been brought under control, or stocks have fallen enough that they are fully pricing in a deep recession. In the meantime, equity markets may experience some sporadic short-term rallies before a bottom is hit and a sustained rally is set in motion. Markets tend to lead the economy, so a recovery in stock prices may happen well before the economy starts growing again.
References: FactSet, Research Affiliates, BCA Research, Alpine Macro, Charles Schwab Asset Management, PGM Global, Barclays Research
This report is neither an offer to sell nor a solicitation to invest in any product offered by Xponance® and should not be considered as investment advice. This report was prepared for clients and prospective clients of Xponance® and is intended to be used solely by such clients and prospects for educational and illustrative purposes. The information contained herein is proprietary to Xponance® and may not be duplicated or used for any purpose other than the educational purpose for which it has been provided. Any unauthorized use, duplication or disclosure of this report is strictly prohibited.
This report is based on information believed to be correct, but is subject to revision. Although the information provided herein has been obtained from sources which Xponance® believes to be reliable, Xponance® does not guarantee its accuracy, and such information may be incomplete or condensed. Additional information is available from Xponance® upon request. All performance and other projections are historical and do not guarantee future performance. No assurance can be given that any particular investment objective or strategy will be achieved at a given time and actual investment results may vary over any given time.