
Will U.S. Equities Continue to Trounce Non-U.S. Equities?: Text Version Only
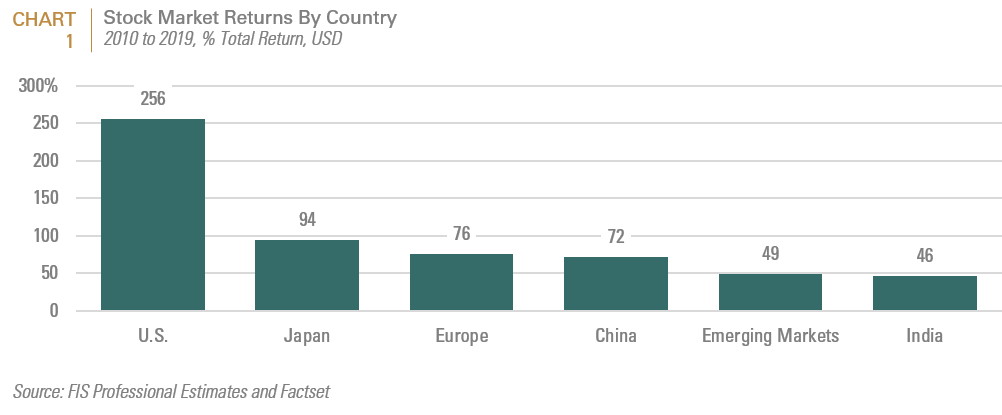
For global equity investors, the decade ending on December 31, 2019 was undoubtedly the American decade. The performance of U.S. equities more than doubled and in many cases tripled other countries and regions such as emerging markets, that dominated the prior decade (Chart 1). If their non-U.S. assets were unhedged, dollar-based allocators’ performance would have been further weakened by currency translation, as over the last decade, the U.S. dollar appreciated by 28%. Consequently, some allocators are revisiting the wisdom of their non-U.S. allocations.
In this paper, we show that the past decade’s relative performance of U.S. vs. non. U.S. equities was driven by three main factors: sector, currency effects (as a result of the U.S. dollar’s post-2011 bull run), and U.S. companies’ capital structure management in an era of declining interest rates. While some of these contributions to returns may continue in the near-term, the outlook for their persistence over the next decade looks increasingly suspect, and would likely defy substantial historical precedent. In looking out over the next decade, we are guided both by evidence that suggests that allocators would be wise to maintain a broad geographic diversification within their equity portfolios that includes both passive and active components.
1. U.S. Sector Composition Drove Outperformance
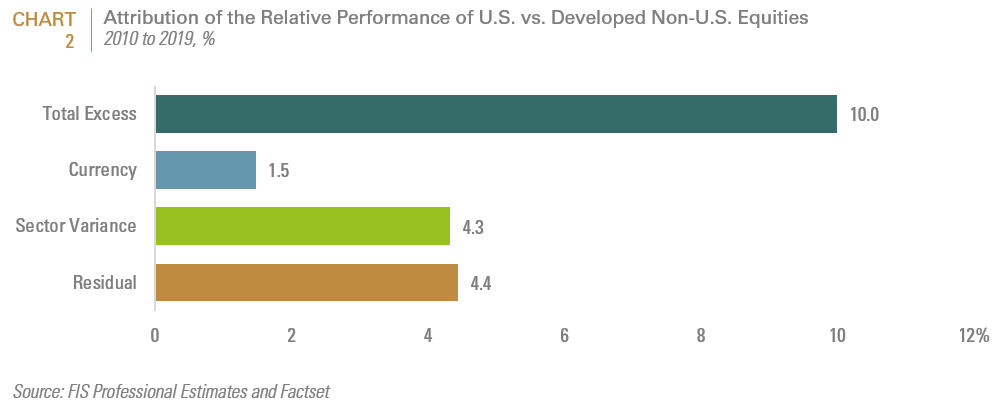
Over the last decade, U.S. equities outperformed developed non-U.S. equities by an average annual rate of 10%. In order to gauge the impact of two major sources of variance, currency and sector composition, we evaluated the difference between the local currency and dollar-based return of each respective index for currency; and we evaluated the local currency performance variance of the equal weighted sector index vs. the actual index to determine the impact of sector variance. The residual reflects performance that is unexplained by either currency or sector composition.
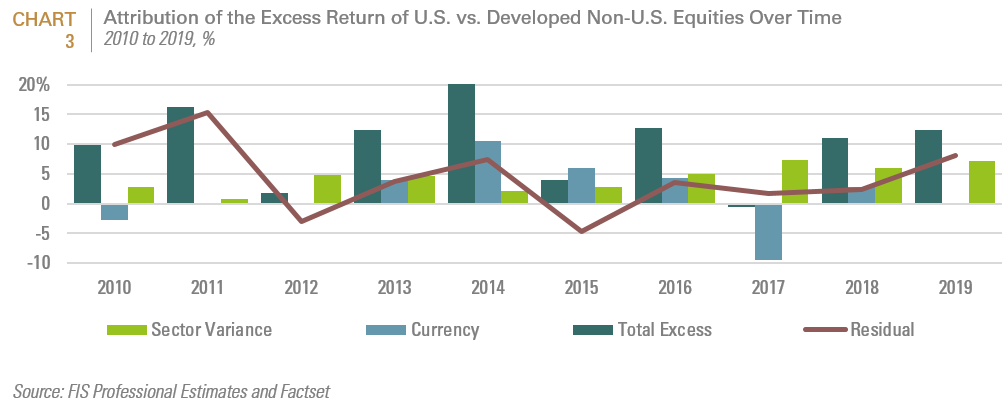
Sector composition variance was responsible for a 4.3% average annual performance advantage; whereas the greenback’s appreciation added 1.5%. While the contribution from currency varied over time; the U.S. index’s sector composition was the most consistent source of relative performance (Chart 2 and Chart 3). The residual factor tended to reflect country or regional level idiosyncrasies. For example, U.S. equities experienced positive residual effects in 2011 as a result of the European debt crisis and in 2019 as a result of geopolitical uncertainty associated with the trade war and Brexit.
For emerging markets, the picture was similar, but because of the significance of residual effect, less clear. Over the last decade, emerging market equities underperformed U.S. equities by an average annual rate of 10.8% (Chart 4). Sector composition variance was responsible for a 3.2% average annual performance advantage; whereas the greenback’s appreciation led to a 1.8% average annual performance edge. What renders these results more ambiguous is the size of the residual or unexplained factor. In addition to the sources of residual risk mentioned above, we believe that the higher residual for emerging markets stocks is attributable to two factors: 1. Lower correlation among emerging markets than among developing markets, which leads to greater idiosyncratic market risk at the country and currency levels; and 2. Higher stock-specific idiosyncratic risk; neither of which would be well captured by our index level analysis.
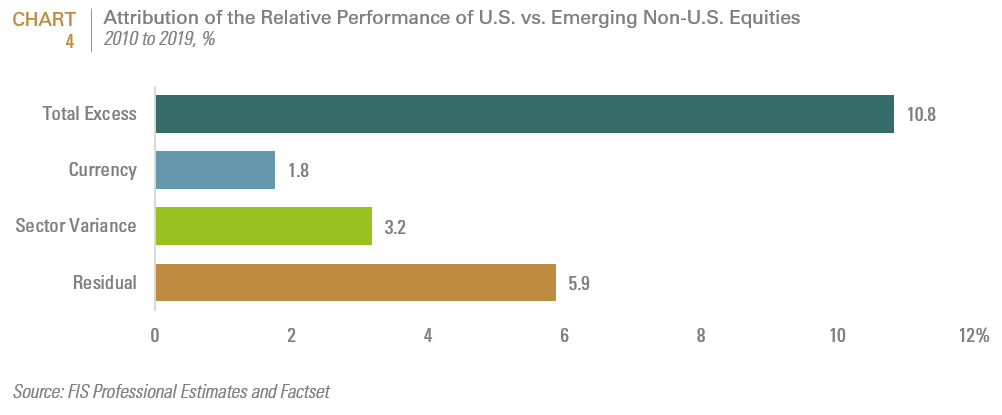
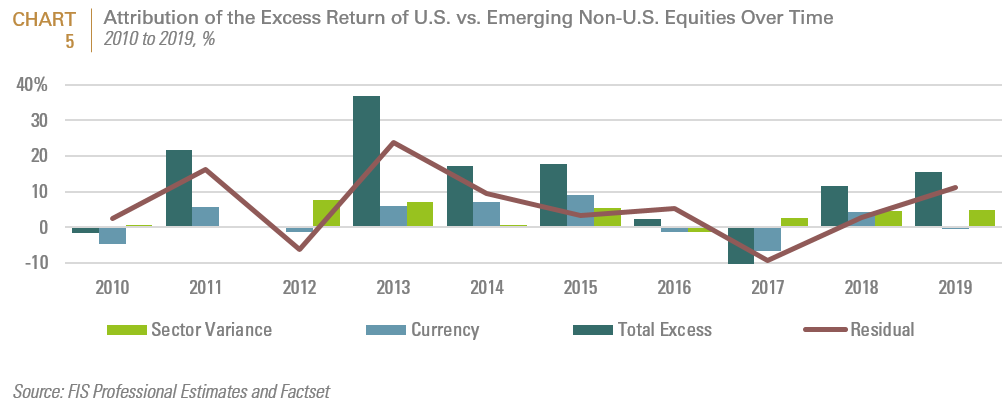
For the attribution relative to Emerging Markets, the market decline prompted by the Fed Chairman’s 2013 announcement that QE was ending also generated a positive residual effect for U.S. equities (Chart 5). At the security level, we also believe that U.S. companies’ capital structure and the impact of share buy backs were another source of idiosyncratic risk relative to non-U.S. companies that would not have been captured in our attribution analysis. This latter effect is discussed in greater detail in Section 2.
The key question for asset owners therefore is are there cyclical, secular and/or fundamental factors that will challenge the performance leadership of these companies? We argue that there are. Moreover, the performance history of “hot” market segments in the subsequent decade should give investors further caution.
Evaluating the Durability of U.S. Equities’ Sector Advantage
U.S. equities’ materially larger exposure to companies in the Technology, Consumer Discretionary, Healthcare sectors and more recently, the Communications Services sectors was the most significant driver of their outperformance. Indeed the only other decade in which U.S. equities outperformed an equally weighted country portfolio of major equity markets was the 1990’s, which was also dominated by technology stocks. Chart 6 and Chart 7 respectively evaluate the sector composition variance of the MSCI U.S. index vs. developed and emerging non-U.S. equity indices.
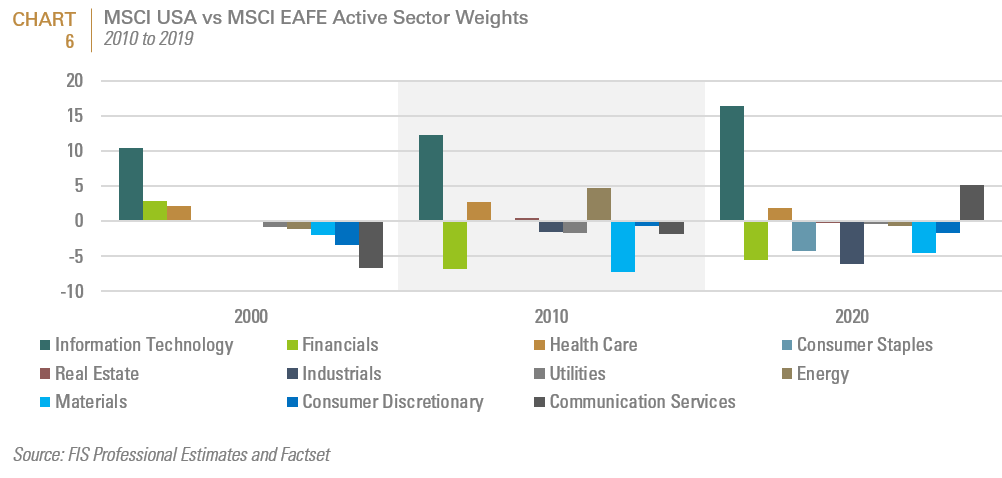
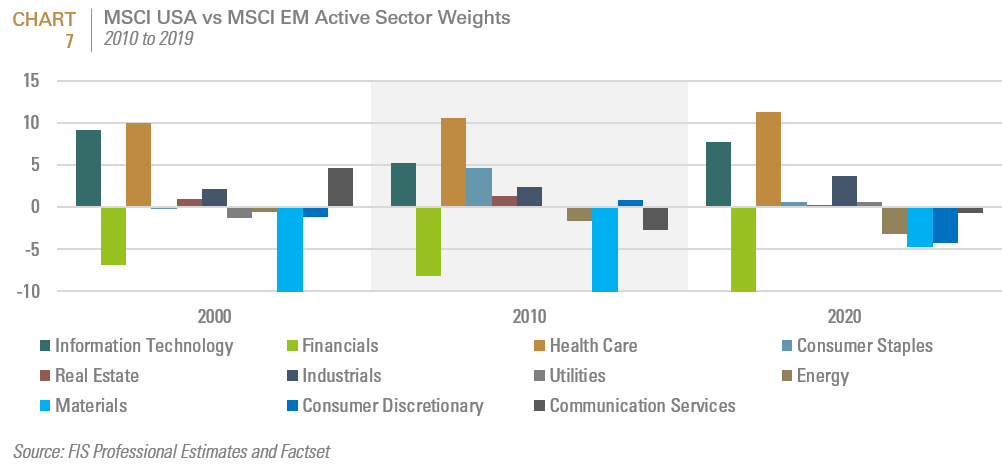
Relative to non-U.S. equity indices, U.S. equity indices have significant active weights to healthcare, technology companies and more recently, communication services (which houses erstwhile technology companies such as Alphabet and Netflix). Non-U.S. equity indices have a much greater weight to companies that are classified in the financial, industrial and materials sector. Chart 7 demonstrates similar variances relative to emerging markets with the exception that the U.S. index’s active weight to healthcare is more pronounced.
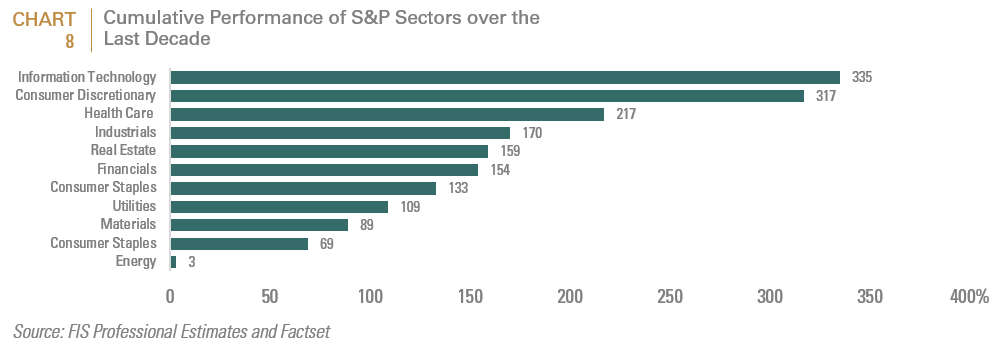
For most of the post GFC period, cyclical growth has underwhelmed and financial companies, particularly those outside of the U.S., have battled to repair their balance sheets. Whereas defensive companies such as healthcare and organically growing companies with strong balance sheets such as technology and consumer discretionary companies, have thrived (Chart 8).
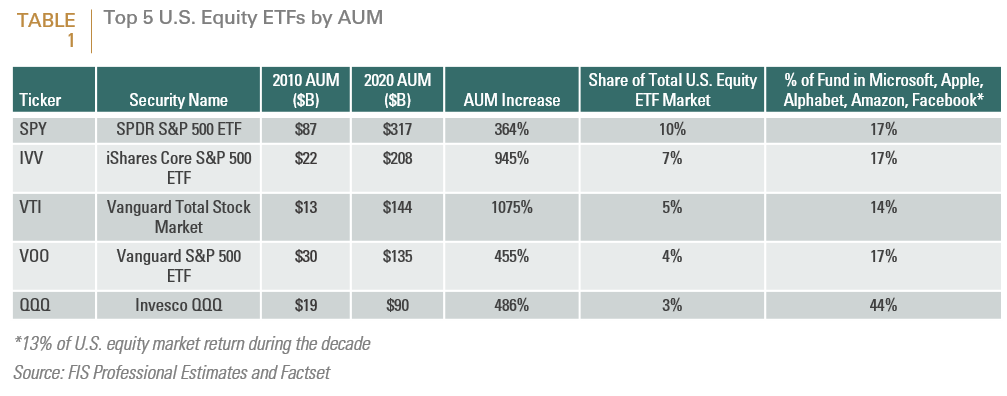
It’s also worth noting that the growing utilization of passive vehicles such as ETFs has further fueled fund flows into popular mega-cap growth stocks. Over that time, the investment environment has become more index, sector and factor focused, with new ETFs continually being launched to take advantage of the ‘hot’ market segment of the time. The table below depicts the 10-year asset growth in the five largest ETFs today. These five comprise almost 30% of the almost 4 trillion dollar ETF market. Unsurprisingly, these ETFs are among the top holders of the popular mega-cap stocks that drove U.S equity performance since 2010. And if you look at the top owners of the outstanding shares of Facebook, Apple, Amazon or Alphabet today, the three ETF giants (Blackrock, Vanguard and State Street) own a whopping 14 to 17% in their funds (Table 1).
For the short to medium term horizon, there are countervailing factors that could drive relative sector performance. On the positive side, the manufacturing inventory drawdown cycle and China’s (a major consumer of industrial and commodity products) managed slowdown appeared to be bottoming prior to the undoubtedly growth dampening spread of the Coronavirus. But thus far, the vital signs for both are still tentative.
However, certain secular trends could be less supportive for U.S. equities’ sector composition. Consumer companies such as Amazon and technology companies such as Alphabet and Apple have benefited from a combination of light touch anti-trust regulation, favorable taxation as well as globalization, which expanded their markets and reduced labor costs. Chart 9 shows that 36% of S&P 500 companies’ margin improvements was attributable to declining effective tax rates, whilst another 30% was attributable to declining interest rates. Currently, the effective tax rate is at an all-time low through a blend of tax cuts and the use of tax havens. In light of the U.S.’s ballooning budget deficit, it is hard to believe that current tax rates for large corporations will not be challenged, should a Democratic candidate prevail in the 2020 Presidential election. Minimally, it is hard to imagine further tax cuts for the corporate sector, should the Republicans prevail.
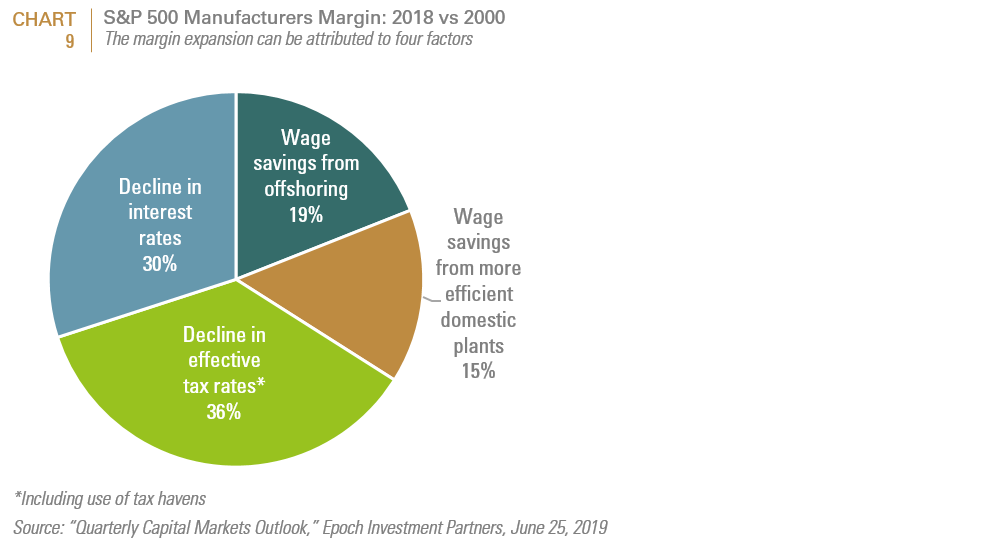
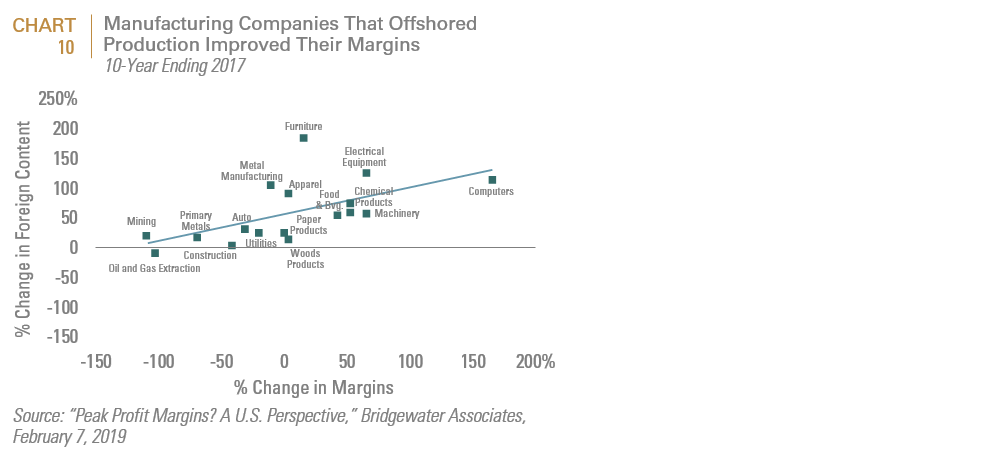
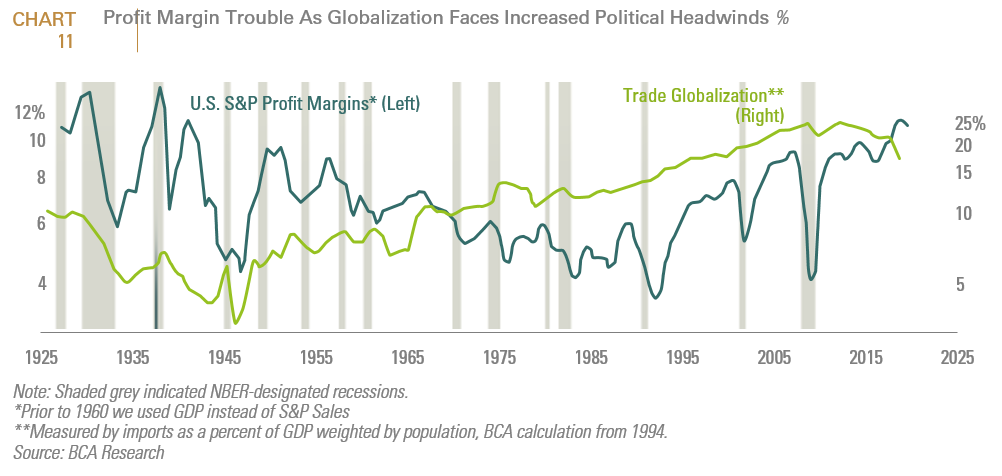
Wage savings attributable to offshoring allowed companies to improve their margins by another 19%. Not surprisingly, certain cyclical sectors as well as the computer sector were primary beneficiaries from this trend (Chart 10). However, globalization is clearly facing political headwinds, with the ongoing strategic and technological rivalry between China and the U.S. as well as the resurgence of more populist and mercantilist policies at both the executive and legislative branches. Whatever the geopolitical result might be, the economic impact of de-globalization will likely be reduced profit margins for companies that have benefited the most from globalized markets and supply chains; with technology being chief among them (Chart 11).
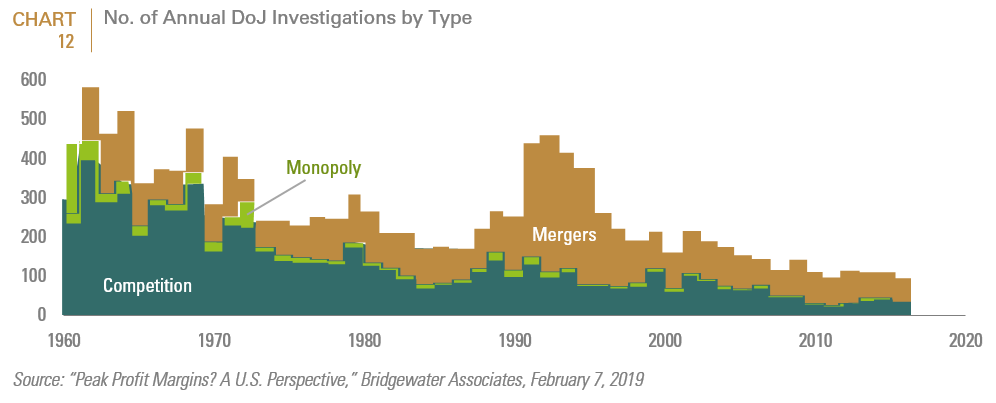
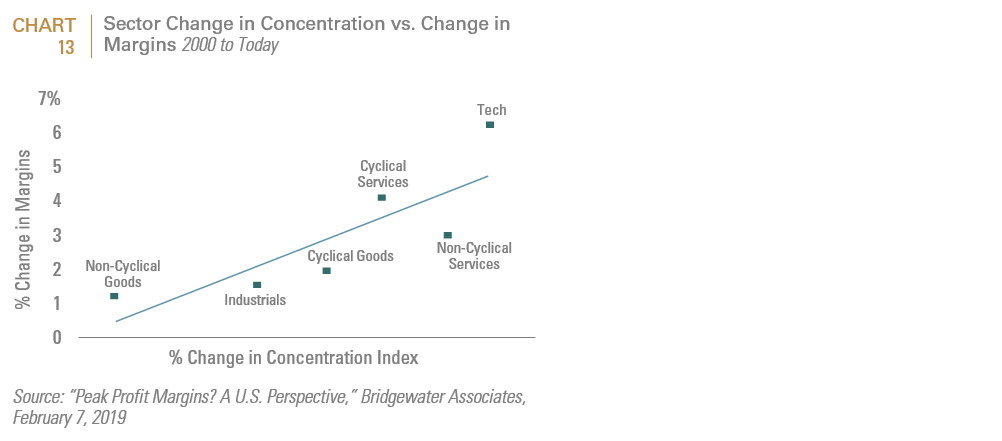
Technology stocks in general command a profit margin twice as high as the SPX. Consequently, 7 of the 10 largest capitalization companies are technology companies. In addition to the above referenced favorable dynamics, tech stocks in particular have also benefited from increased concentration and lighter regulatory oversight as the sector reaped the network and platform profits that accrued from consolidation (Chart 12 and Chart 13 continued on the next page). This is unsustainable and they will likely serve as easy prey for policymakers, particularly as income inequality and consumer discontent become even more potent political themes during the next recession. Moreover, the unfettered commoditization of consumer data, a linchpin of social media’s profit model is already under threat in Europe (through the EU General Data Protection Regulation (GDPR), which came into force on May 2018) and in California (which effects the Consumer Privacy Act in January 2020). These laws give consumers the right to know what information companies are collecting about them and who that data is shared with. They also allow consumers to ask technology companies to delete their data or not to sell it. While tech companies are likely to fight the new California law, and the US court system is a source of uncertainty, we believe the writing is on the wall. The EU is by some measures the largest consumer market on the planet. California is the largest US market. It is unlikely that the momentum behind consumer protection will change. FAANG stocks such as FB and GOOGL enjoy margins that are 500 basis points higher than the broad tech sector. These risks introduce a severe overhang for FAANG stocks as well as the S&P interactive media & services index that includes GOOGL and FB.
2. Capital Structure Management in an era of Declining Interest Rates
Declining interest rates were attributable for 30% of U.S. companies’ margin expansion. Declining interest rates can flatter earnings in two primary ways. First, for U.S. companies, financial leverage flatters earnings due to the interest tax shield that is afforded by the U.S. corporate income tax law; and second, by purchasing assets with debt capital, when they earn more than the cost of the debt that was used to finance them. Although declining interest rates were a global phenomenon, U.S. companies benefited from this trend much more as a result of greater financial leverage, particularly through share buyback programs. Accordingly, non-financial S&P 500 companies began the decade (i.e., Jan 1, 2010) with a debt to equity ratio of .72 but ended with a debt to equity ratio of .831 (a 16% increase). For the equivalent periods, the debt to equity ratios for EAFE companies went from .725 to .671 (a 7.4% decrease); whilst for EM companies, the debt to equity ratios went from .45 to .48 (a 7.2% increase). The increased leverage not only flattered the relative return on equity (ROE) of U.S. companies but through share buybacks, flattered their stock price’s performance.
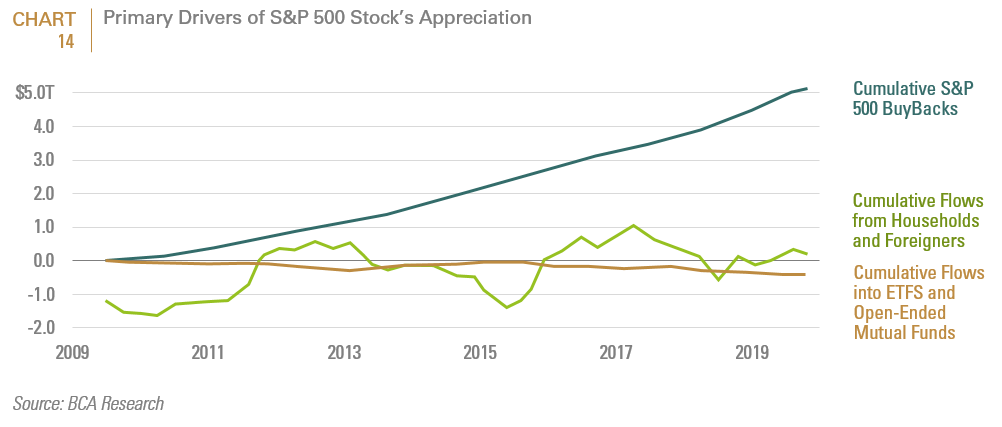
As shown in Chart 14, most of the flows to S&P 500 stocks were driven by share buy backs. With interest rates at historically low levels in the context of low unemployment and other late cycle dynamics, the question going forward is, is either margin expansion or share buy backs likely to continue at the same pace over the next market cycle? We think not.
3. A Cyclically Strong USD
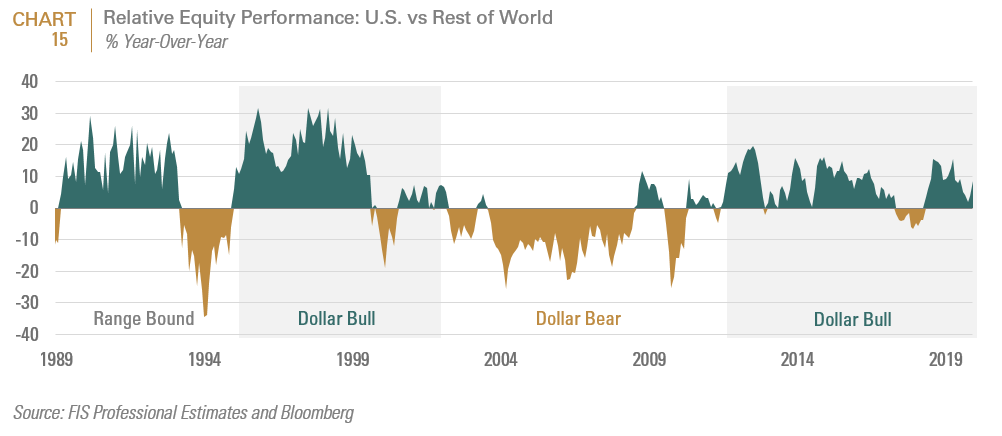
Since the early-1990s, performance leadership between U.S. and Non-U.S. Equities has rotated over four roughly ten-year cycles that are equivalent to the broad performance cycle of the U.S. dollar (Chart 15).
Over the last 50 years, the dollar has displayed roughly 15-year peak to peak (or trough to trough) cycles; with decade long bear markets punctuated by 5 to 6 year bull runs (Chart 16). The factors that have most prominently impacted the relative performance of the dollar include (see Inset):
- Nominal growth of the U.S. relative to the rest of the world (ROW)
- Monetary policy of the Fed relative to other major central banks
- Trend in current account and fiscal deficits
- Geopolitical uncertainty
- At the extremes, relative valuation
Inset: A 15 Year Retrospective on the U.S. Dollar
The following retrospective of the dynamics behind Chart 16 illustrates these factors. In the 1970’s, the greenback had a prolonged bear market prompted by inflationary forces that began with President Johnson’s expansionary “guns and butter” fiscal policy in the 1960s, continued with President Nixon’s jawboning of Fed Chairman Arthur Burns to accommodate his own fiscal expansionism as well as the OPEC oil embargo. In the early 1980’s, Fed Chairman Paul Volcker’s tight money policies to combat inflation led to a powerful dollar bull rally. By the mid 1980’s, however, the greenback had become grossly overvalued; the fiscal deficit had grown to a then unprecedented 3.3% of GDP, the U.S. economy was underperforming Japan, and there was a brewing trade war targeting Japan for its huge surplus and “unfair” trade practices. (Sound familiar?). The 1985 Plaza Accord, which led to concerted efforts to weaken the dollar, precipitated another bear market decade for the U.S. dollar. In the mid to latter half of the 1990s, the U.S. economy regained its crown as the global growth leader due to a booming tech sector, while Japan was struggling with post-bubble malaise, Germany was struggling with reunification and emerging markets were experiencing rolling debt crises. The dollar bear market; reversed in the mid 1990s for another bull run into the new millennium. The dollar bear market beginning in 2000 following the bursting of the tech bubble was also catalyzed by coordinated FX intervention in late 2000 in order to prop up a flagging Euro. During this period, growth leadership rotated to China, emerging markets and commodity producers. Moreover, the dollar was further undermined by exploding “twin deficits” (resulting from the combination of the Bush tax cuts and war spending) and loose monetary policy, which ultimately culminated in the bursting of the housing bubble in 2008.
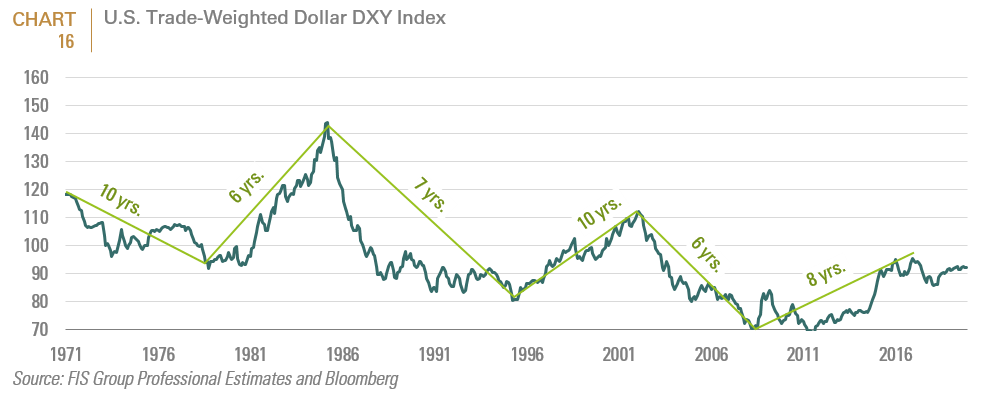
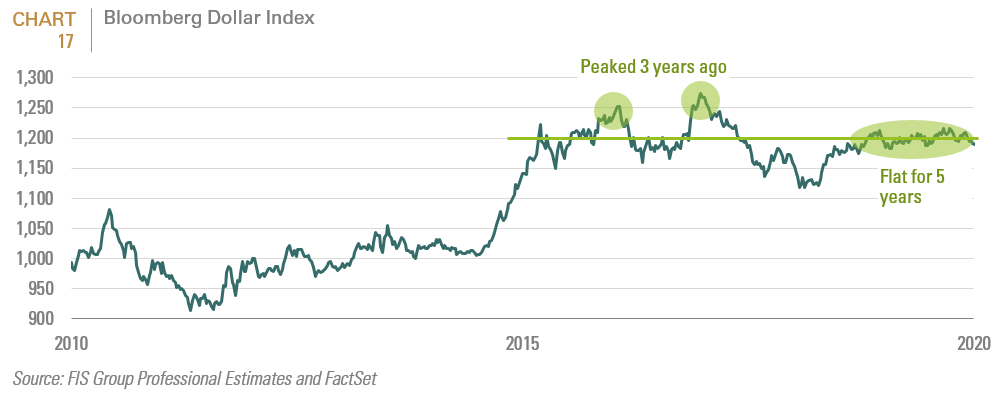
The most recent bull market in the dollar began in 2011, prompted by growth leadership shifting to the U.S. away from emerging markets and by elevated geopolitical concerns due to the European banking and sovereign debt crisis. While the recovery following the 2008/2009 recession was sub-par, the U.S. economy outperformed the rest of the developed world in relative terms. Consequently, the Fed was the only major central bank that was able to normalize monetary policy, beginning in 2013. From trough to peak, the dollar has rallied by almost 40%. However, for the last five years, it has been in a trading range; albeit at elevated levels relative to other major currencies, with the peak occurring in early 2016. Only time will tell whether this represents a multi-year churn in the context of an ongoing bull market or whether the last five years are part of a head and shoulders topping formation in anticipation of a new bear market. Based on the current backdrop, we would posit the latter; but believe that the greenback will remain suspended in a topping formation with a full blown bear market awaiting a deeper downturn in the U.S. economy (Chart 17).
The factors that we believe support our conclusion include:
A tentative diminution of geopolitical risk. Elevated geopolitical risk in the ROW was one of the catalysts for the dollar bull market which began in 2011. During much of the post GFC period (and particularly over the last 2 years), politics have favored the U.S. dollar with the currency emerging as the safe haven of choice. On this front, we see more downside than upside for the dollar in 2020. Some major props that have been supporting the US dollar have been knocked away. Brexit confusion kept sterling weak and weighed heavily on the euro. The prospect of higher tariffs has given the dollar a permanent bid and left the PBOC struggling to keep a floor under the renminbi. Moreover, as in the 1980’s (when Japan was the target), trade war tensions with China clearly favor a policy bias towards a weaker dollar. However another Middle East flare up or even the growing fears around the Coronavirus would add additional support for the U.S. dollar.
Tentative signs of a pickup in the global industrial cycle. Because the U.S. economy is less pro-cyclical, the U.S. dollar is a counter-cyclical asset. The positive turnaround in China’s fiscal and credit impulse, as well as early signs of revival for key sectors that have dragged down industrial production—electronics and autos—suggest a positive reversal in nominal GDP growth. Moreover, the FOMC’s October return to balance sheet expansion and the ECB’s resumption in November of open-ended quantitative easing means that for the first time since the QE era began, all three big developed economy central banks will be reflating global growth.
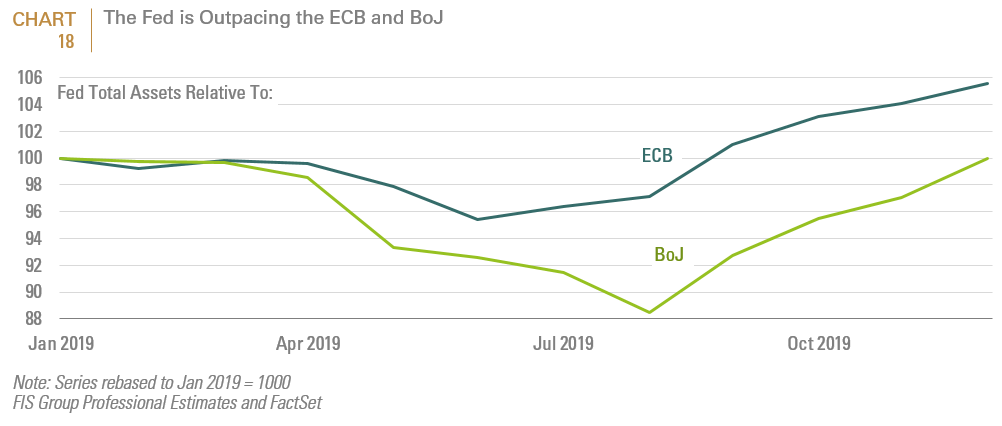
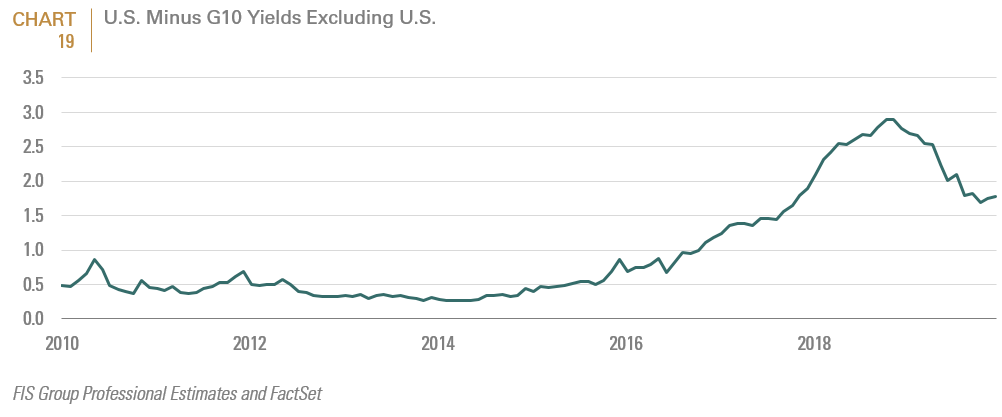
Divergence in Fed policy from other major central banks. Unlike the earlier QE period when the Fed was the first and only central bank to normalize monetary easing, the Fed is now printing money at a faster rate than the ECB. Additionally, the U.S. dollar’s yield advantage has diminished (Chart 18 and Chart 19). This suggests that the greenback may be set to weaken against the Euro. Moreover, as in the 1970’s, the White House is openly attempting to jawbone the Fed into maintaining loose monetary policy.
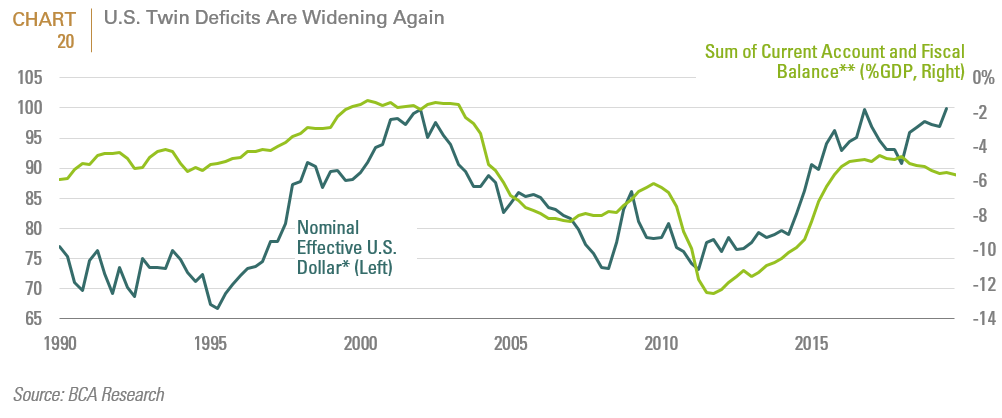
U.S. twin deficits are widening again. A rising twin deficit has rarely coincided with a secular dollar uptrend. Both in the mid-1980’ and in the 2000s, a ballooning twin deficit were factors in catalyzing a dollar bear market. The Trump tax cuts have pushed the fiscal deficit beyond $1 trillion. According to the CBO report in March 2019, since the tax bill went into effect, on a trailing 12-month basis the deficit has been $925 billion. Over the next five years, the U.S, Congressional Budget Office (CBO) estimates that the U.S. budget office will grow to 4.8% of GDP. Assuming no recession (and thus a stabilizing current account deficit), the twin deficits are likely to rise to a whopping 8% of GDP. It is worth noting that following the financial crisis, the twin deficit ballooned to 13% of GDP; but then the denominator (GDP) was depressed and that was the wake of the commodity boom, when the dollar was cheap and commodity currencies were overvalued. The CBO projects that the deficit will remain high even though the unemployment rate is very low; which is very concerning since when the economy slows or goes into a recession (and at some point in time it will) the deficit will balloon (Chart 20).
Closing Considerations for U.S. Allocators
Asset owners with long term liabilities typically base their strategic asset allocation decisions on equally long-horizon returns. Two methods provide useful context for understanding current valuations as a starting point for future long-horizon return paths. The first is the cyclically-adjusted price-to-earnings (CAPE) ratio and the second is the market capitalization to GDP ratio.
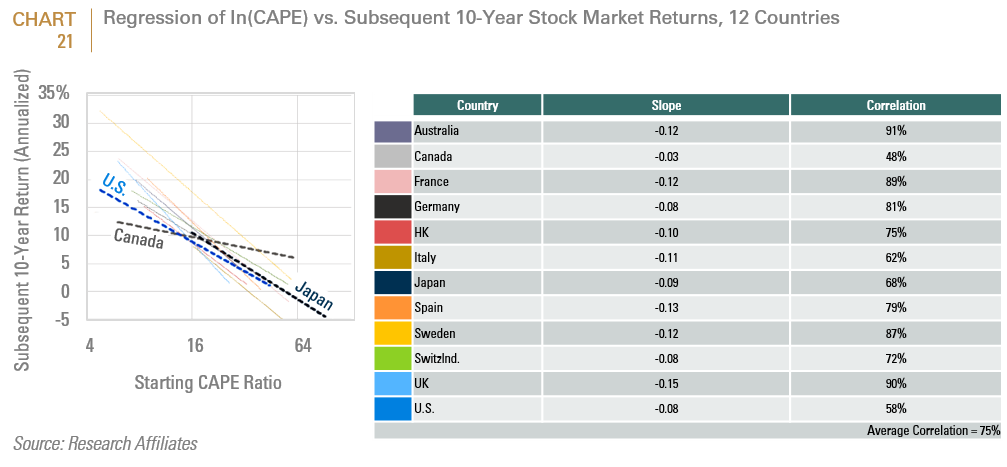
While the CAPE ratio has limited utility for market timing; many researchers have demonstrated that a strategy of investing in the cheapest countries in terms of CAPE outperforms a strategy of only investing in any one country market over the long term, including the U.S. equity market.2 Chart 21 regresses the CAPE for the 12 countries shown vs. their subsequent 10-year stock market returns. The analysis suggests that the link between starting valuations and subsequent returns is both negative and robust across different equity markets.
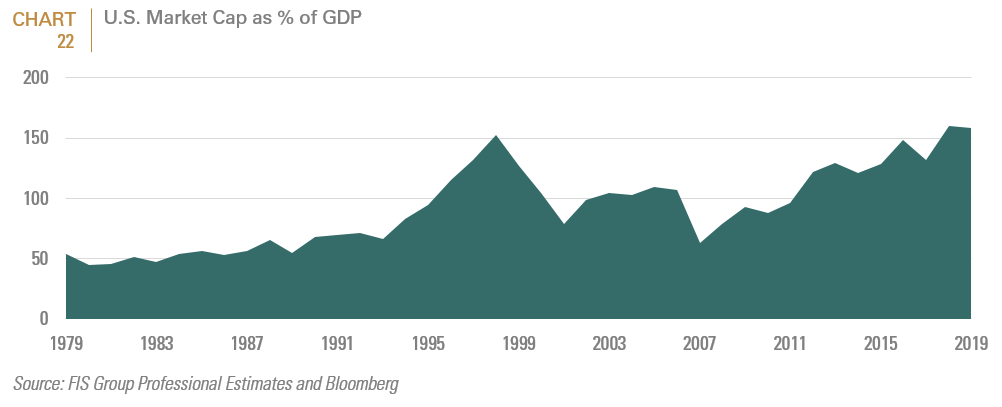
The stock market capitalization to GDP ratio was popularized by Warren Buffett two decades ago and is calculated by dividing the total market capitalization (approximated by the Wilshire 5000 index in the United States) by gross domestic product.3 By this metric, when share prices starts to outpace real economic output, (i.e. exceed 100%), a market is becoming overvalued. Current readings of the Market Cap to GDP ratios for U.S. equities ratio are now approaching 2000 levels (Chart 22).
Neither of these two ratios are perfect, but both are useful; which is why on should look at them together as they in a sense, smooth out each other’s flaws. The bottom line is that both ratios suggest that U.S. equities are richly valued.
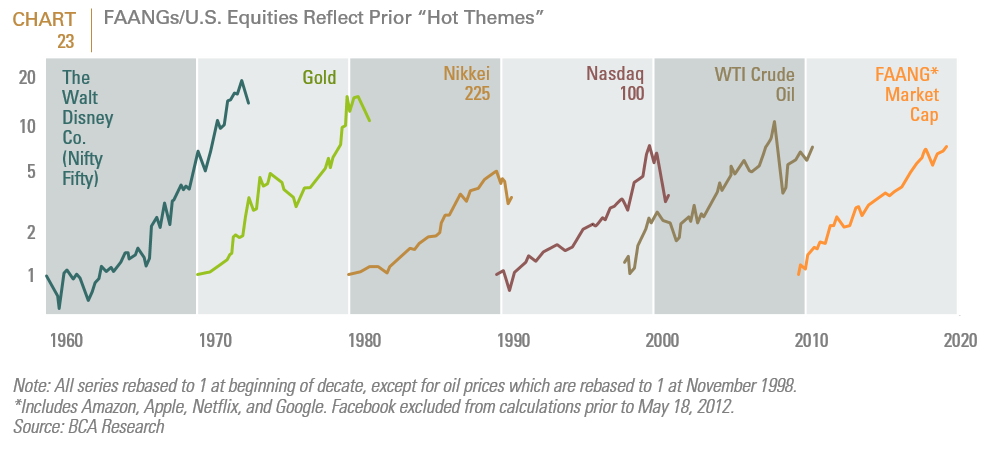
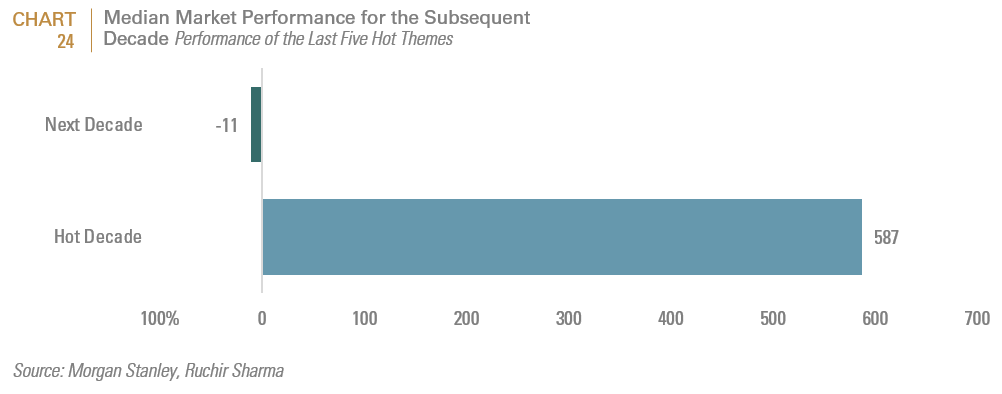
U.S. equities’ extreme outperformance mirrors prior decades in which a particular segment of the market grabbed a disproportionate share of both the attention and ultimately the capital of market participants (Chart 23). At the peak of each “hot theme”, it is natural for market participants to project its continued dominance into the future. Thus, in the mid-1980’s we were awash with the idea of Japan dominating the world. At the end of the 1990s, we were told that new economy dot.com stocks would defy financial logic. At the end of the 2000s, we were told to fret about “peak oil” and regaled the new age of emerging markets dominance; and so today, one would be tempted to project U.S. equities/FAANG stock dominance into our future asset allocation strategies. Moving into the next decade, however, history has not been kind to the earstwhile performance leaders (Chart 24).
While the bull run in FAANG stocks and by extension, U.S. equities, may still have further legs, given the challenging cyclical and secular dynamics underlying them, we recommend that asset owners continue to employ a globally diversified portfolio. Because capitalization weights would be expected to reflect the extreme outperformance of U.S. equities and growth stocks in particular, we would further recommend that investors consider using a combination of passive strategies that provide low cost exposure, complemented by active managers. Active managers are more likely to incorporate a valuation lens to the benchmark’s weights whilst identifying quality off benchmark companies that can be a ballast as the cycle inevitably turns.
[1] The debt/equity ratio measures a company’s financial leverage calculated by dividing its long-term debt by stockholders’ equity.
2 We recognize that the CAPE method has drawbacks. One could argue that accounting standards today are different than they were 10 years ago; that the sector make up of one index vs. the other can skew results: that PE ratios are higher today in part because interest rates are on a 40 year secular downtrend, and that the supply demand dynamics for stocks have changed. Currently, there is much more cash looking for an investment from mutual funds, hedge funds, ETFs, insurance companies, 401Ks and sovereign funds while there are fewer listed stocks in the U.S. than there were ten years ago. Each objection has merit. But what is undoubtable is that U.S. equities’ starting CAPE ratio suggests that a repeat of the last decade is unlikely, and that other markets provide a more attractive entry point.
3 The stock market cap to GDP ratio is also not without flaws. If corporations get a larger percentage of their profits from oversees, then the Capitalization/GDP ratio would overstate valuation. Since GDP measures economic output of publicly traded companies and private businesses, while the market capitalization is purely representative of the value of publicly traded companies; if a larger percentage of the economy shifts from private businesses to publicly-traded ones, then the nation’s total market capitalization would rise even if GDP growth stays flat. It has been well documented that the opposite has occurred over the last ten years in that more companies are choosing to either not list or delay listing. Therefore, this potential drawback would theoretically understate the Capitalization/GDP ratio.
Important Disclosures:
This report is neither an offer to sell nor a solicitation to invest in any product offered by FIS Group, Inc. and should not be considered as investment advice. This report was prepared for clients and prospective clients of FIS Group and is intended to be used solely by such clients and prospects for educational and illustrative purposes. The information contained herein is proprietary to FIS Group and may not be duplicated or used for any purpose other than the educational purpose for which it has been provided. Any unauthorized use, duplication or disclosure of this report is strictly prohibited.
This report is based on information believed to be correct, but is subject to revision. Although the information provided herein has been obtained from sources which FIS Group believes to be reliable, FIS Group does not guarantee its accuracy, and such information may be incomplete or condensed. Additional information is available from FIS Group upon request.
All performance and other projections are historical and do not guarantee future performance. No assurance can be given that any particular investment objective or strategy will be achieved at a given time and actual investment results may vary over any given time.