In a market filled with liquidity and searching eagerly for the next growth story, electric vehicle (EV) companies, and their supply chain are seeing a lot of flows. Most famously, Tesla shot up 7x in 2020 after finally turning a profit for the first time in its history. EV affiliated ETFs like KARS or DRIV have seen more pedestrian returns of 100-200% in the same time period.
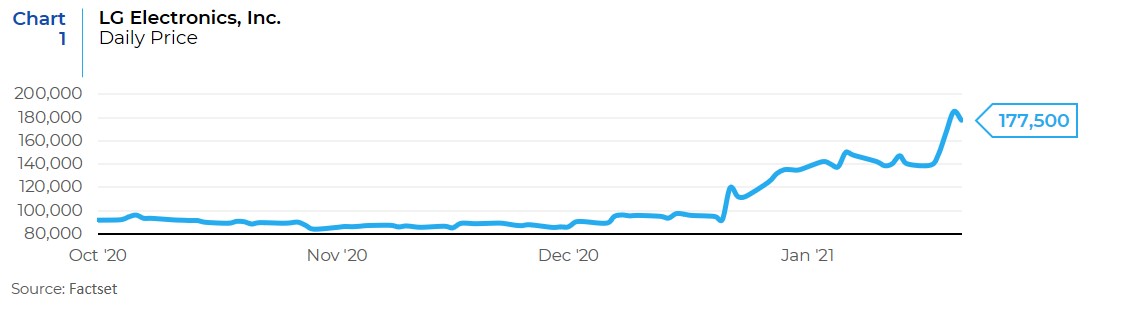
EV stocks in Asia have seen huge inflows too, at times equally ignorant of apparent fundamentals. In Korea, perennial value stock LG Electronics’ stock price doubled over the course of a single month after they recently announced a new JV in the EV business that would account for about 2% of their revenue (see Chart 1).
While fast momentum and lofty valuations feed fears of a bubble among many investors, this is clearly a growth sector. EV sales are accelerating fast, especially in China and Europe, with new technology and price decreases meaning that the total cost of ownership (the lifecycle cost of a car normalizing for reduced maintenance and fuel costs in EVs) of EV cars has hit parity with their combustion engine forebears.
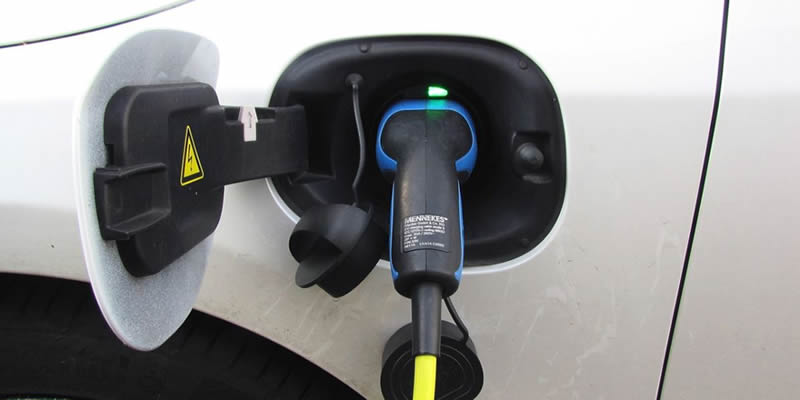
Tempering the enthusiasm is the reality that infrastructure for EVs still lags far behind the optimism. Recharging stations remain the providence of the wealthy or the provenance of a select few urban (also usually affluent) locales. So the notion of EV adoption across lower income countries still seems fanciful.
The exception to this may be in EV trucking. Given the predictability and repeat- ability of trucking routes, investments in fleet-specific recharging facilities dramat ically hasten the return on investment on such new capital expenditures. Indeed, this is already happening. EV fleets for Ambev in Brazil and SAB Miller in South Africa have recently joined scores of EV trucking fleets in China, to mention a few. In November 2020 a VC-backed startup in India announced it’s plans to launch a 1,000 truck EV fleet that will compete in India’s highly fragmented logistics sector.
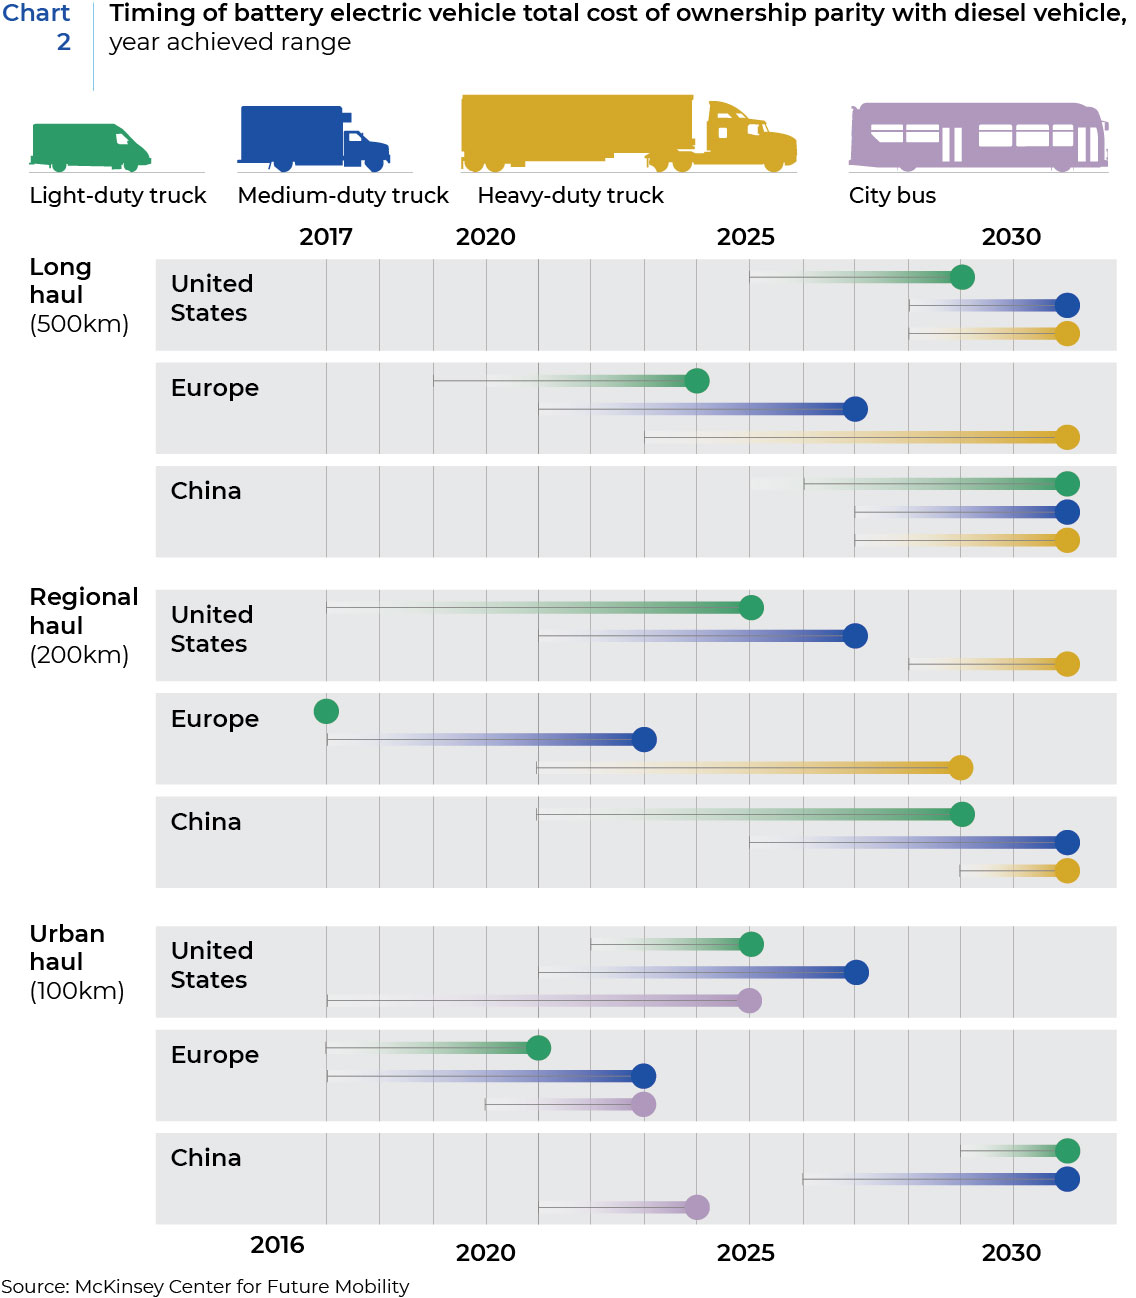
According to a 2017 McKinsey study, in Europe the total cost of ownership for EV trucks had already begun to hit parity with diesel trucks (see graphic below) for light and medium-duty vehicles running urban and regional freight (<200km). Projections are that China and the U.S. are not far behind. Importantly, the McK insey study’s total cost of ownership modeling also reflects the required costs of charging infrastructure and not just vehicle costs. While the McKinsey study focuses just on the three largest global markets in the U.S., China, and Europe, the U.S. comparison is perhaps most indicative for non-European emerging markets, given a comparable paucity of government subsi dies and tax incentives (see Chart 2).
Clearly there will be winners among EV vehicle makers and their suppliers; expectations that may now be at least partially priced in given recent market enthusiasm. But what are the second order effects? Beyond the initial capex expenditures of EV truck adoption, what broader economic im- pacts might this new technology bring?
Truly accurate estimates here are difficult to come by given the myriad of variables ranging from credit availability, interest rates, EV truck adoption rates, road network efficiency, population density, levels of fragmentation in a nation’s freight/logistics industry as well, (of course) as the variable cost of petrol across nations, which is itself a function of taxes, refining networks, compe tition, etc. But one simple proxy for the possible recurring economic gains is simply to estimate the percentage of GDP each country spends on diesel, which is primarily (though not exclusively) used by vehicles EV trucks seek to displace (and which was the point of comparison for the McKinsey study referenced in Chart 2), net of the added electricity expenditures at prevailing commercial rates. The results are below in Chart 3:
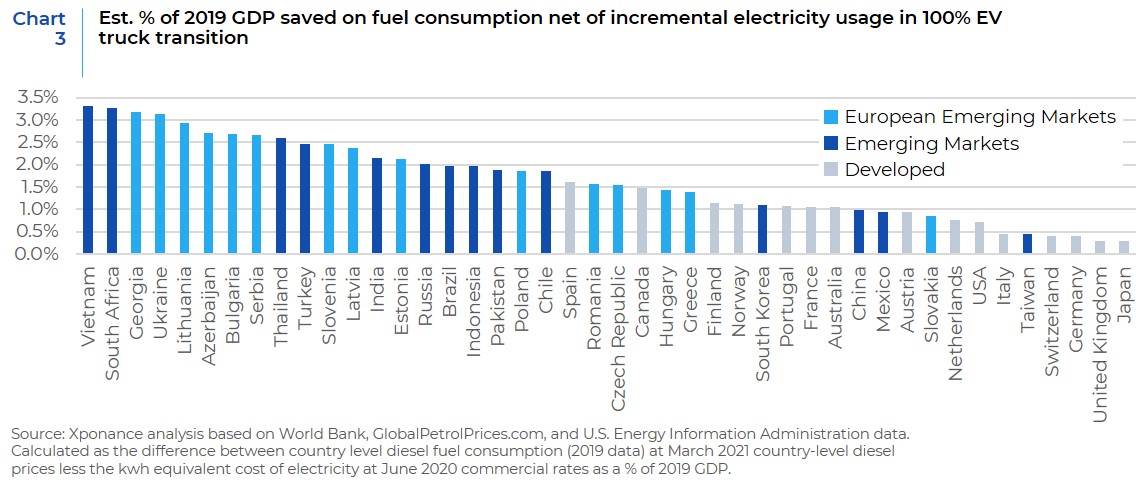
This model indicates that EV truck adoption will disproportionately benefit emerging markets 2-3x more than developed economies. For most of these markets EV truck adoption will mean improved balance of payments as they import less petrol, while also reducing the marginal cost of goods and thus adding to disinflationary pressures across the economy. Lower rates of inflation should also (all things being equal) allow interest rates to stay lower for longer, further enabling more investment at increasingly economical rates, further augmenting growth.
In assessing the economic benefits across markets, investors should also consider what countries might benefit sooner than others. Beyond some of the anecdotal evidence referenced above, data remains sparse. Early indications are that China has seen some of the largest levels of EV fleet adoption followed by developed European markets in Germany and Holland, spurred by government incentives. For EM investors this makes emerging European economies especially interesting on this front, as the spillover effects from European incentives and EU regulations spread to the lower income countries in the block for whom the economic benefits of EV truck adoption are greatest. East-central Europe in particular, with its higher population densities in the urban belt running from Warsaw to Belgrade (across Poland, Czech, Slovakia, Hungary, and Serbia), the returns on investment from EV fleet adoption portend more proximate economic gains. But at the top of the list, though is equally densely populated Vietnam, which among all investible markets globally stands to save the most in a theoretical conversion of their trucking fleet from diesel to electric.
Given the scale of potential economic benefits to some of these markets, investors across asset classes should take extra care to monitor the pace of adoption of EV trucks and begin to include the potentially significant follow-on effects in their economic forecasts.
This report is neither an offer to sell nor a solicitation to invest in any product offered by Xponance® and should not be considered as investment advice. This re- port was prepared for clients and prospective clients of Xponance® and is intended to be used solely by such clients and prospects for educational and illustrative purposes. The information contained herein is proprietary to Xponance® and may not be duplicated or used for any purpose other than the educational purpose for which it has been provided. Any unauthorized use, duplication or disclosure of this report is strictly prohibited.
This report is based on information believed to be correct, but is subject to revision. Although the information provided herein has been obtained from sources which Xponance® believes to be reliable, Xponance® does not guarantee its accuracy, and such information may be incomplete or condensed. Additional information is available from Xponance® upon request. All performance and other projections are historical and do not guarantee future performance. No assurance can be given that any particular investment objective or strategy will be achieved at a given time and actual investment results may vary over any given time.