
In our continuous effort to provide practical insights for selecting managers and building equity portfolios, we have started a thorough analysis to identify international equity managers with robust defensive qualities. The process is most challenging when you are trying to identify managers who reliably outperform during market drawdowns without underperforming by the same degree during subsequent market rallies. Our analysis shows that using return statistics was a reliable approach prior to 2022, before failing spectacularly. A deeper dive into holdings-based factor performance can improve your ability to identify defensive managers. The failure of the returns-based approach, along with some interesting dynamics observed in factor contributions, opens an extremely interesting avenue for future analysis. What role did the macroeconomic regime (inflation, top line growth, and interest rates) play in the “defensiveness” of strategies, and what can be done to avoid misclassifying strategies during sharp regime changes? This research brief presents our initial findings and highlights the interesting tangents that have emerged from our work. We plan to explore these areas throughout the year, sharing our insights as we proceed down the investment rabbit holes.
Return based Analysis
Universe
For the analysis, we used all non-US equity mutual funds with data from January 2007 through September 2022. While survivorship bias is present, the nature of the analysis minimizes the impact.
Bear Market Time Periods
We chose all periods in which MSCI EAFE was down greater than 15% from peak to trough using month end data.
- 4/30/2011 – 9/30/2011 (-22.4%)
- 6/30/2015 – 2/29/2016 (-16.8%)
- 1/31/2018 – 12/31/2018 (-17.9%)
- 12/31/2019 – 3/31/2020 (-22.8%)
- 12/31/2021 – 9/30/2022 (-27.1%)
Naïve Return Based Identification
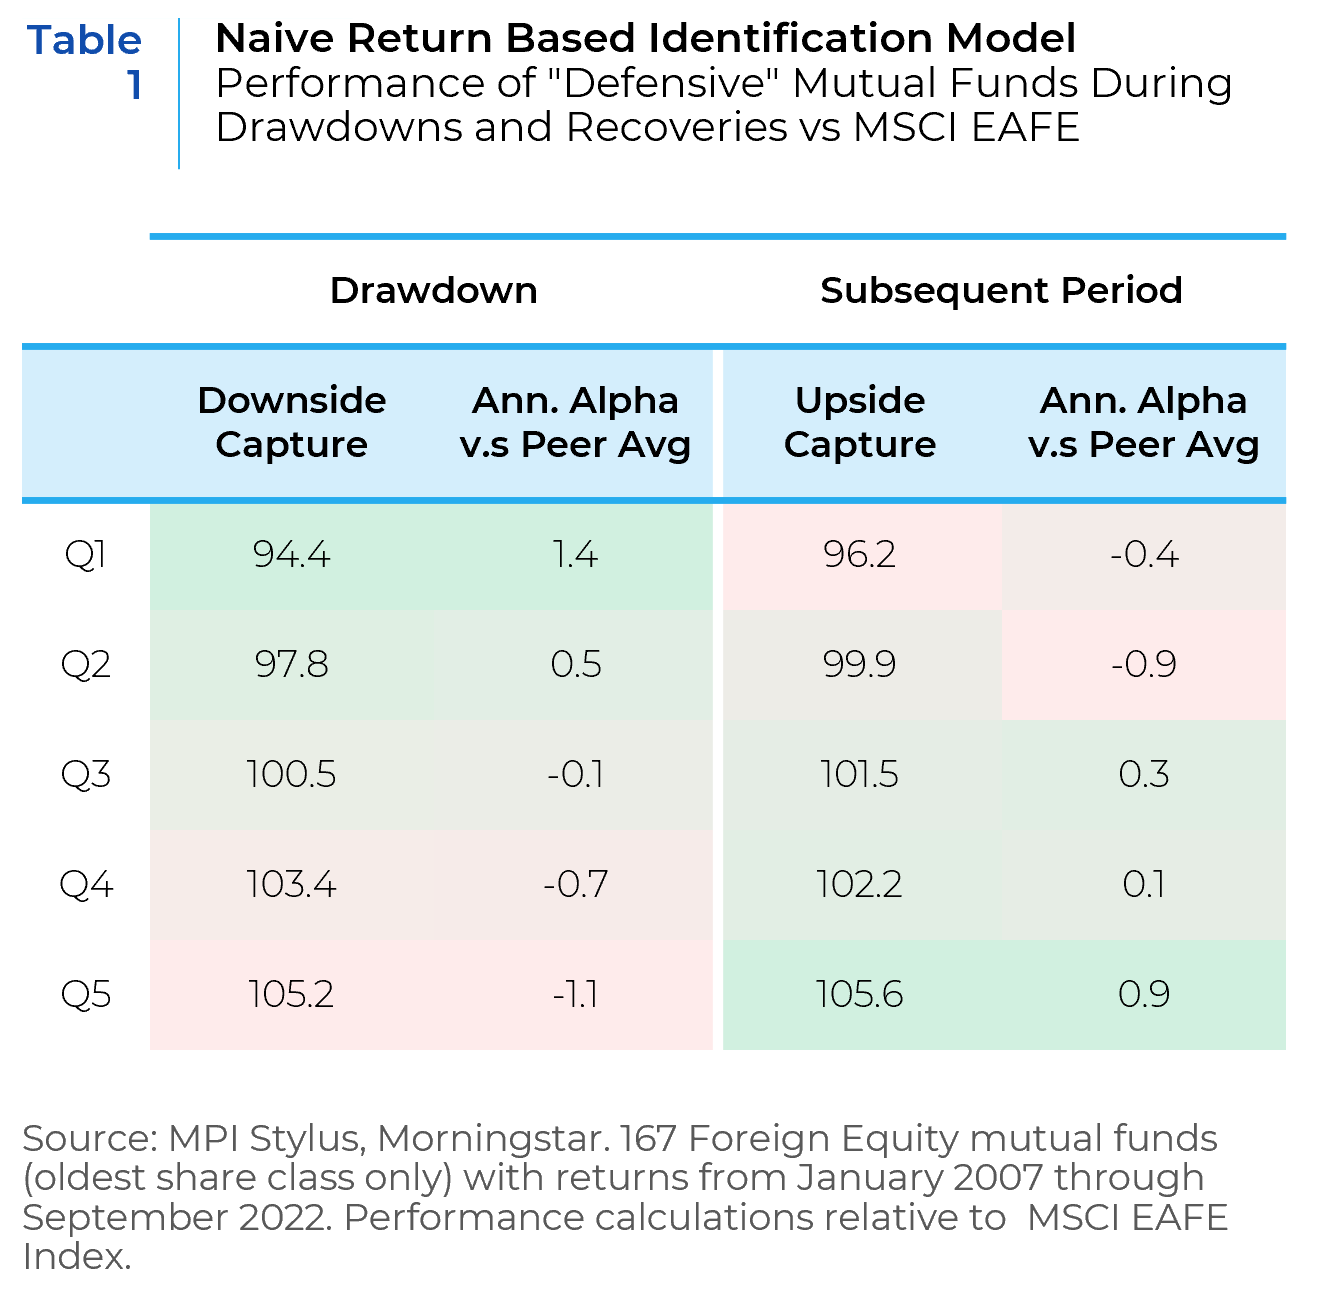
We tested various combinations of return-based downside risk metrics to identify “defensive” strategies (downside capture, downside deviation, batting average in down markets, beta, and volatility). The metrics are extremely correlated and did not provide a meaningfully different classification from using downside capture only, which we used for simplicity’s sake.
In our analysis, we calculated the cumulative downside capture for all funds vs the MSCI EAFE Index for the periods starting in March 2009 until the month prior to each drawdown. We categorized the funds into quintiles based on their performance on this metric. Following this, we calculated their downside capture and excess return during the drawdown. Then, we shifted our focus to the upside capture, measuring it (and excess return) for the period following each drawdown until the onset of the next drawdown (see Table 1).
Evaluating all periods together delivered expected outcomes. The most defensive managers, as measured by historical downside capture, protected capital the best during drawdown periods. In addition, these conservative managers gave up much of their excess return during the subsequent market recovery. These results were anticipated. Without concern for upside participation, identifying conservative managers can be done with a straightforward approach.
Controlling for market risk
Our next step was to control for the market risk of the managers in the analysis. Providing downside protection is only valuable if the product can also deliver near market returns during good times as well. With this step, we added a market sensitivity filter prior to sorting the products into quintiles (see Table 2). We only included products that had a historical beta of >.90 and upside capture of >90% over the same period as the downside capture was calculated in the first evaluation (138 funds remained).
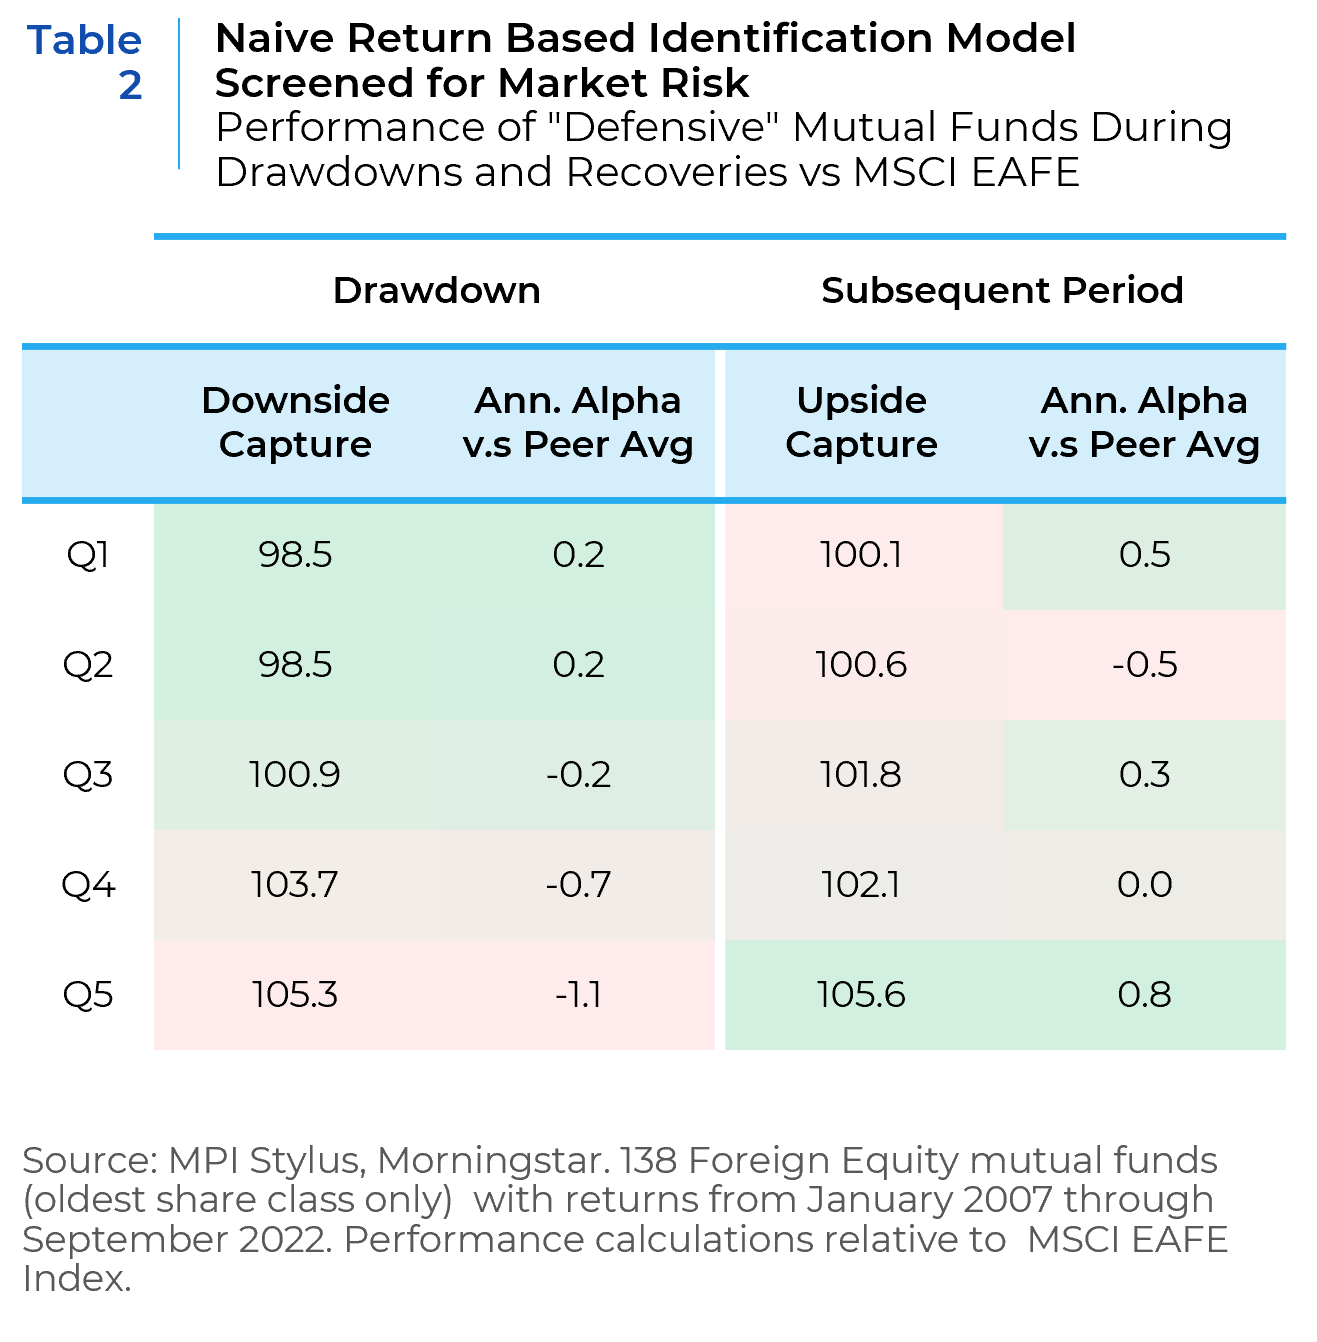
The same pattern appeared, with a muted magnitude, which was expected. While the aggregate numbers weren’t particularly insightful, a period-by-period analysis started to highlight some interesting dynamics (see Table 3).
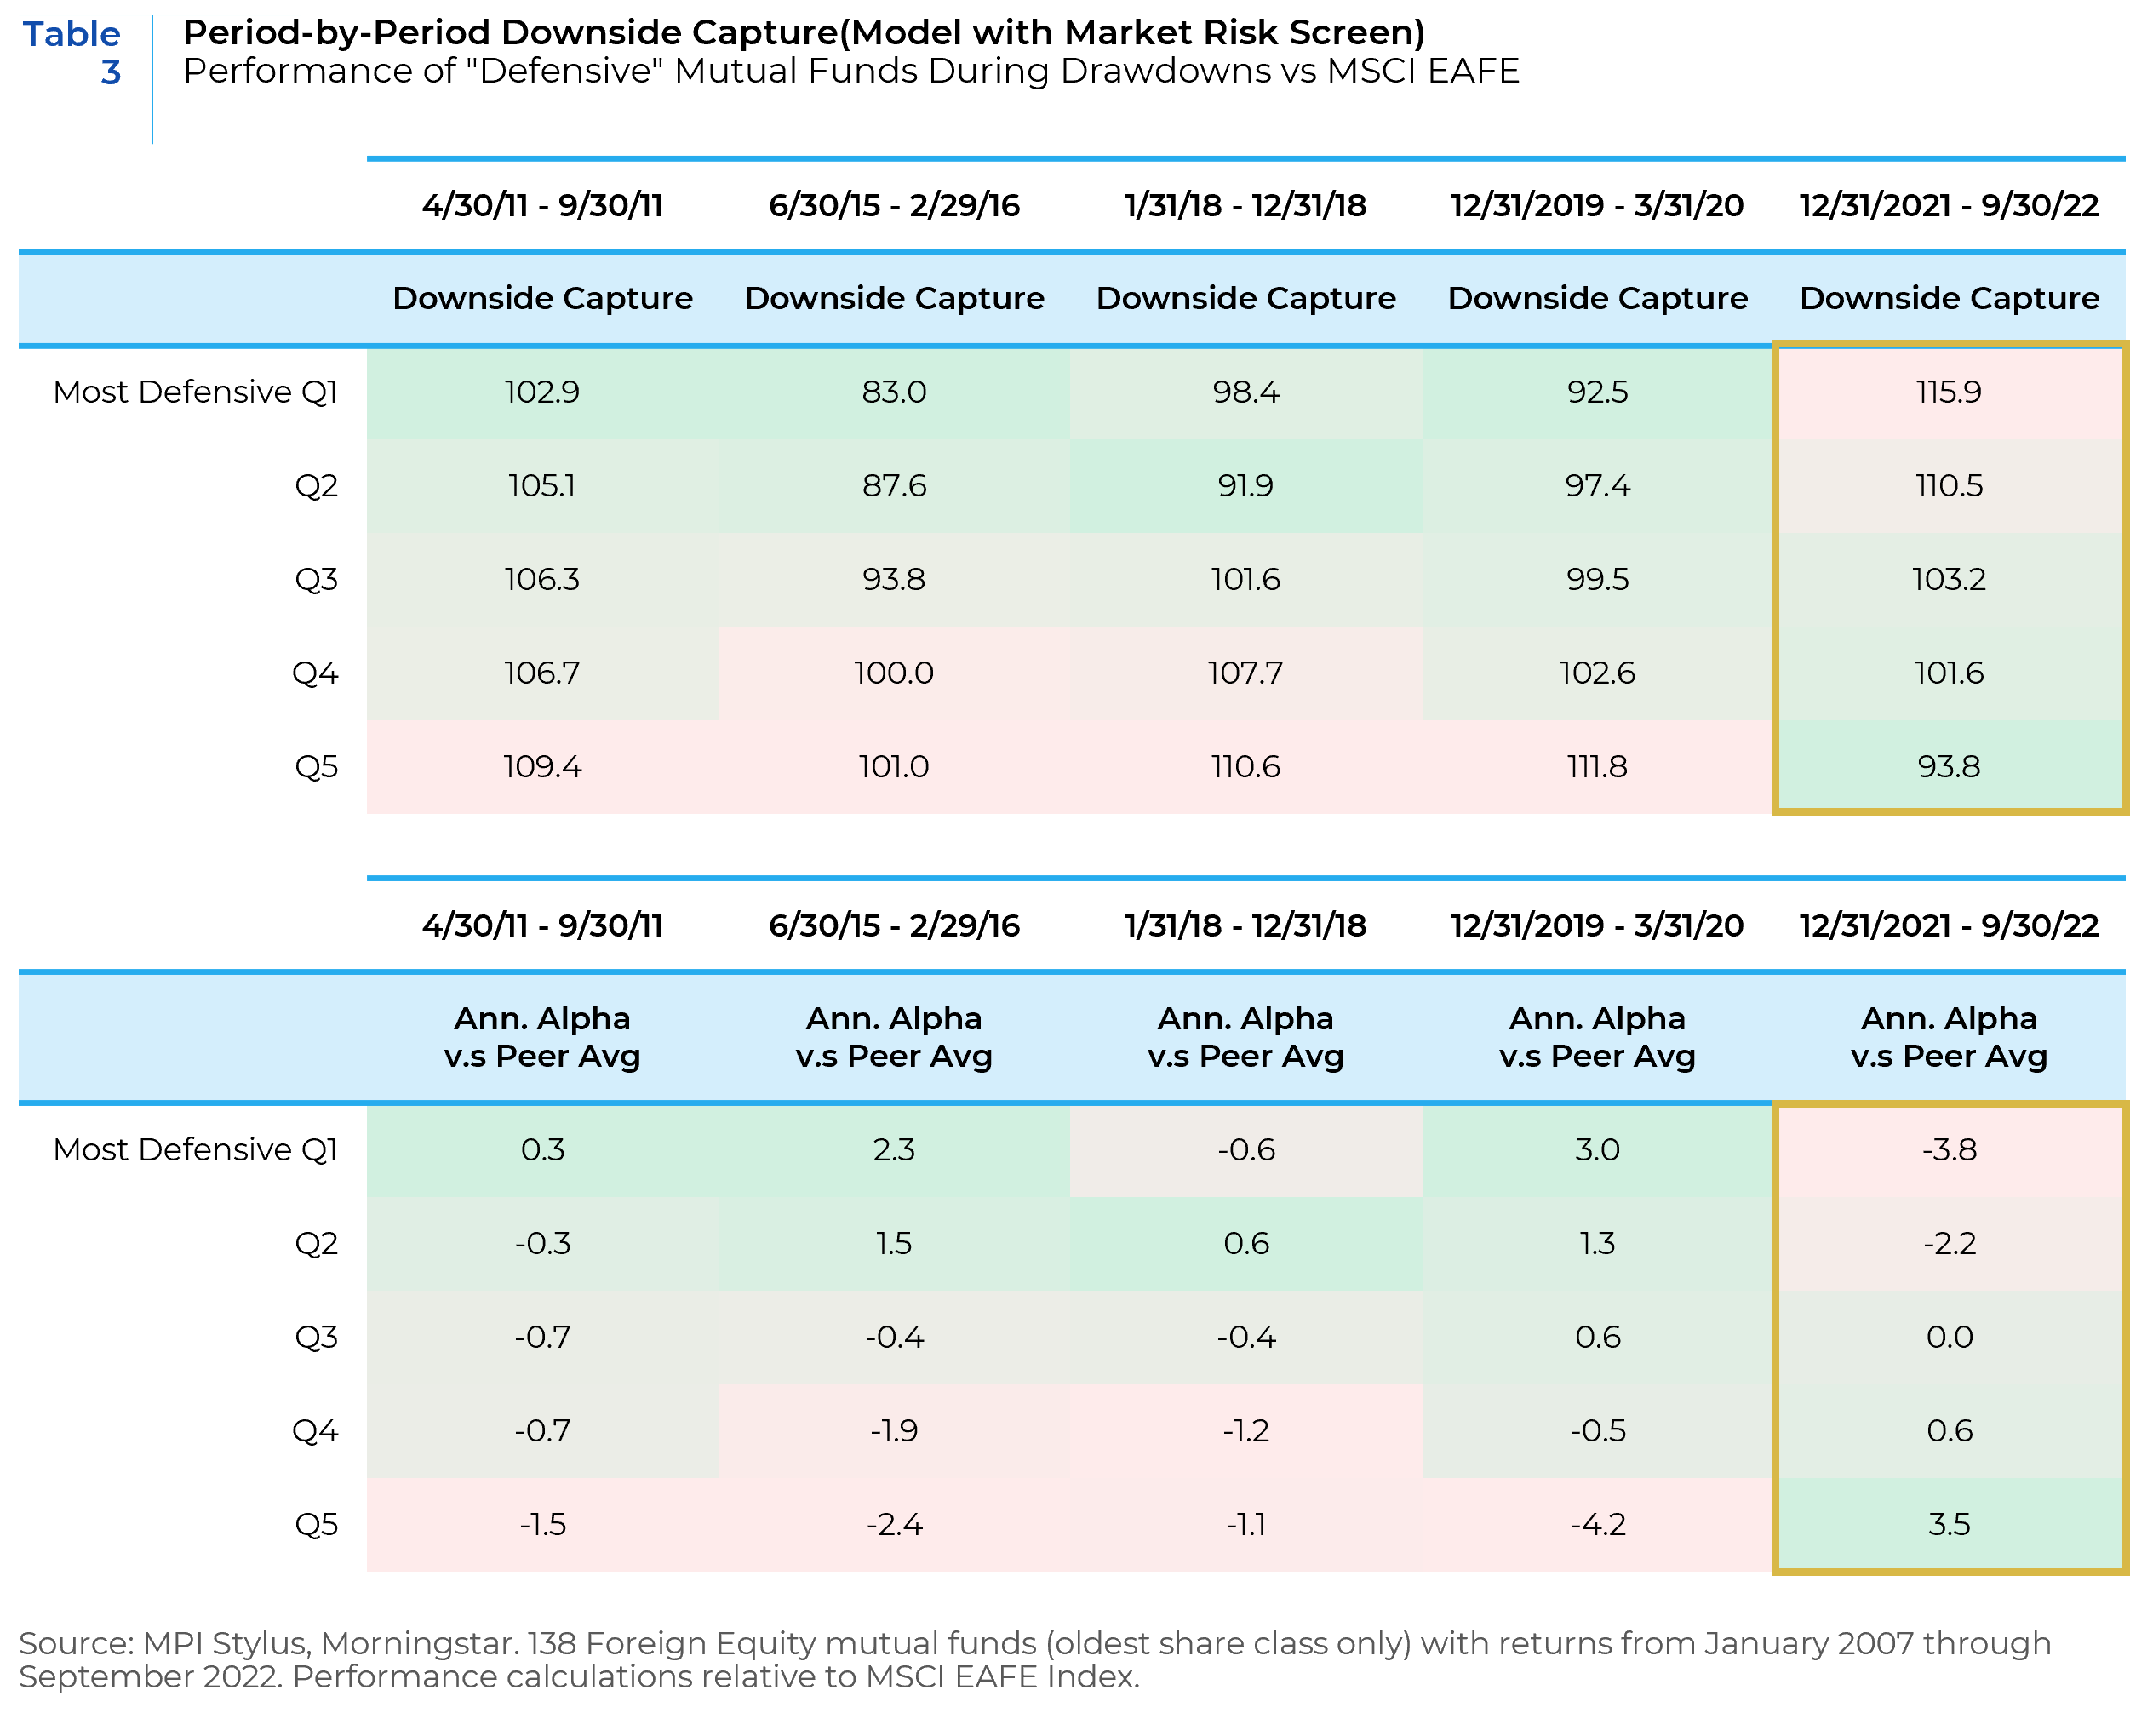
The funds with the best downside capture historically continued to protect capital better than peers in the first 4 time periods. Additionally, during 2019 and the rally in the latter part of 2020, the most defensive products outperformed during the next market rally. But this pattern reversed in spectacular fashion in the first 3Qs of 2022, as the most defensive funds under-performed during both the 12/31/2021 through 9/30/2022 drawdown period and the subsequent recovery between 9/30/2022 and 9/30/2023 (see Table 4).
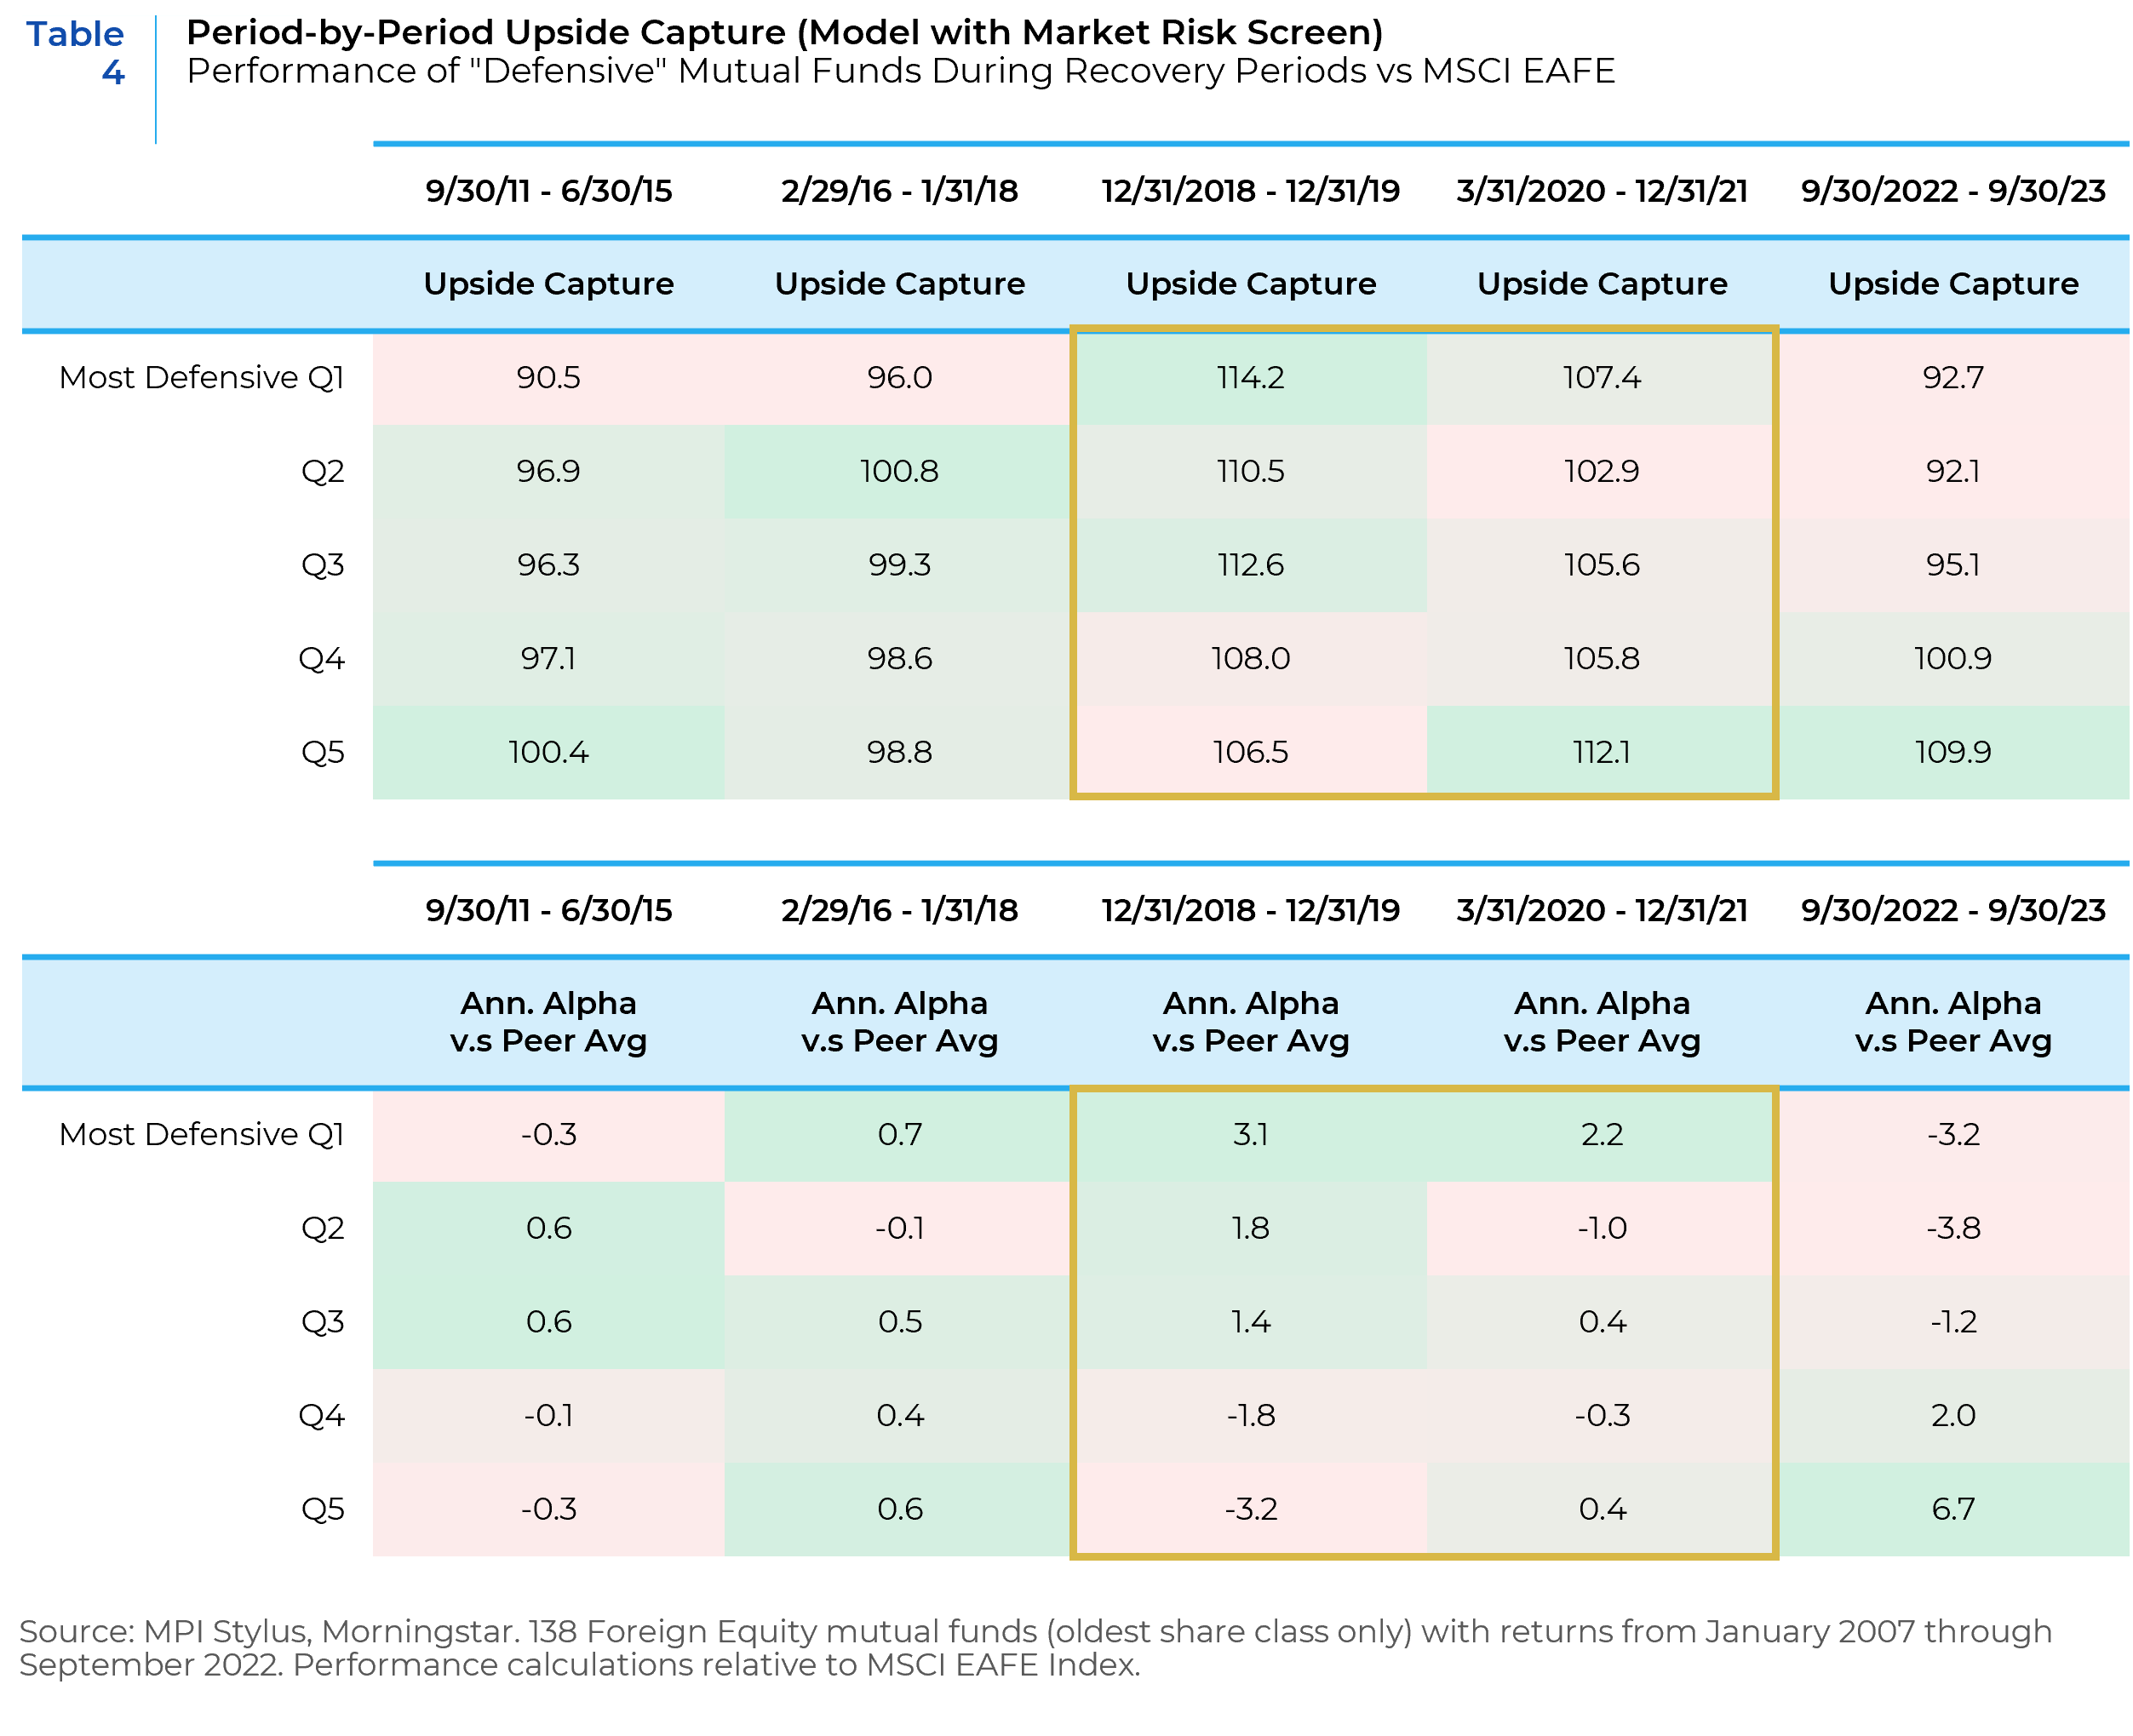
Our analysis suggests that using a fund’s track record to identify the defensiveness of a manager was a failure in 2022. That “mistake” was magnified when the process would have led to underperformance in both the market drawdown and the following recovery. What is not clear is the root cause of this failure, and what can be done to improve the process. The last 5 years have been marked by significant exogenous macro drivers and sharp changes to economic regimes. The question is whether this most recent period represents the dawn of a regime change in factor relationships or a temporary disruption to the pre-2020 pattern. The following sections focus on factor performance and dynamics. Can you use factor risk models to improve your selection of defensive managers? Could the dynamics of factor relationships help us understand the failure of return based downside risk measures in 2022?
Factor Returns
As we start to consider the possible mechanisms at play. It is important to understand the market backdrop more broadly. Below is a table showing the return of the MSCI EAFE index and various sector and style factors during the periods in question.
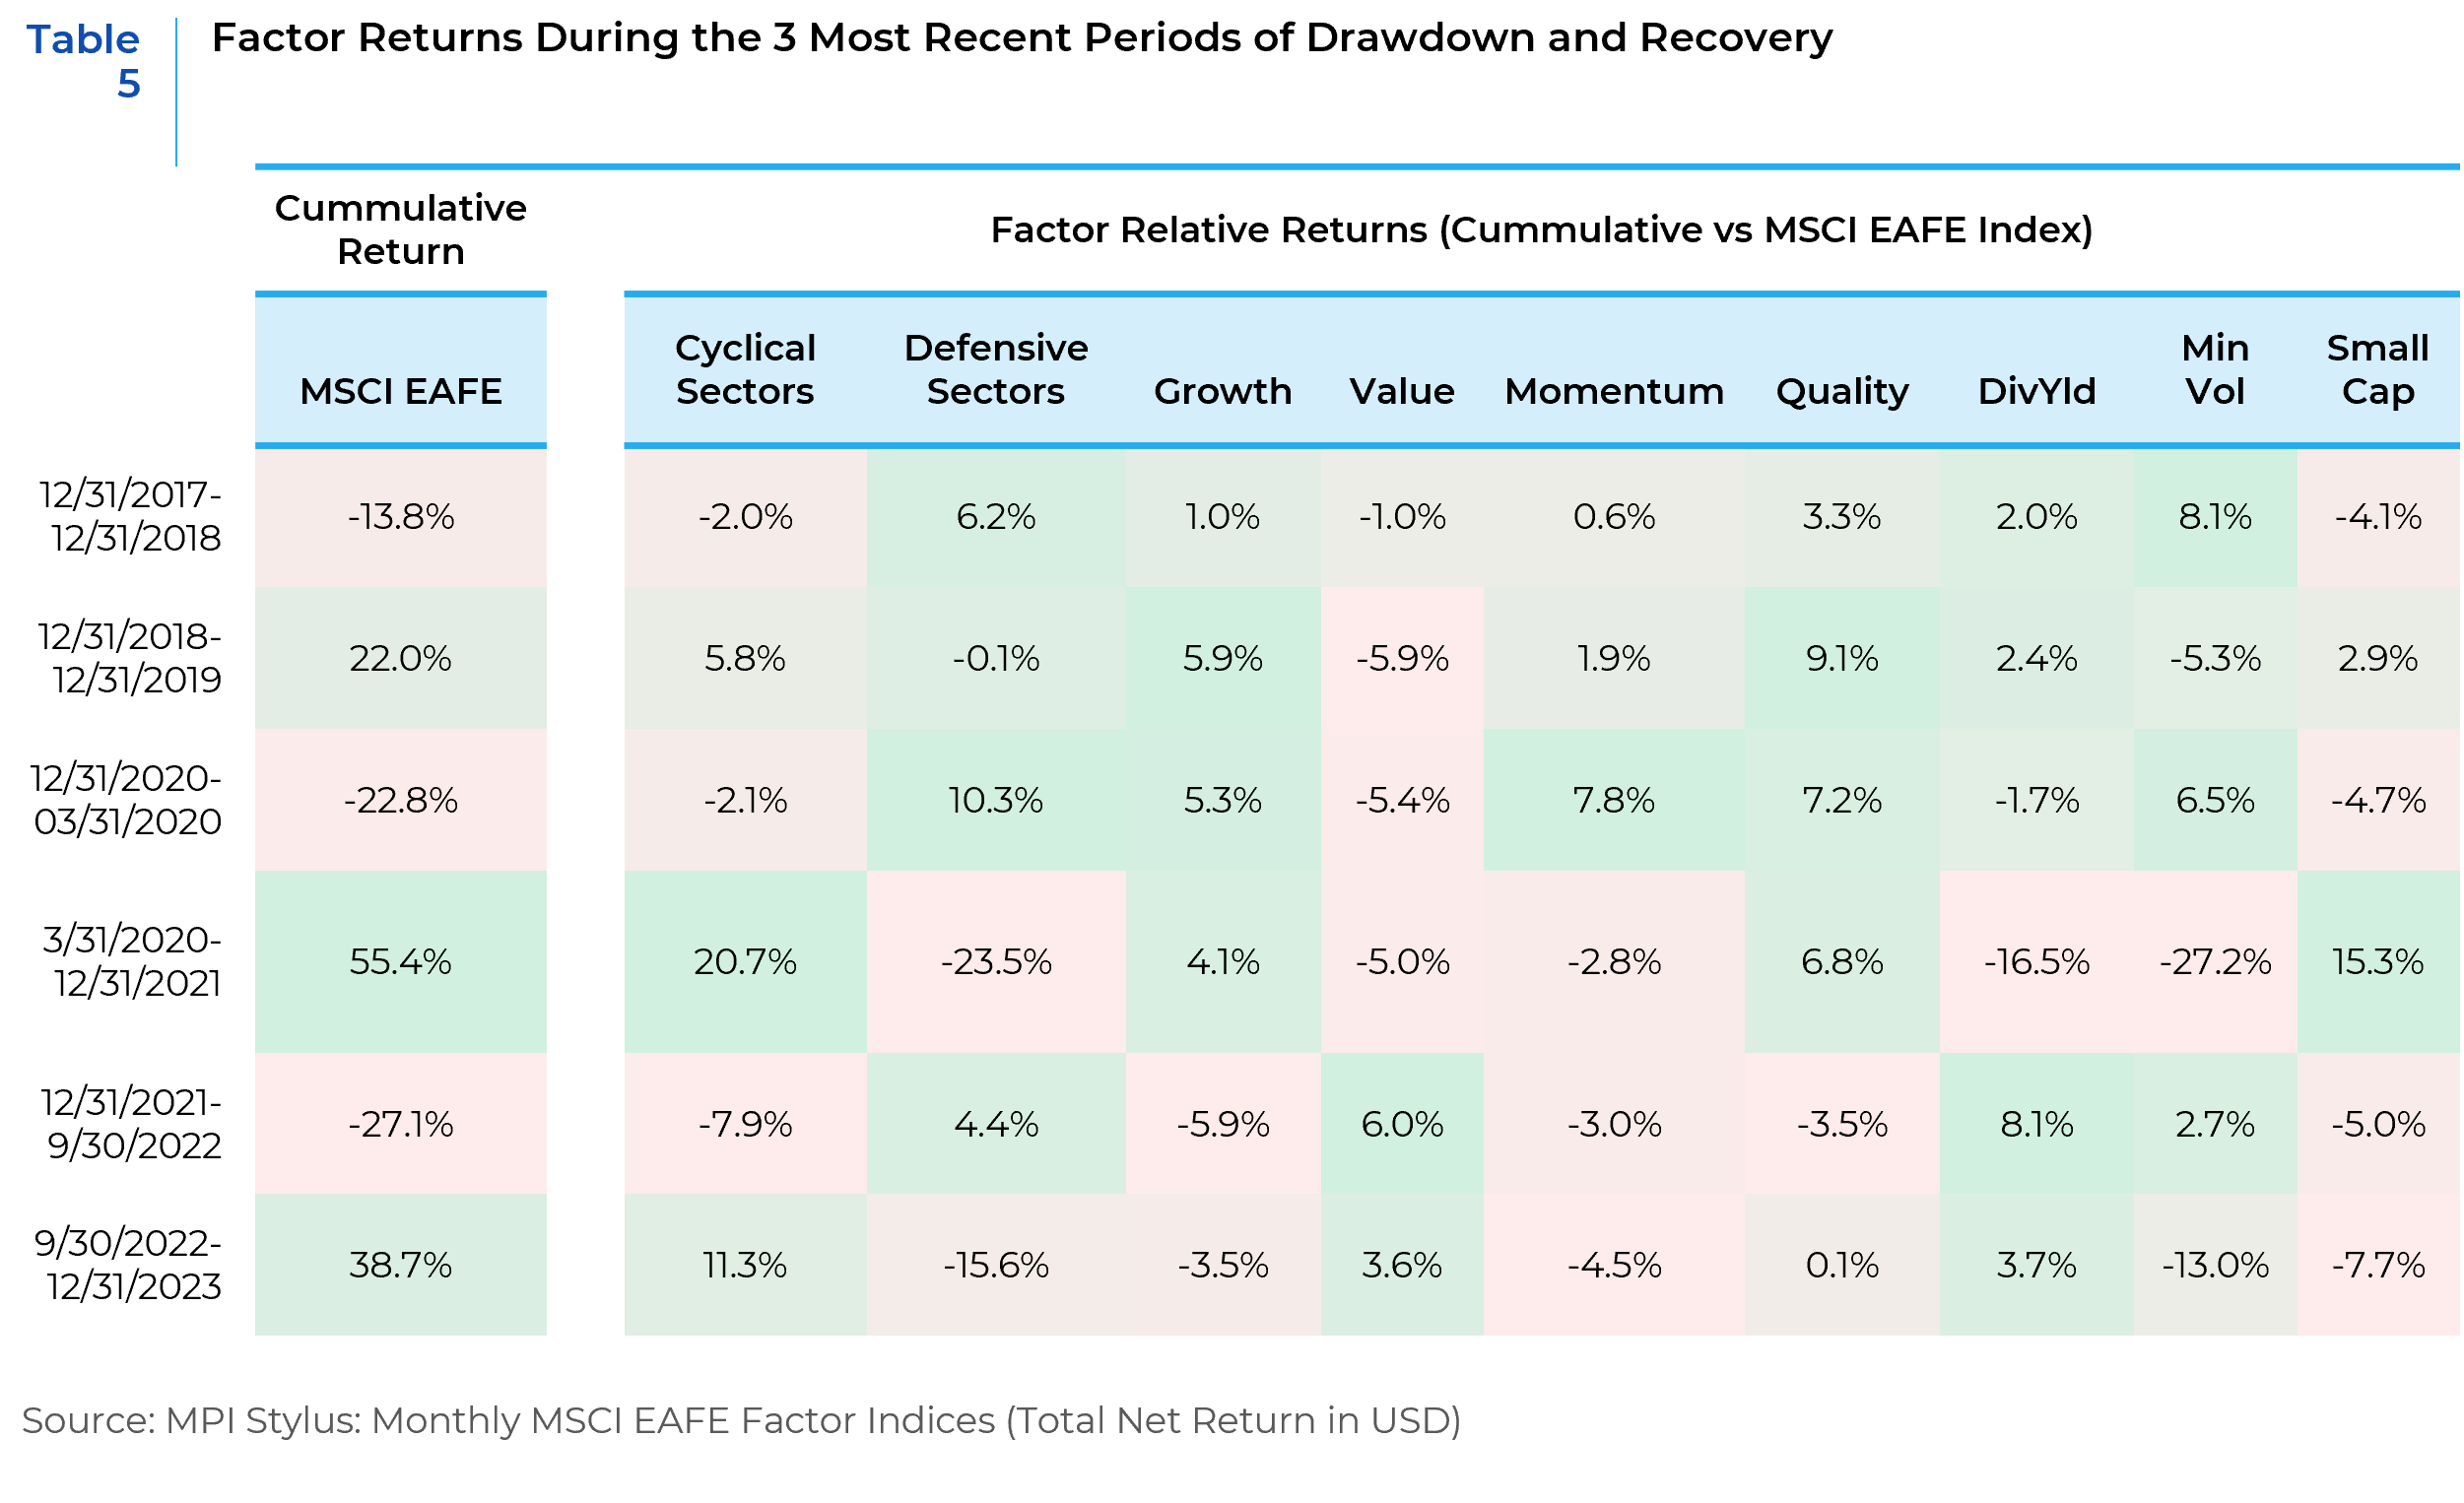
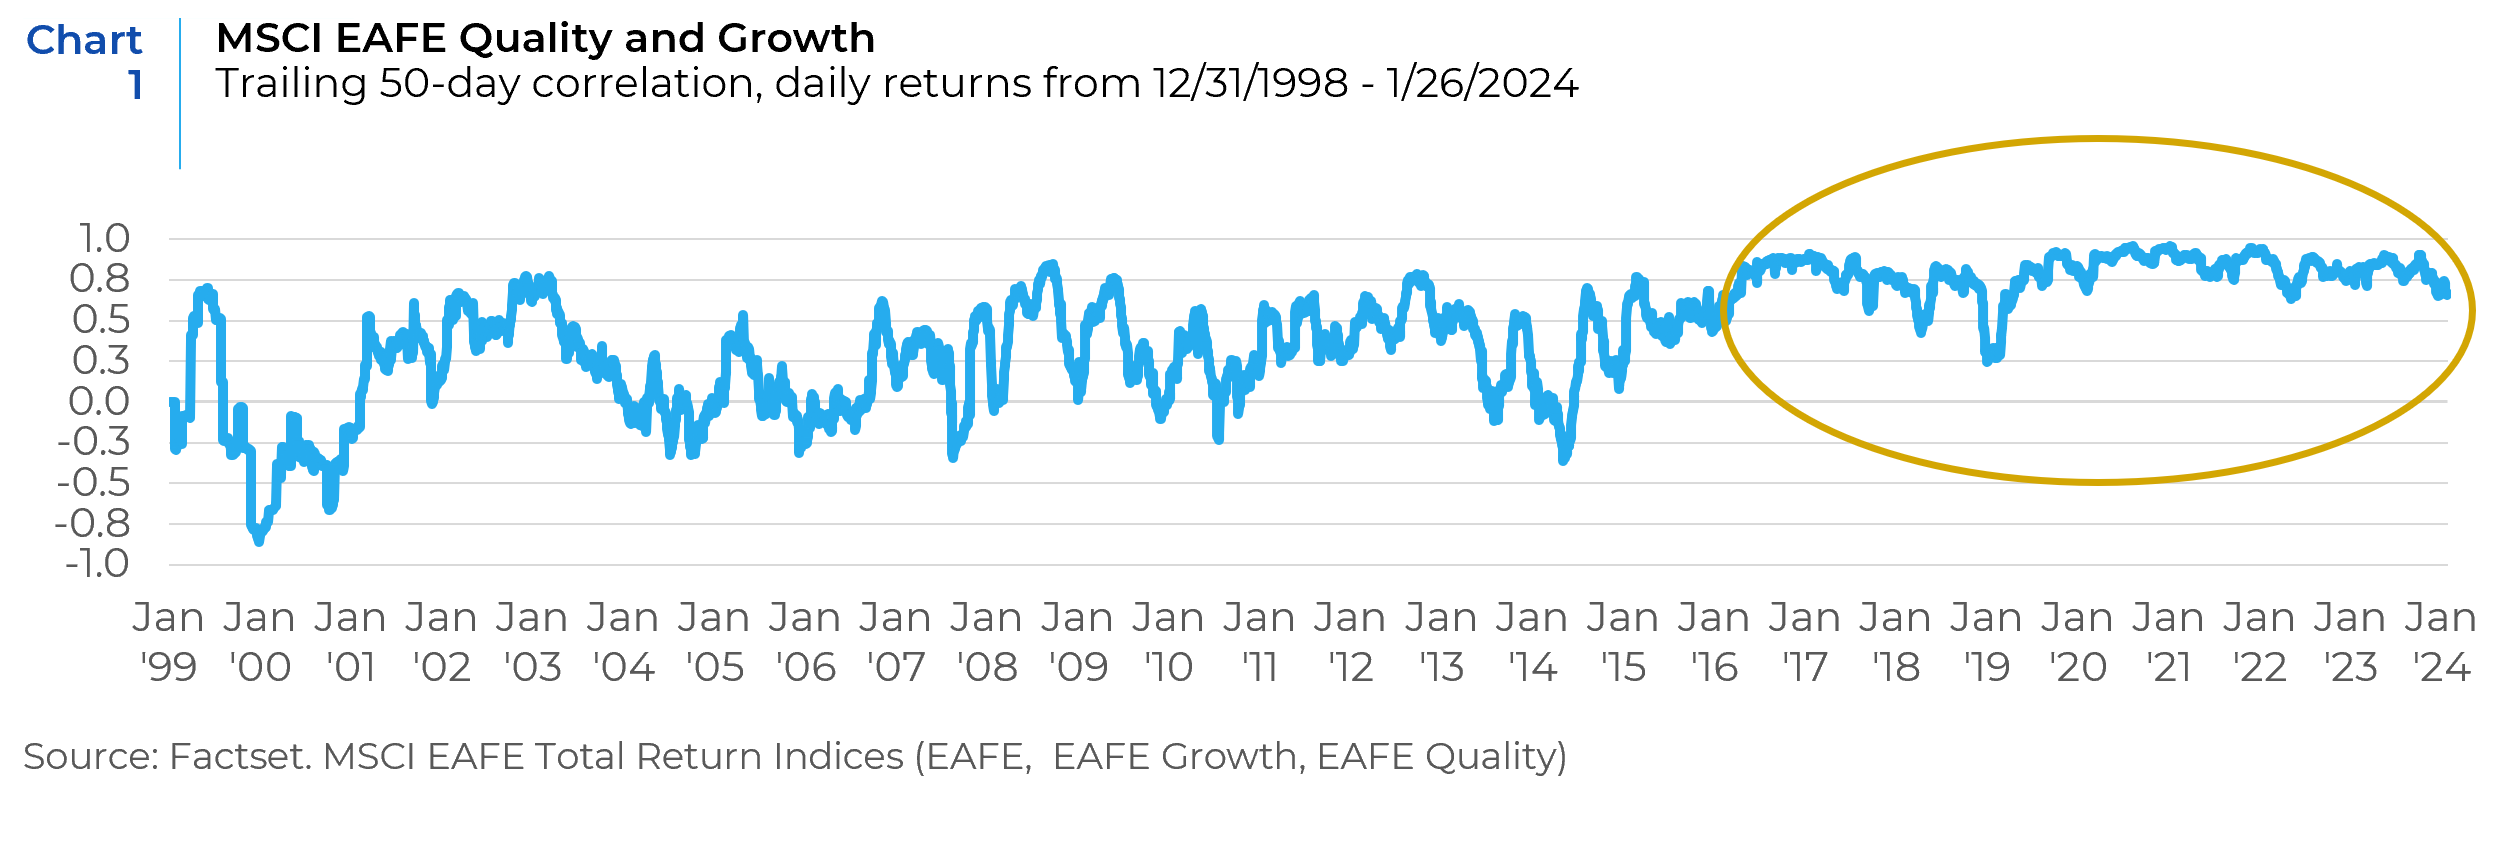
From 2017 through the end of 2021, quality and growth factor returns were immune to market drawdowns and a global pandemic. During the low inflation / zero interest rate policy of those years, the correlation between growth and quality increased and the volatility of that measure fell sharply.
This period coincided stagnant or falling hard-asset prices and/or anemic top-line growth. Beneficiaries were asset-lite businesses whose buoyant top-line growth and efficient supply chains enabled them to expand margins without requiring price increases for even the most cost-conscious consumers. These are traits we expect a “High Quality” manager to find attractive. In the absence of cyclical economic growth, these types of companies also attracted “High Growth” managers.
After a brief “recovery” of inflation above the 2% level in Europe and the UK, following the negative interest rate policies by the ECB and BoJ, inflation fell again in 2018, bottoming with deflation in 2020. In this period of slow growth, inflation, and hyper easy policy the “Quality Growth” profile previously outlined were in high demand, lowering their volatility and creating significant momentum in that cohort of quality growth stocks.
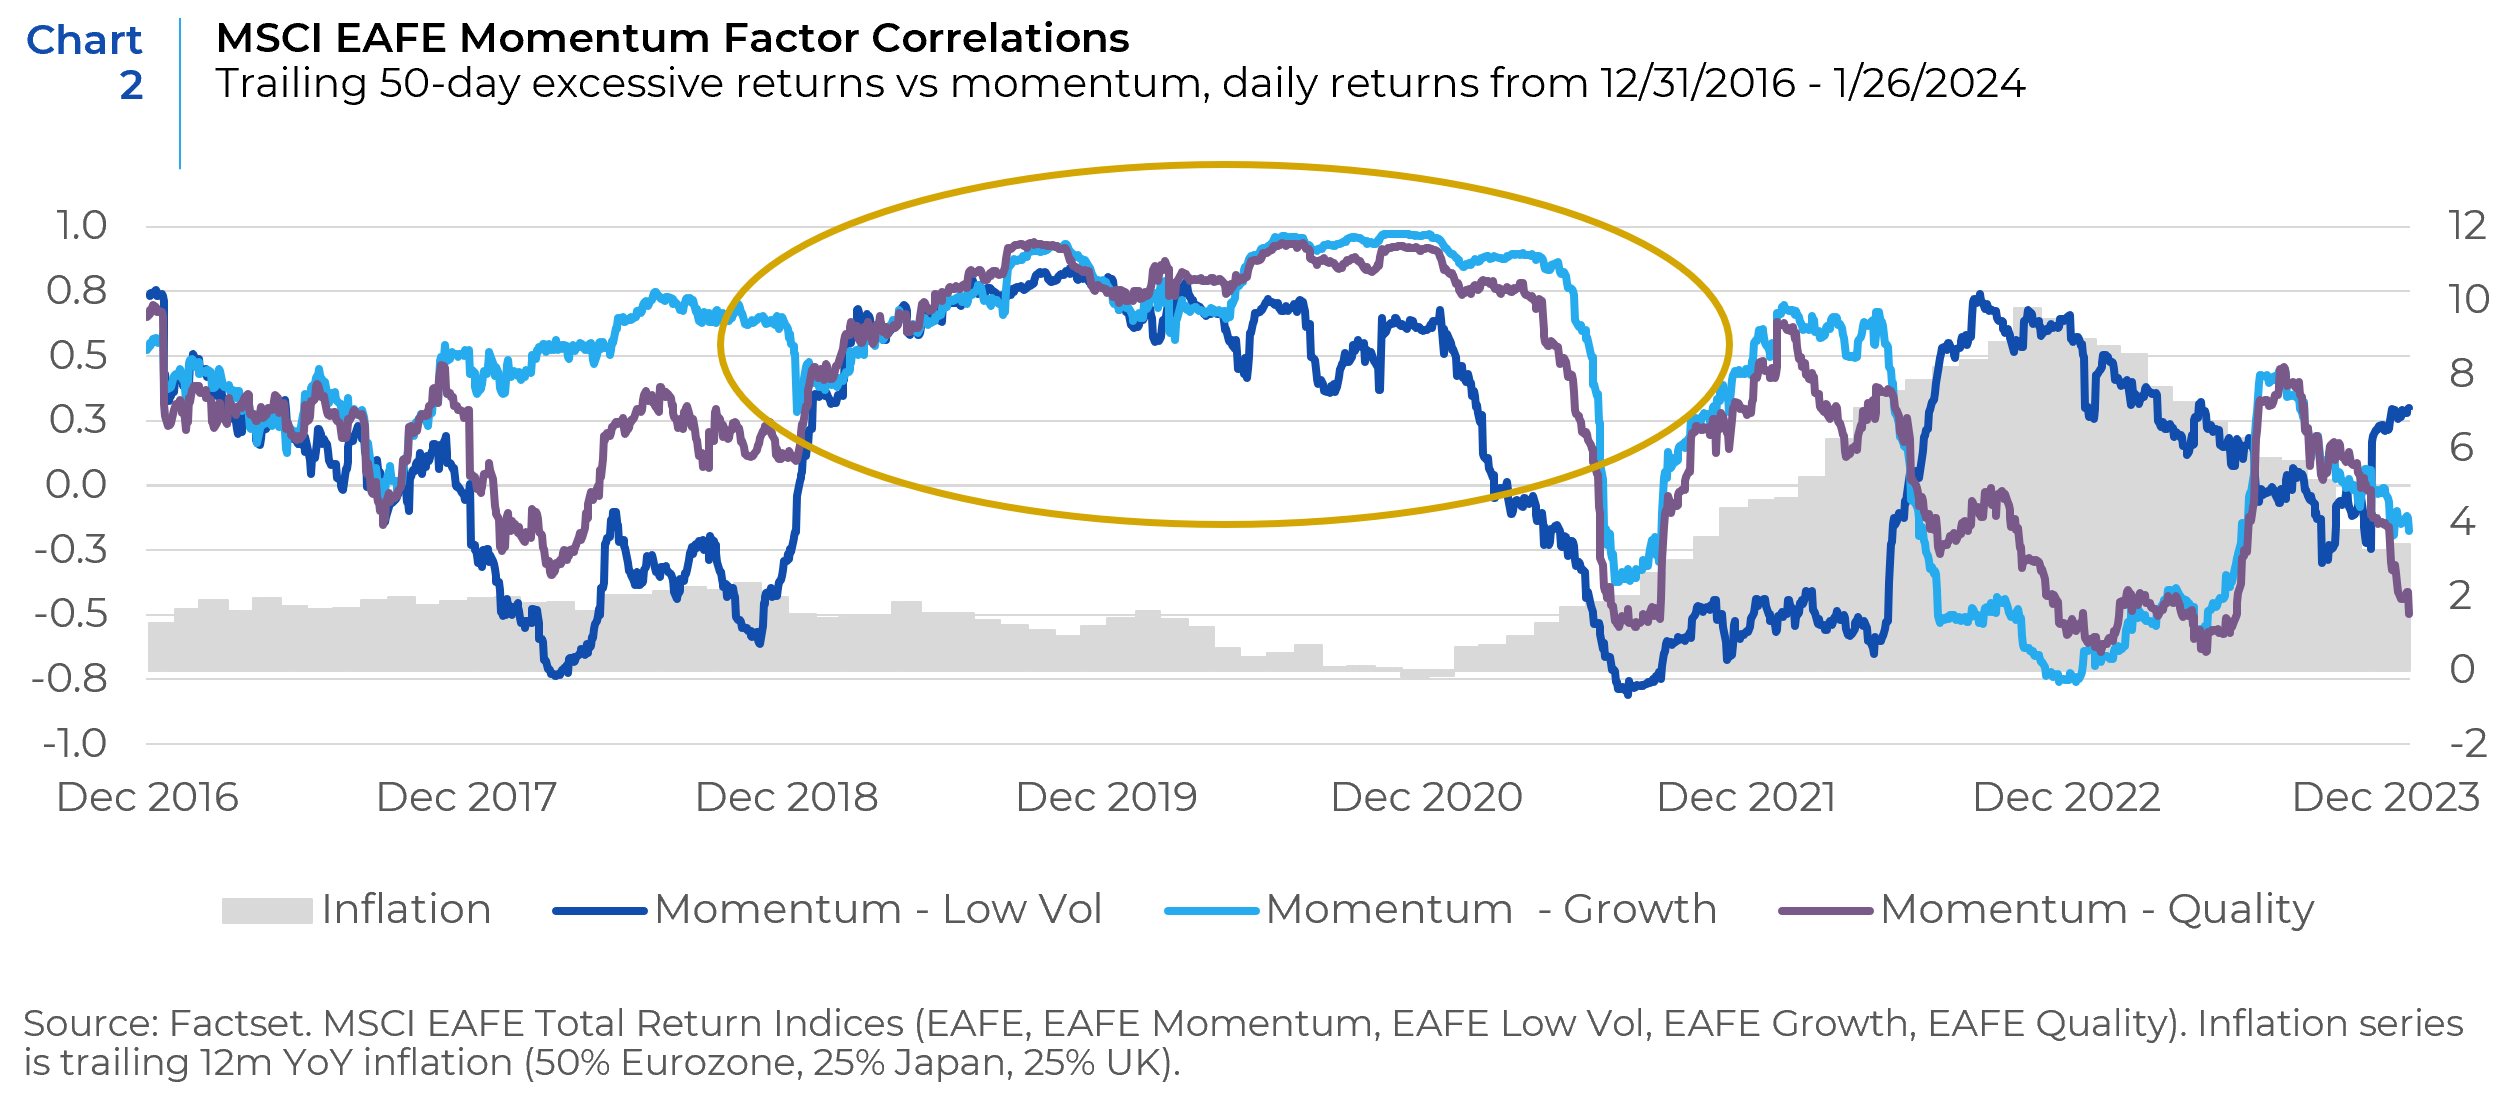
This period coincided with a sharp spike in the correlation between Momentum, Quality, Growth, and Low Volatility. Not surprisingly, these relationships inverted as inflation spiked in 2022. The previously discussed abnormally strong performance of “defensive” managers was observed during this massive spike in factor correlations.
Holdings Based Risk Models
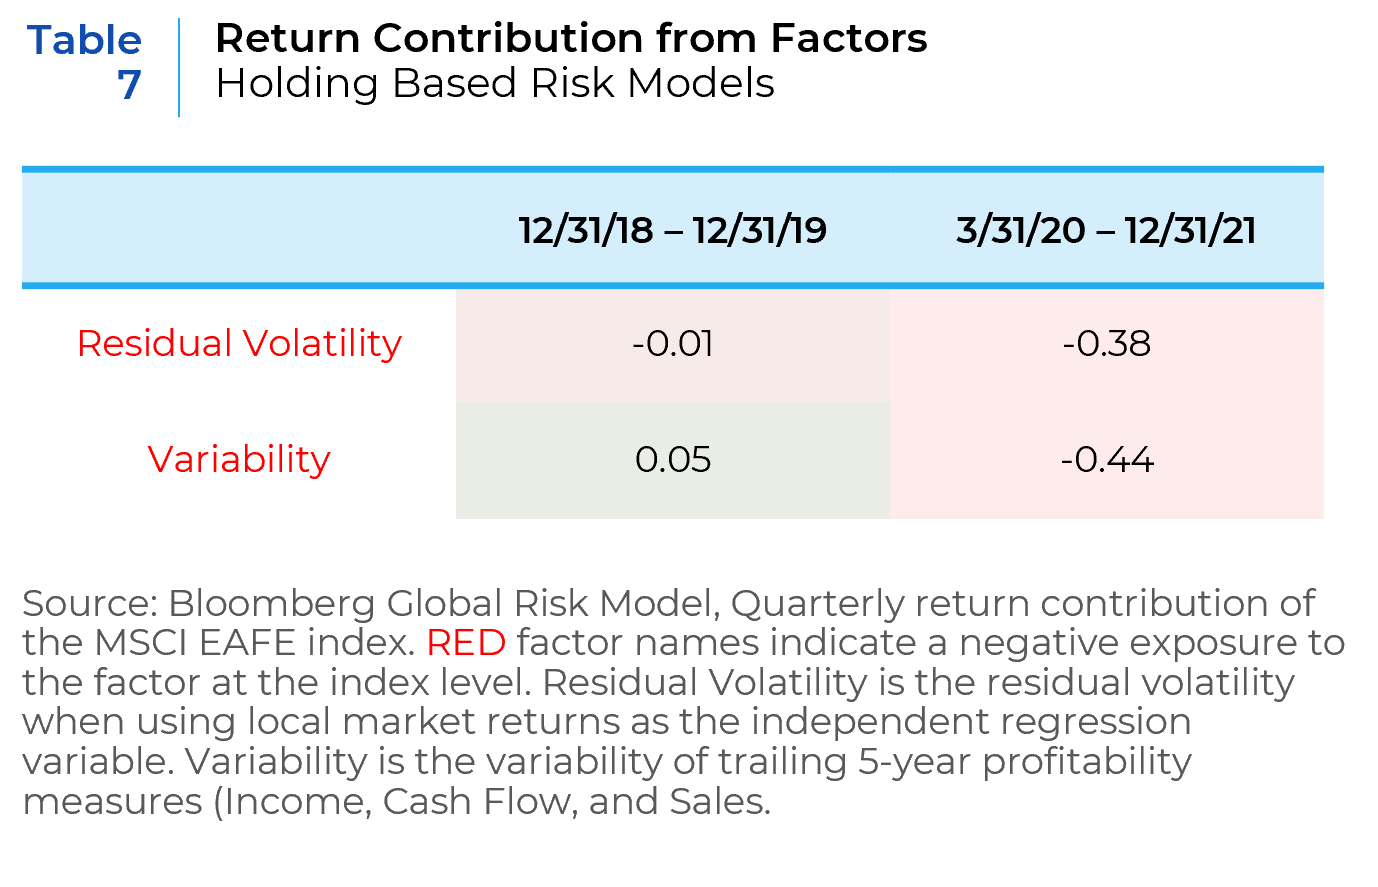
Holdings-based analysis provides a more granular perspective. We began by looking at what factors had positive return contributions to the MSCI EAFE index on average during the drawdown periods shown earlier (see Table 6).
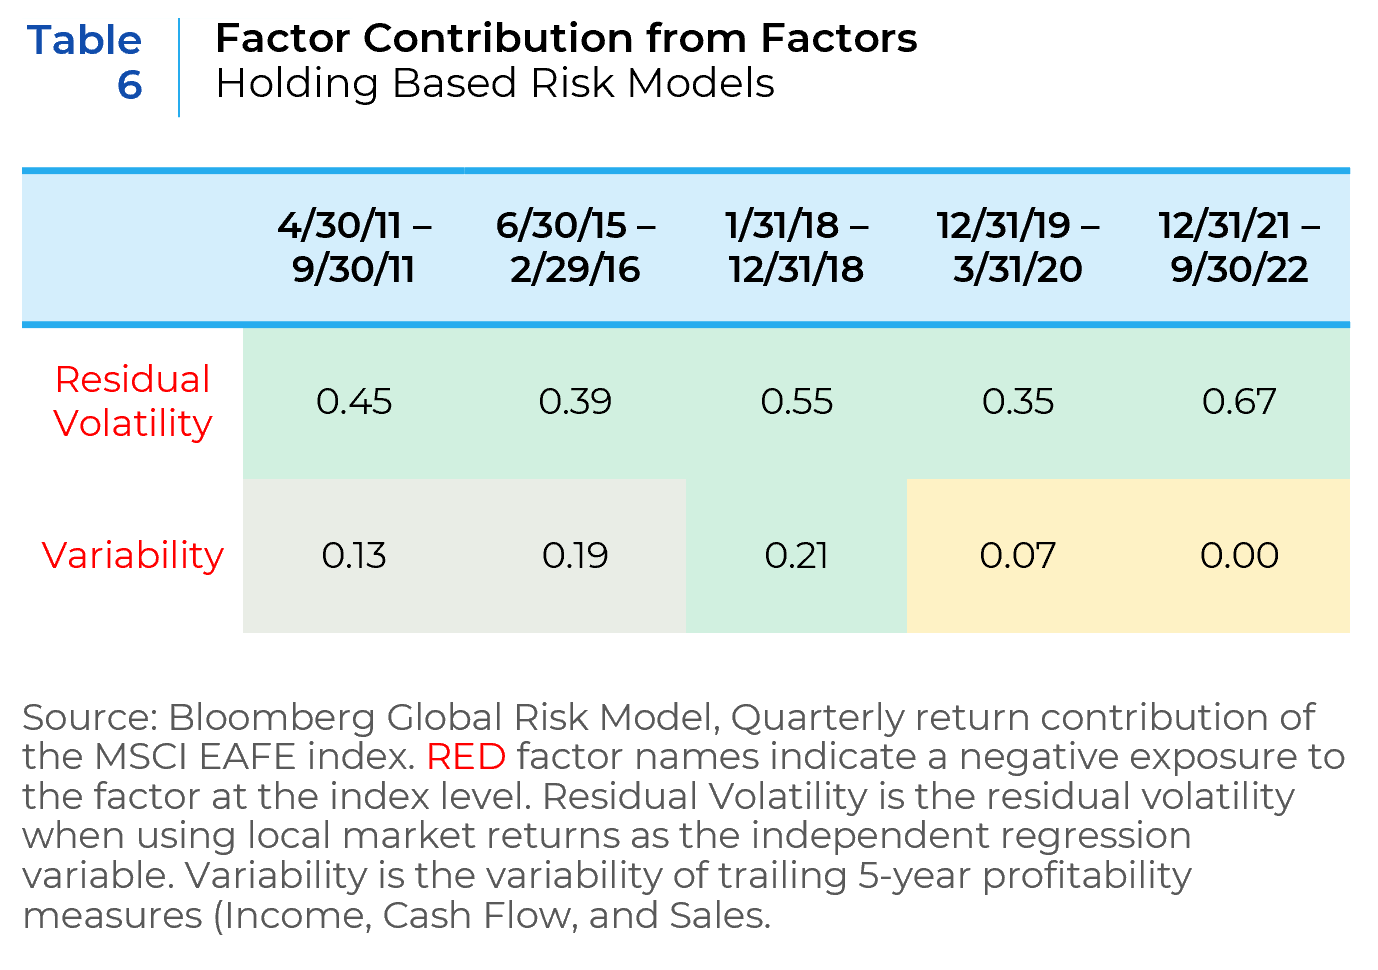
Unsurprisingly, residual volatility (which can be described as the price volatility in excess of what is explained by the market), was the largest contributor to return. Regardless of the type of market drawdown, stocks with the highest residual volatility would be expected to fall the most. The same thesis holds for Variability, which measures the variability of a company’s earnings. In general, the more stable a company’s earnings profile, the less sensitive its listed equity should be to market risk.
The return contributions were not fully consistent with conclusions derived from our return-based analysis during recoveries. After the market downturn in 2018 when defensive managers successfully navigated both the downturn and subsequent recovery, Low Residual Volatility exposure demonstrated a consistent, albeit modest, positive impact on returns throughout 2019. However, this trend reversed the next recovery period starting in the second quarter of 2020, during which Low Residual Volatility became a negative influence on returns. Meanwhile, the Low Variability factor didn’t contribute positively in either period and notably detracted from returns in the later period (see Table 7).
Digging deeper into the factor risk and performance during this period raises interesting questions for us to consider in future work. Many of these questions involve the macro regime and momentum factor’s evolving correlations. Recent market conditions (and perhaps investment approaches) may have magnified the role that momentum can play in abnormal factor performance. One particularly interesting example of an unexpected exposure of the beta and momentum factors within the MSCI EAFE Growth index beginning in 2019 (see Chart 3).
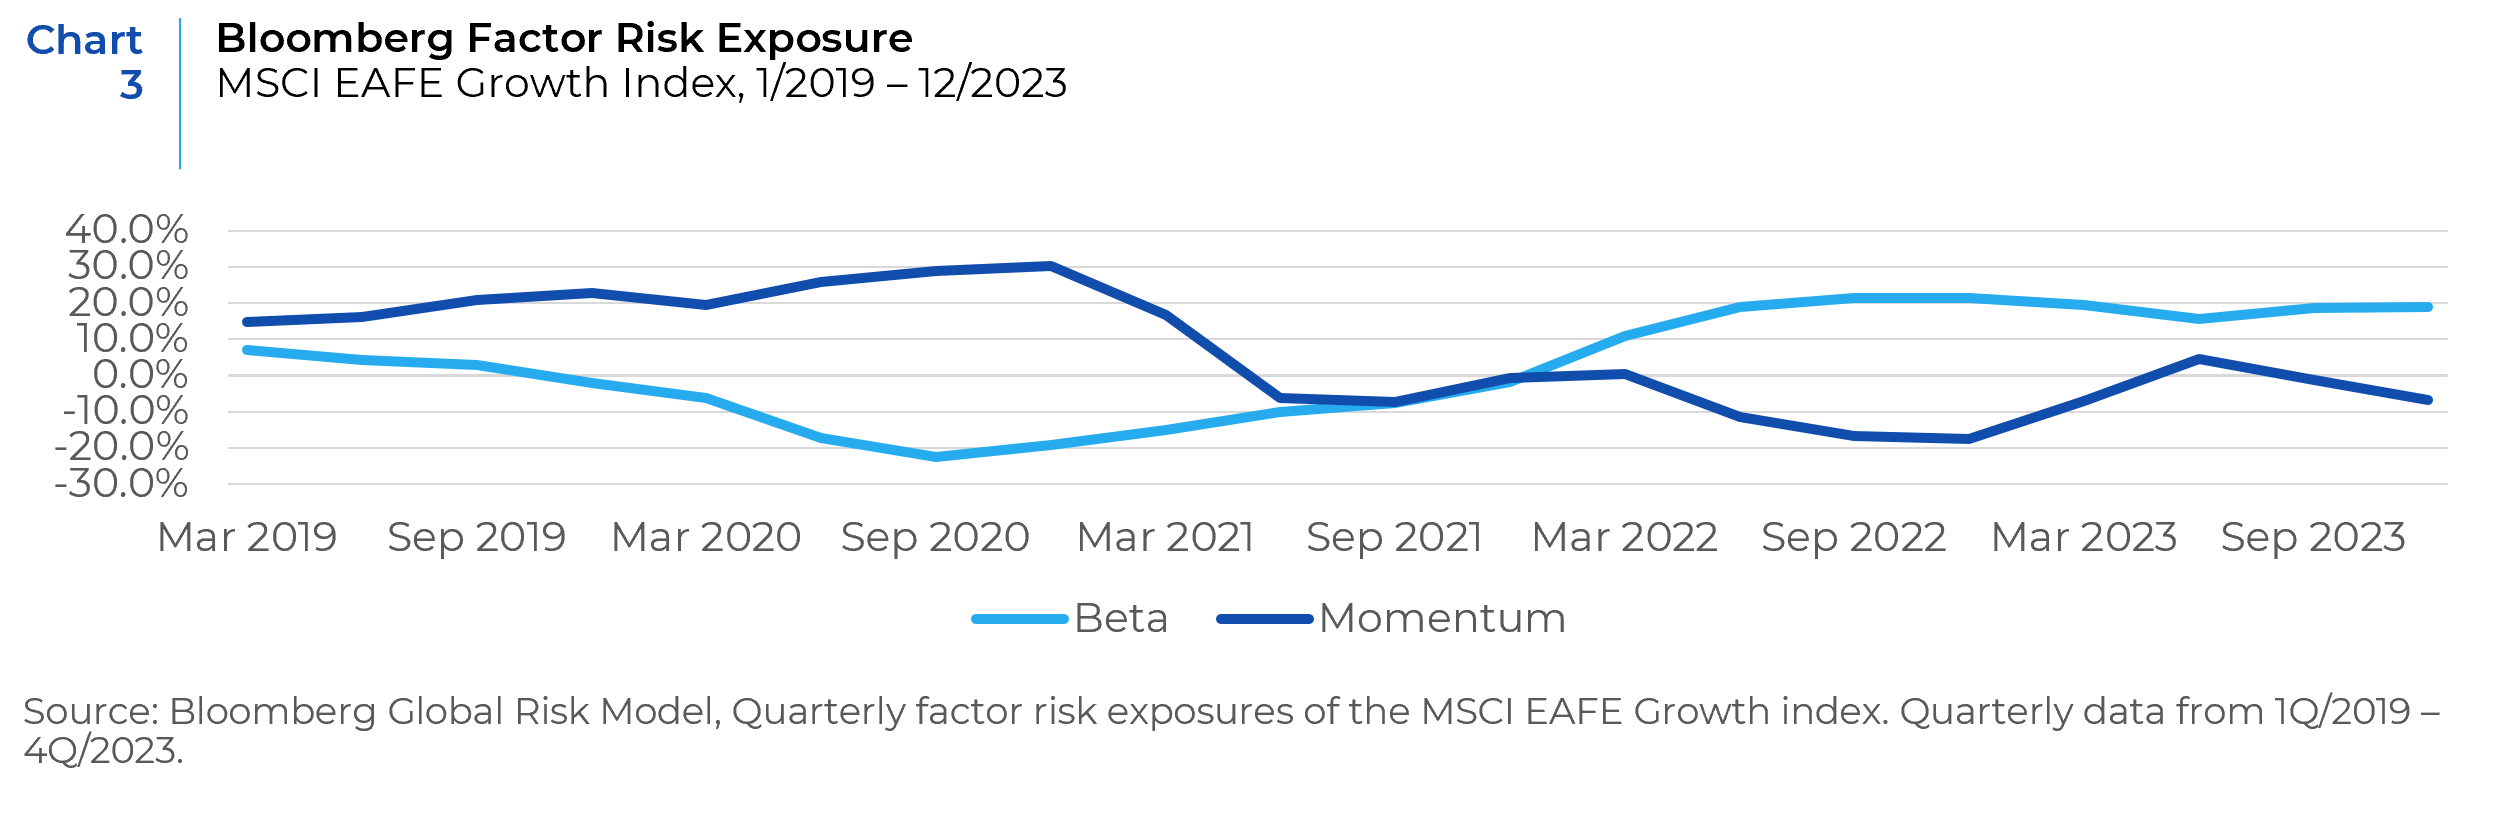
The MSCI EAFE Growth index outperformed by 17.2% from the beginning of 2019 through the 3rd Quarter of 2020. During this time, the index had steadily increased exposure to Momentum and Declining Beta exposure. The relationship reversed as the Growth index underperformed by 15% for the rest of the period. How this fits into the larger picture remains to be seen. The narrow focus of pandemic “winners” obviously plays a role, but the exposures began prior to 2020, suggesting other drivers as well.
Actionable Advice and Future Work
The critical takeaway of our analysis is that historical return-based measures of defensiveness need to be contextualized for the market environment. While they have worked on average over the past 15 years, the failure of that approach in 2022 likely hurt portfolios more than any benefit gained in prior periods. A more robust measure of manager defensiveness comes from holdings-based factor risk (negative exposure to Residual Volatility and Variability). Neither approach shields you from the double-edged sword of investing with defensive managers, giving back alpha gained during subsequent bull markets.
The peculiar relationships our analysis uncovered are going to be the topic of future research. Rather than speculate on what happened, we will end with some open questions.
- Were returns too good to be true? Should you be alarmed when the managers who protected capital in a market pullback also lead the tables during the following recovery?
- Were factor correlations a canary in the coal mine? When we observe spikes in the correlation between factor returns, what deeper analysis should we do? Are certain factor relationships more problematic?
- What happened with beta and momentum factors during the final stages of the multi-year period of outperformance by the growth index? Was this an anomaly? A Warning? Randomness?
- What role did the macro regime play in the observed anomalies? Can we use this information to improve our analysis in the future?
This report is neither an offer to sell nor a solicitation to invest in any product offered by Xponance® and should not be considered as investment advice. This report was prepared for clients and prospective clients of Xponance® and is intended to be used solely by such clients and prospects for educational and illustrative purposes. The information contained herein is proprietary to Xponance® and may not be duplicated or used for any purpose other than the educational purpose for which it has been provided. Any unauthorized use, duplication or disclosure of this report is strictly prohibited.
This report is based on information believed to be correct, but is subject to revision. Although the information provided herein has been obtained from sources which Xponance® believes to be reliable, Xponance® does not guarantee its accuracy, and such information may be incomplete or condensed. Additional information is available from Xponance® upon request. All performance and other projections are historical and do not guarantee future performance. No assurance can be given that any particular investment objective or strategy will be achieved at a given time and actual investment results may vary over any given time.