
“The cardinal sin of active management is to style drift and underperform.” – Martin Gilbert
Summary
Q1 2022 saw the largest one quarter outperformance of international value in twenty years, and yet 93% of international value managers underperformed the international value benchmark.1 While the disruption of commodity markets from the invasion of Ukraine led to outsized returns in commodity sensitive stocks, which might normally explain such an aberration in the peer group’s distribution of returns, deeper factor analysis reveals that more was at work than mere sector effects. Moreover, the skew of factor positioning within international value managers indicates that in this instance, past may be prologue. Alongside the much-discussed regime shift in inflation, interest rates, and commodities, leading to a more sustained outperformance of value factors, we may also be at the front end of a regime shift within value itself that allocators should also be taking note of.
Inside the Nesting Doll
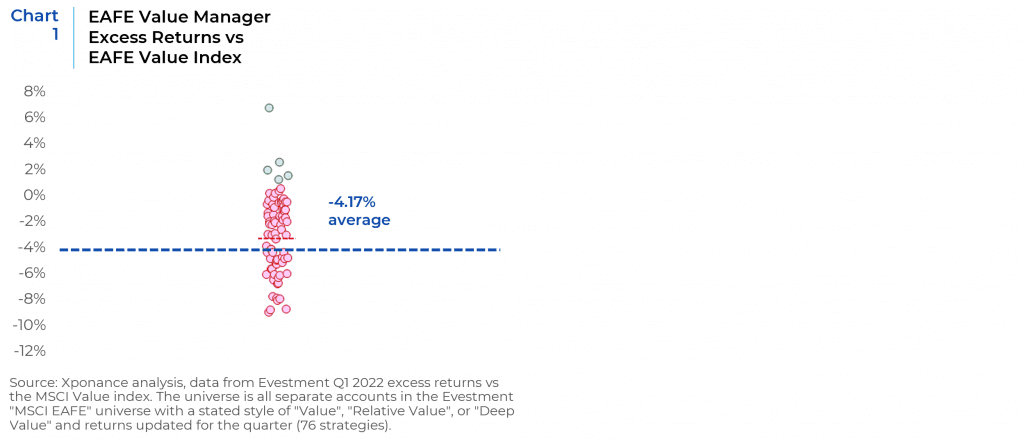
For most of the past decade international value managers have underperformed their core and growth counterparts (as well as those in most other styles you could consider) amid an historically long stretch of style leadership. With such a long runway of preparedness for mean reversion, as well as substantial signs of factor rotation amid steadily rising inflation, interest rates, and the “warm-up” of the strong value rally in Q4 2020, one might have expected value managers to be better positioned for their long overdue moment in the sun. Historically, the median excess return of international equity strategies using SMA data is about +1.1% (also adjusting for style effects, see (Alpha Availability: Identifying the Drivers of Active Manager Returns Across Markets and Investment Styles – Part 1) and about 0% using mutual fund data (which accounts for fees, fund expenses, and lower self-reporting biases embedded in institutional SMA data, but also biases to larger product AUMs with lower breadth). Of course, any given individual quarter can see meaningful skews in returns, but rarely to this extreme.
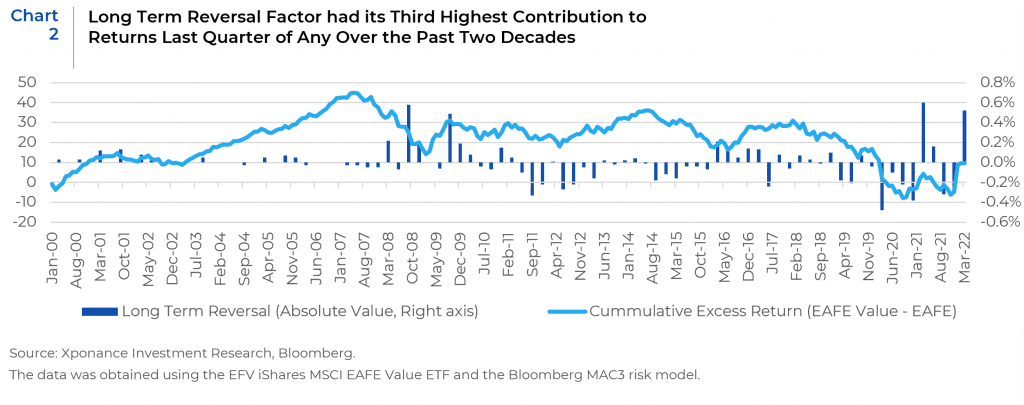
Of course, Q1 2022 was marked by an exogenous shock to the markets – Russia’s invasion of Ukraine – and with it a huge spike in commodity prices that clearly played a role in delivering this skew to peer returns. But even after accounting for these sector effects and other common factors, our analysis shows there remained a substantial residual left in the market returns not explained by simple factor or base style effects. As shown in Chart 2, the Long Term Reversal factor (a residual factor representing pure price reversion after accounting for all normal common factor, geographic, currency, and sector effects) had its third highest contribution to returns last quarter of any over the past two decades. Historically, outsized returns to this factor have signaled significant regime changes in the market, whether in mid-2008, early 2009, 2020 and now 2022. Moreover, the past 2 years has seen a sharp rise in magnitude of the factor (positive and negative), indicating a great degree of uncertainty in the market not explained by other economically or financially driven factors.
Not Graham & Dodd Value
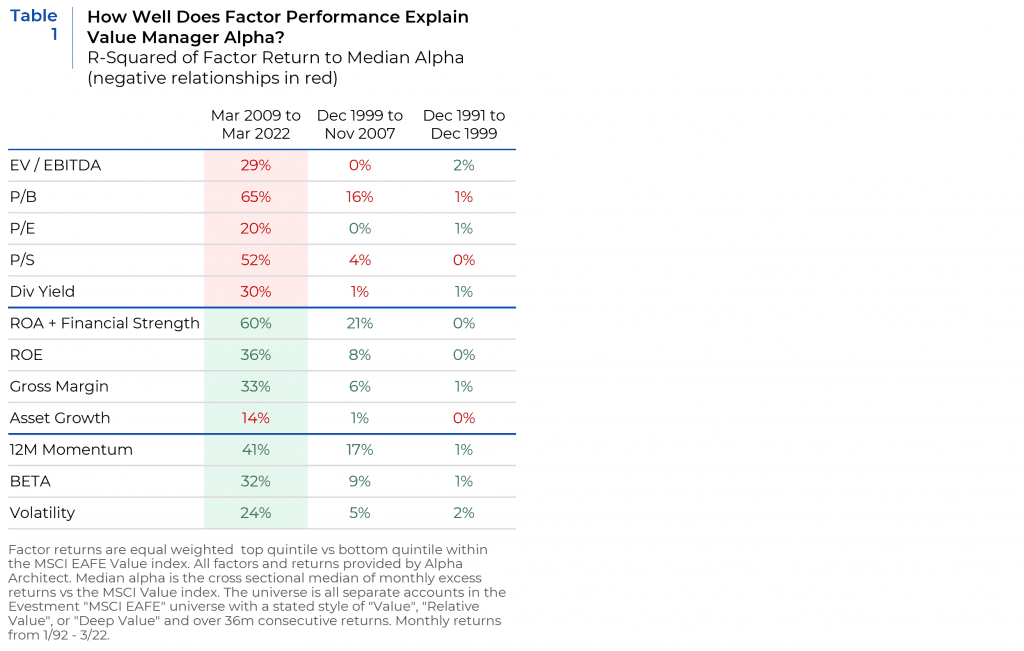
Of course, the past 2 years has also seen some of the largest ‘exogenous’ shocks to markets since the GFC (Covid-19 and the invasion of Ukraine). But most past such events (9/11, GFC, QE, the Draghi put, etc.) have also in turn seen shifts in investor behavior that in hindsight were the points at which not only style leadership changed, but intra-style leadership as well. For example, post-GFC international developed market value managers, which had for most of the previous two decades exhibited few factor biases relative to the value benchmark, shifted sharply towards higher profitability at the expense of (principally) the most traditional value metric of price to book (see Table 1).
Furthermore, this intra-style shift was a significant driver of style-adjusted excess returns for value managers over the past 13 years (see Charts 3 and 4).
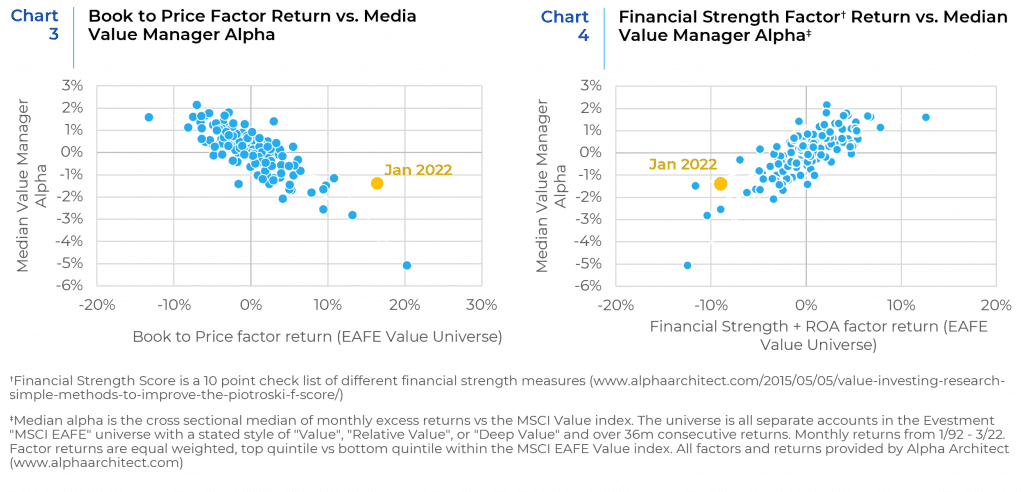
Since the Financial Crisis, the excess return of the median value manager could be explained by how well higher quality value stocks have performed and the inverse of the more traditional value approach of book to price. January was the strongest month for the book to price factor since April 2009, which was led by the rapid repricing of all financials in response to the massive monetary actions taken to end the GFC. Other than April of 2009, the 3 months when the Financial Strength + Return on Assets (ROA) factor has performed worse than January have all been in the past 2 years.
The shift away from price-to-book owes at least in part to the increase in share repurchases over the past decade. Price to book is meant to be an unbiased estimate for seeing what shares are worth (in liquidation or through a private acquisition). But book value per share is not increased by share repurchases (it decreases by the cost of the repurchase). Price to book in particular has been vilified as being out of step with the current trend of growth through aggressive share repurchases and even MSCI has publicly reconsidered the use of book to price in their own definition of value.2 Instead, active managers have significantly prioritized ‘efficiency’ type factors in the past decade.
Share repurchases however, have been a much larger contributor to returns in the U.S. than in Europe or Japan (though they’ve been present everywhere over the past decade). But the peer group of managers offering x-US strategies skews heavily American, in part due to the source of the dataset, but also as it is mostly only American institutions who buy x-US products (just as it is mostly UK institutions who buy x-UK, Japanese institutions who buy x-Japan, etc.). With developed market central banks not only pulling back from the liquidity that allowed the flourishing of share repurchases, but also with higher interest rates due to the combination of rising inflation and monetary normalization (except perhaps in Japan), reports of the death of book-to-price may have been greatly exaggerated.
Is this a Regime Change? Selected Views from our Boutique Managers
As we continuously study the market and the ongoing cross currents of change that present both opportunities and risks to our clients’ portfolios, we are simultaneously skeptical and studious of asset managers’ thoughts on the market’s direction. We asked some of our boutique managers to share their views on the unfolding market shifts.
Aggressive Value – Global Equities Boutique based in Stamford, CT – Arga Investment Management
Valuation spreads in many markets remain very wide. Historically, wide spreads have tended to signal a rotation to value and subsequent value outperformance. The rotation to value investing occurs when investment flows move to value. Flows are triggered by changes in sentiment, the subsequent outperformance sustains flows and can continue until spreads normalize. Currently, we have an unusual cross-current of such drivers that may be changing sentiment. Today’s wide spreads, coupled with the near-to-medium term outlook for inflation and higher rates, suggest a substantial opportunity for value until spreads normalize.
Aggressive Value – International Equities Boutique based in Los Angeles, CA – Ballina Capital
Regime change very well may have already been underway before Russia invaded, and I believe the main driver of that is monetary policy. I believe the conundrum for Portfolio Managers is where now? I sense more and more of the large managers are increasingly uncomfortable with what they own. I think the answer to their question would probably be in the most boring Financials, Utilities, Health Care and Technology that you can find. I think the outlook on Metals companies is much more mixed because it is not very clear that we are not driving right into a recession that will reduce demand for Metals very significantly.
GARP – Global Small Cap based in Chicago, IL – Lizard Investors
While timing is inherently unpredictable, we think there are three core drivers (inflation, globalization reversal, and the cost of capital) that will lead to a change in market leadership on a longer term basis, i.e. the next 5 years won’t look like the last 5 years from a who wins perspective.
1 Based on institutional, gross returns obtained from eVestment. Peer group is based on Xponance’s proprietary factor-based peer analysis (aapryl.com) and not self-reported styles (i.e. the long-term returns of all the managers in the peer group are all much more correlated to value factors than either core or growth factors). Peer group size was 76 managers at the time of analysis.
This report is neither an offer to sell nor a solicitation to invest in any product offered by Xponance® and should not be considered as investment advice. This report was prepared for clients and prospective clients of Xponance® and is intended to be used solely by such clients and prospects for educational and illustrative purposes. The information contained herein is proprietary to Xponance® and may not be duplicated or used for any purpose other than the educational purpose for which it has been provided. Any unauthorized use, duplication or disclosure of this report is strictly prohibited.
This report is based on information believed to be correct, but is subject to revision. Although the information provided herein has been obtained from sources which Xponance® believes to be reliable, Xponance® does not guarantee its accuracy, and such information may be incomplete or condensed. Additional information is available from Xponance® upon request. All performance and other projections are historical and do not guarantee future performance. No assurance can be given that any particular investment objective or strategy will be achieved at a given time and actual investment results may vary over any given time.