
Lessons From History
For the past 15 years, global investors’ default positioning was to hold U.S. Dollars as the most obvious choice of non-domestic currencies (and maybe most obvious overall choice) and when investing outside their own equity markets, to look first to the U.S. We believe that those choices are under review and that investors will, at the margin, seek to diversify their allocations to other “safety” assets, such as gold, the Japanese yen, Swiss bonds (and perhaps cryptocurrency). We believe that this marginal change is all that is needed to see U.S. risk assets underperform in common currency terms. The U.S. need not be a “dirty shirt”, it just needs to not be an obviously “clean shirt” for the rest of the world to look elsewhere in their wardrobe. As long as the U.S. maintains such a massive current account deficit ($1.1 trillion in 2024), the U.S. need only take in less inflows to its capital account to result in net pressure on its currency. And as the historical examples in this paper suggest, when investors make that choice, there can be a huge opportunity cost for investors who ignore it.
The now infamous “Liberation Day” announcement by the Trump Administration of new tariff levies occurred only three months ago, kicking off the second quarter of 2025. In the months (though what feels like years) since that event, the U.S. market roiled, nearly capitulated, and has since rallied, creating nearly a full market cycle of returns in just a couple of months. While U.S. equity investors may have shrugged off the expected pain from that now famously ill-conceived policy announcement, many have not forgotten.
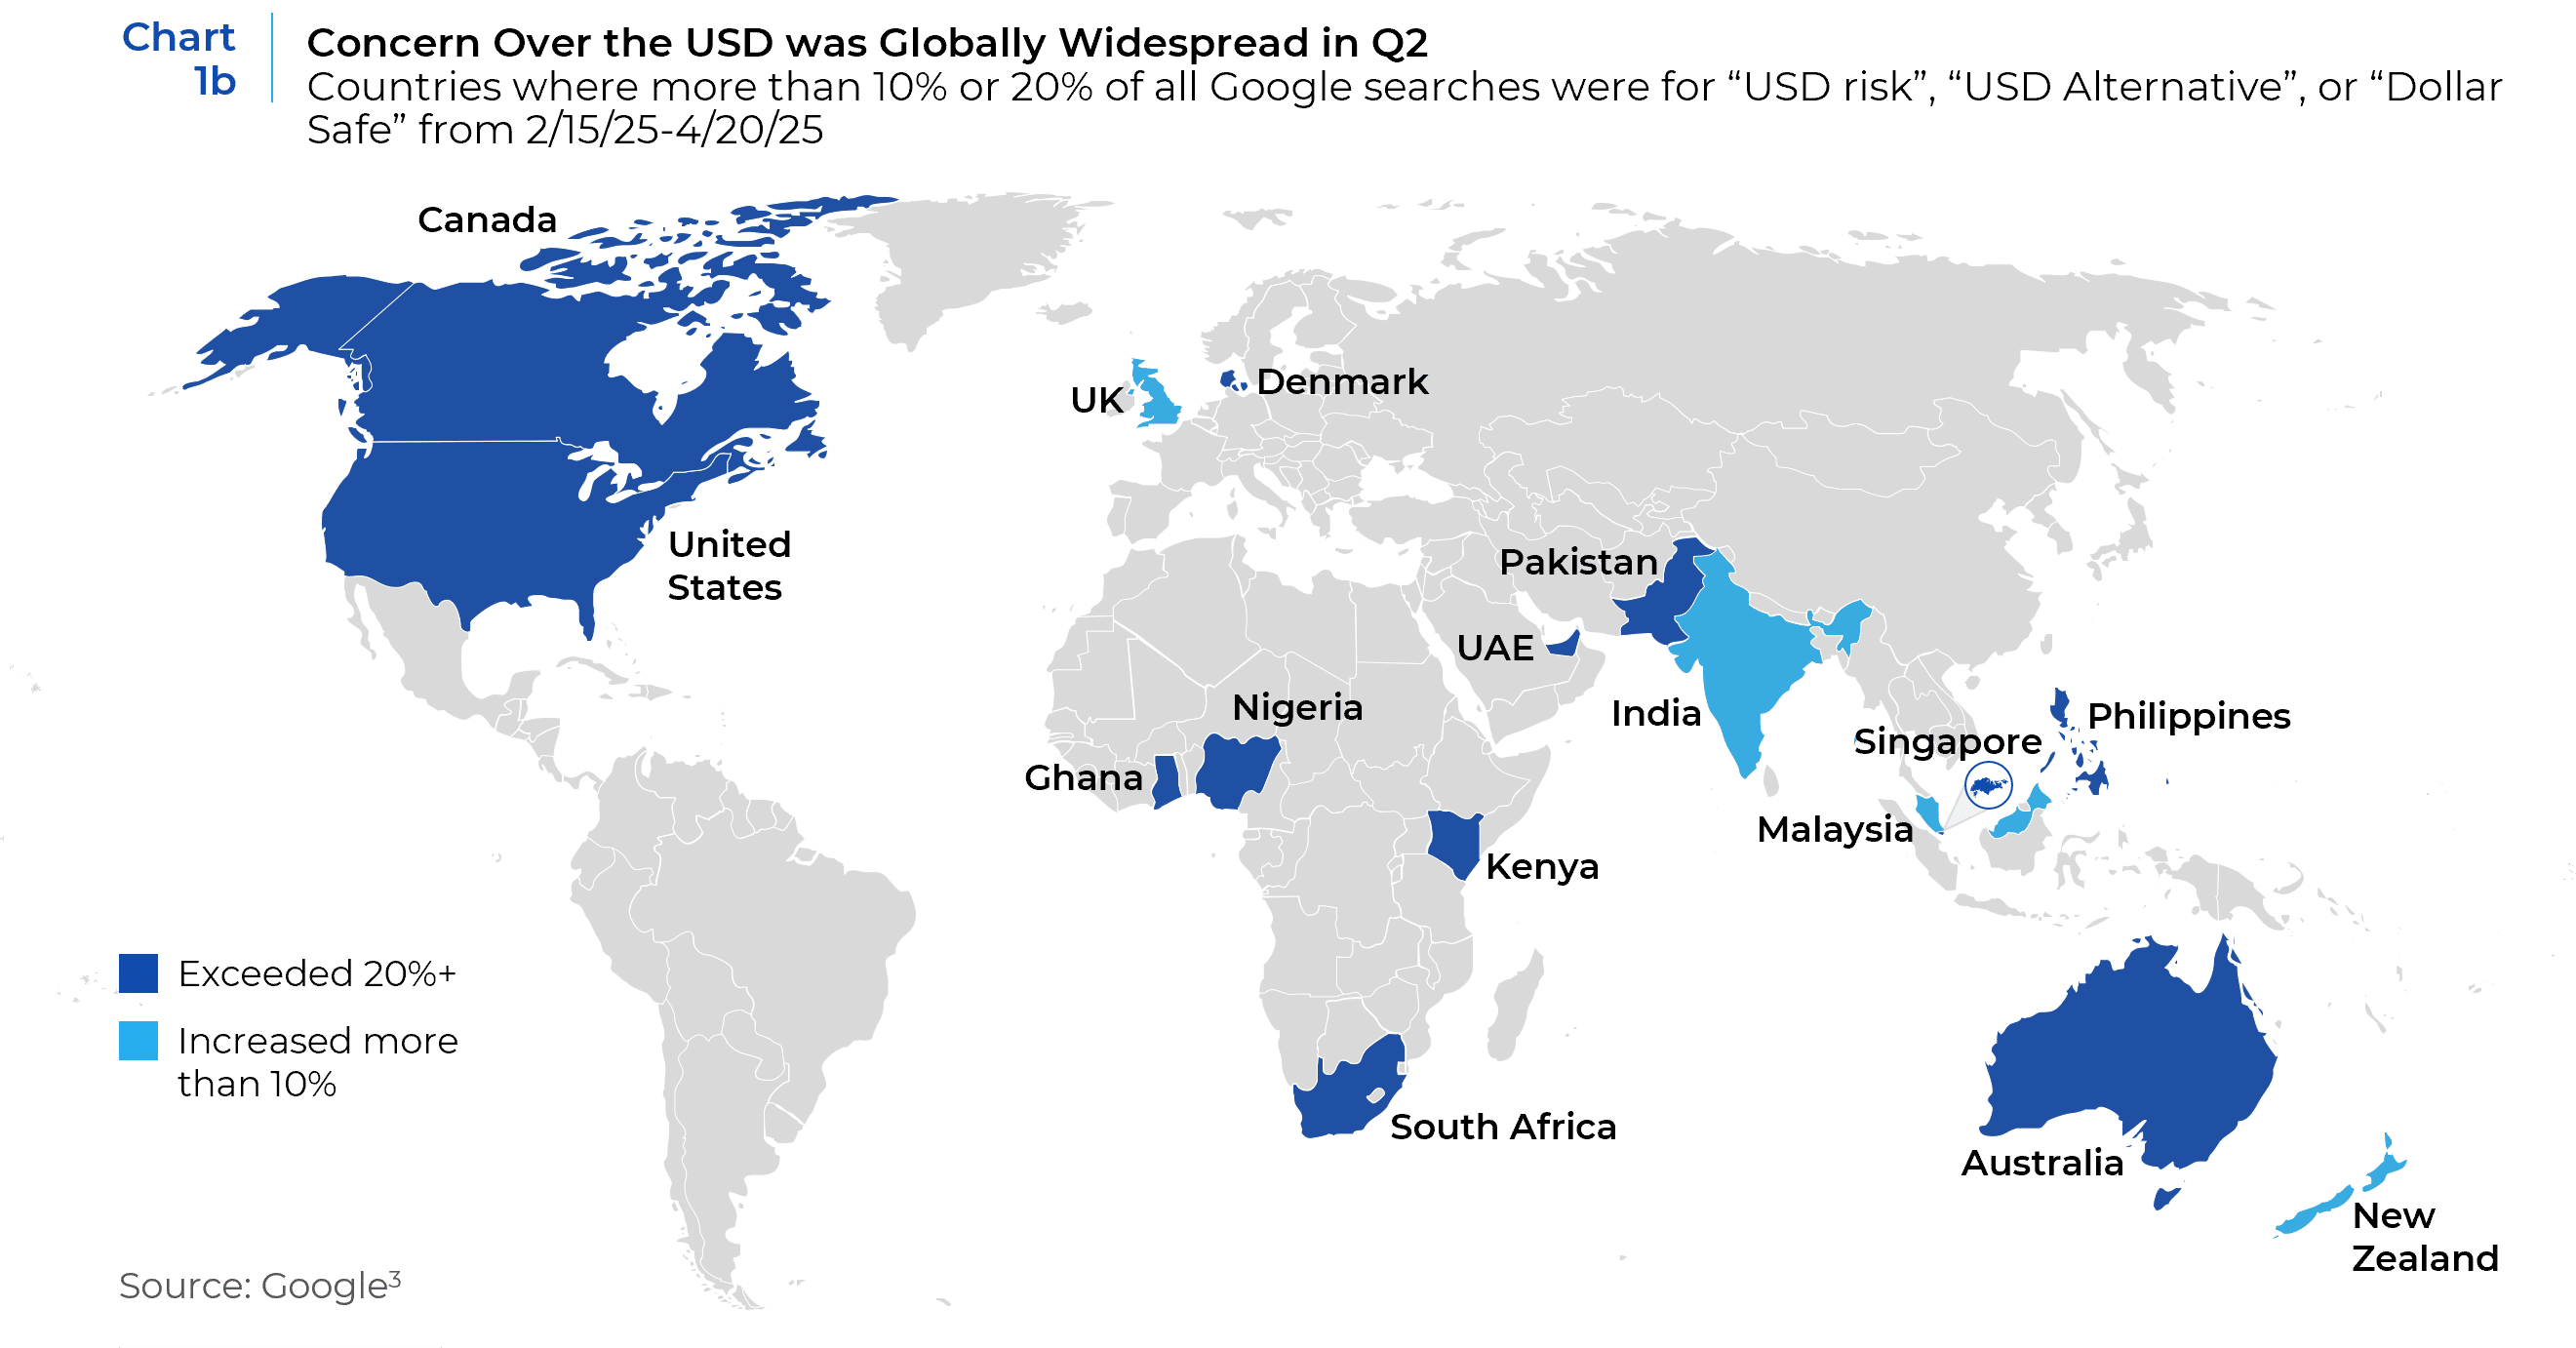
The selloff of the U.S. dollar during the post-Liberation Day risk-off market – set against the backdrop of further U.S. fiscal largesse, ongoing policy uncertainty, and threats of partial capital controls1 – have begun to raise questions across the globe about the stability of U.S. capital markets as a safe-haven. Treasury market volatility has rebirthed talk of “bond vigilantes”. Worldwide Google trend data shows a meaningful surge in searches for USD fears (see Chart 1a and 1b). Between mid-February and late April2, the search terms of “safe dollar”, “dollar safe”, “USD alternative”, and/or “USD risk” exceeded 20% (and sometimes much more) of all national Google search traffic in Australia, Canada, Denmark, Ghana, Kenya, Nigeria, Pakistan, the Philippines, Singapore, South Africa, the UAE as well as the United States. It exceeded more than 10% in India, Malaysia, New Zealand, and the UK.

History Busts-a-Rhyme
Even before “Liberation Day”, the wild swings in U.S. election outcomes and the substantial economic policy reversals of now three successive U.S. Administrations have created a degree of policy uncertainty in the U.S. not felt by the rest of the world in a century. These policy shifts are undergirded by the extreme polarization among the country’s political leaders that further fuels institutional distrust among its electorate. As long as this extreme policy uncertainty persists, global investors in U.S. risk assets will require additional compensation relative to recent history.
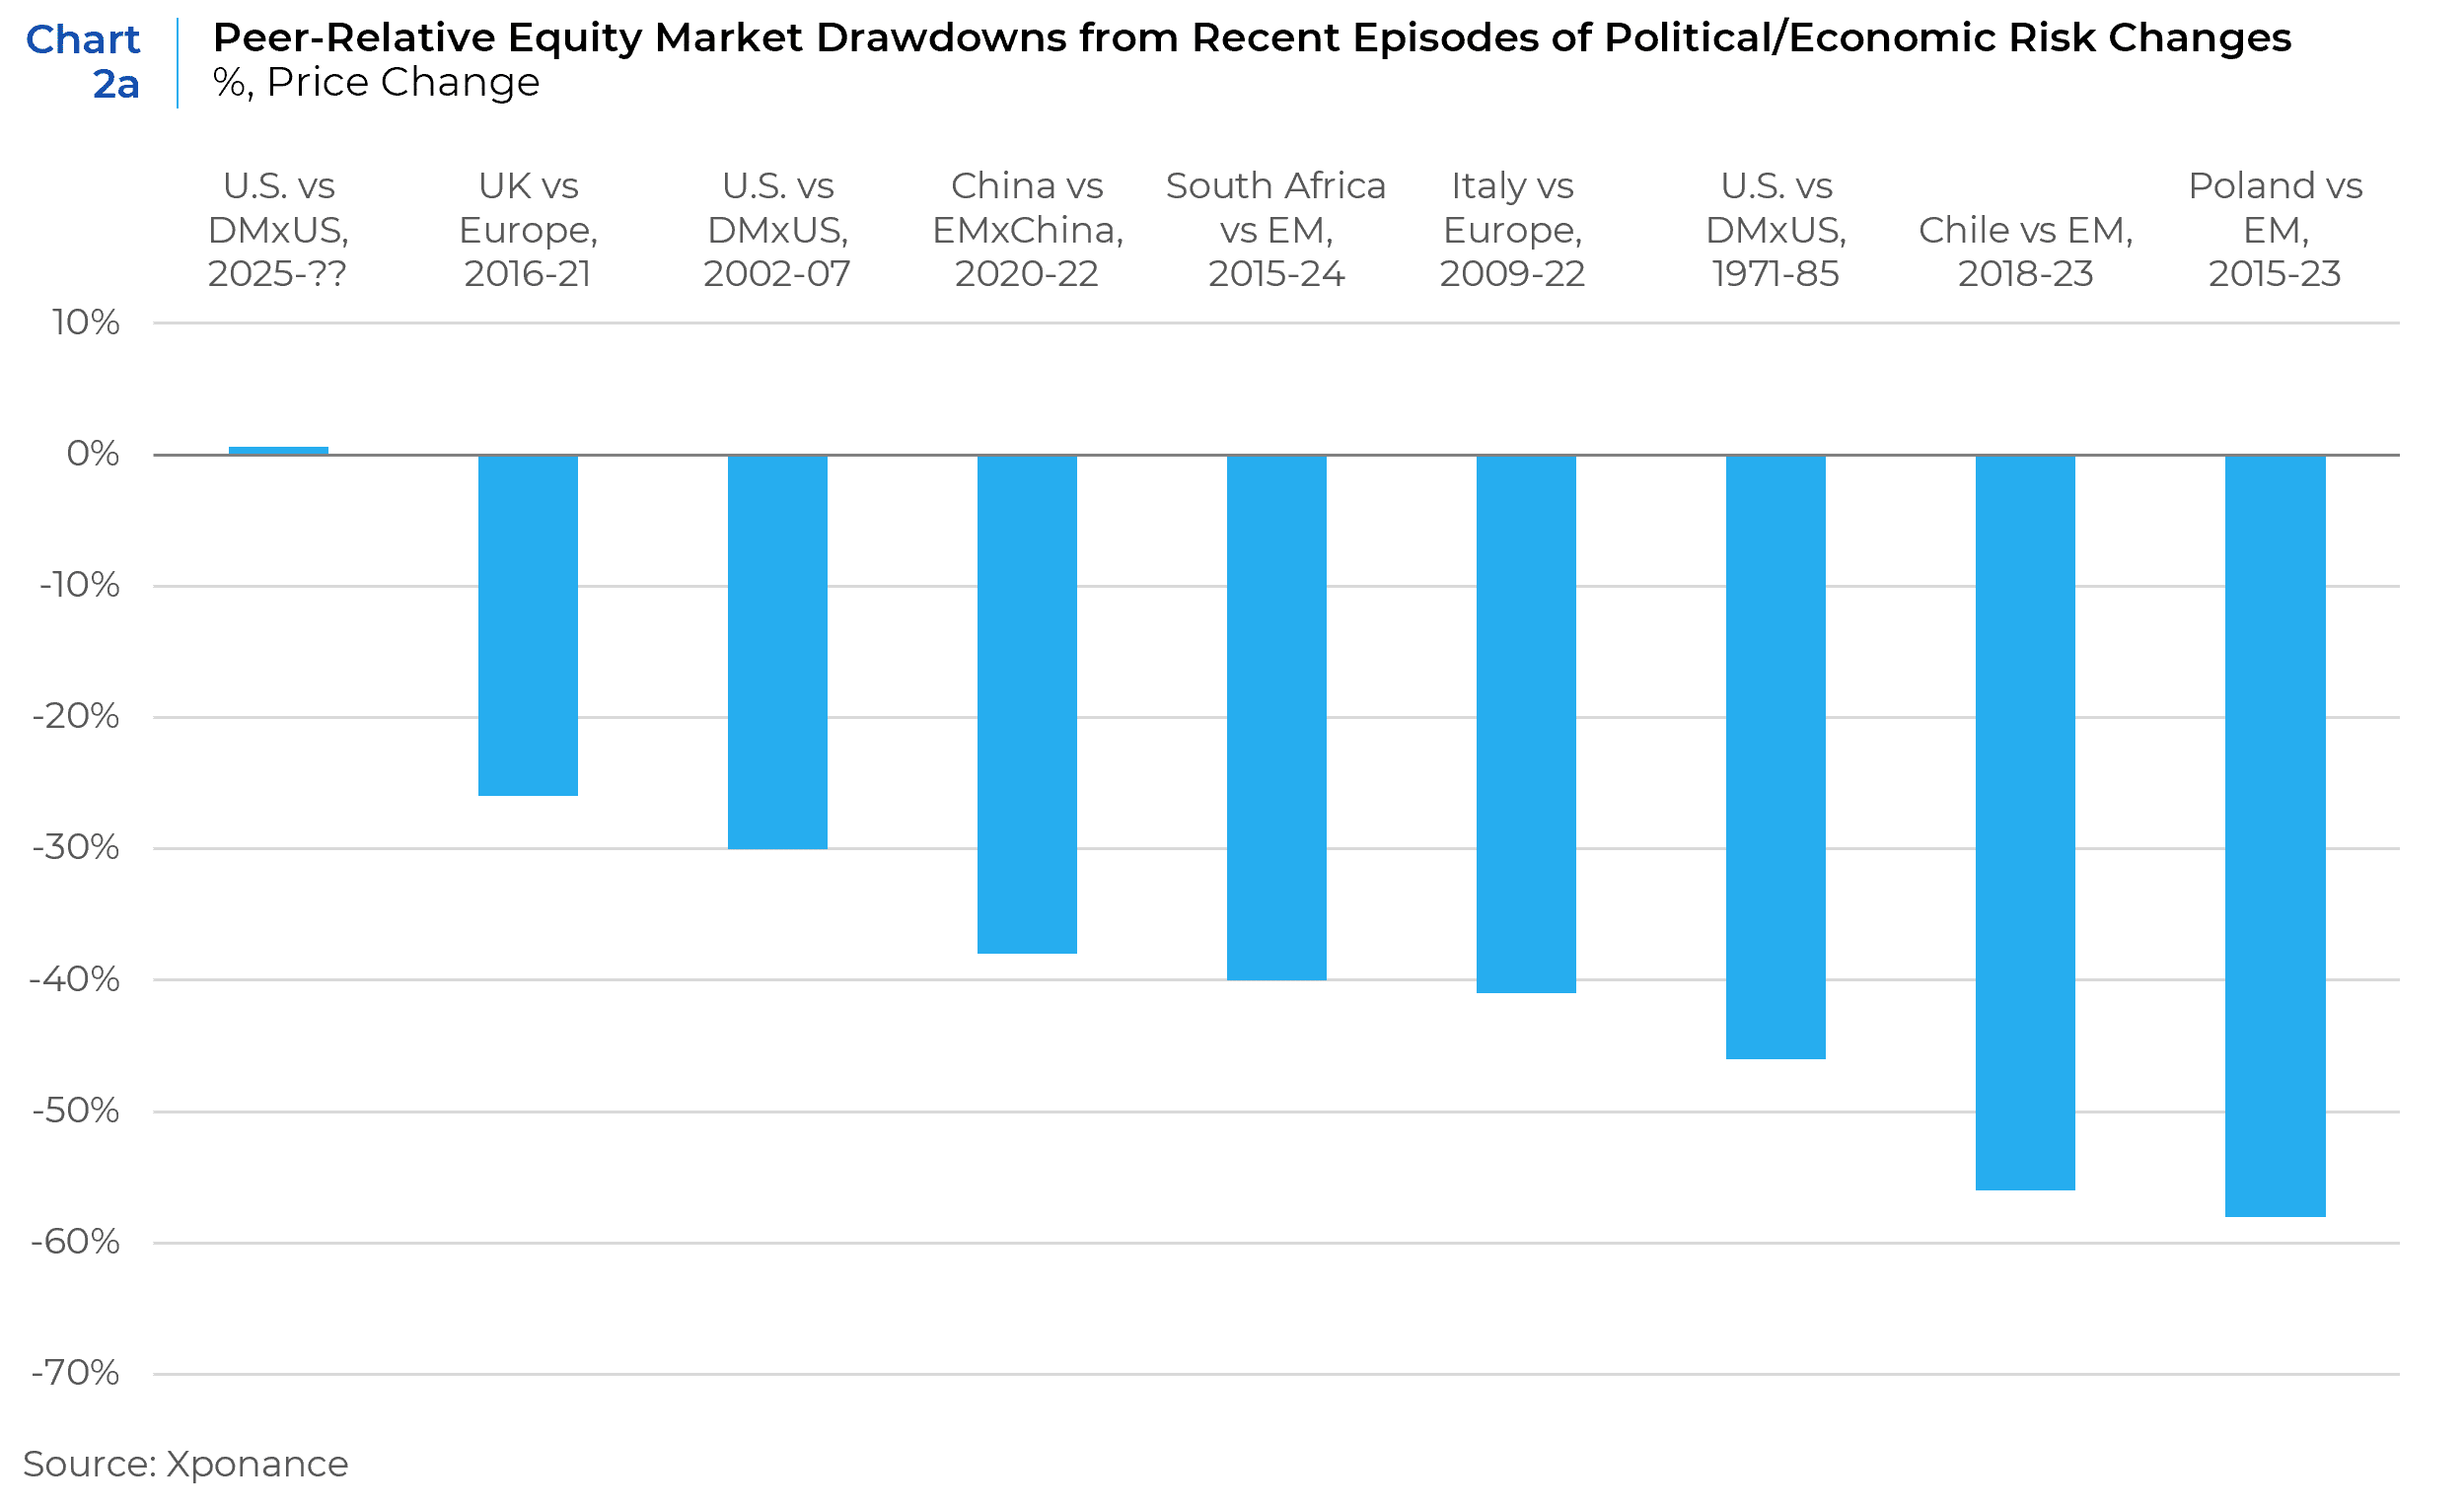
In this article we will look at similar episodes of perceived degradations in the political economy of investible markets in the recent past and how these historical experiences may guide today’s investors. We will focus in this piece on the differences in “event-to-trough” peer-relative equity returns and valuations, as the most obvious common denominator of quantifying the collective impact to investors’ long-term risk premia.


The UK’s shocking vote to withdraw from the European Union set off years of political and policy uncertainty that led to years of underperformance vs other European or developed world markets. From February 2016, when the date of the Brexit referendum was set (the vote was June 23, 2016) until the relative market trough in August 2021, the UK market underperformed Europe by -26%, and -51% vs all global developed markets (through the trough in Jan. 2025). UK valuations, which had hovered steadily at a 5% discount to European valuations for the previous decade, also steadily declined to a trough of a more than 20% discount in August 2021.

Following the GFC, the high debt loads of several European economies (the so-called “PIIGS” for Portugal, Ireland, Italy, Greece, and Spain) led to years of underperformance and in the case of Italy, a decade of political instability capped off by the poor luck to be the first European country to have an outbreak of Covid in 2020. From January 2009 until the election of PM Giorgia Meloni in October 2022,4 Italy underperformed broader European equity markets by -41% and slumped from an average valuation discount of 10% vs the rest of Europe to a trough of a 40% discount.

Following the end of a brutal dictatorship in 1990, Chile enjoyed nearly 30 years of economic growth and stability to emerge from poverty and become the first South American country to join the OECD in 2010. Despite frequent political changes, the political consensus to keep Chile’s free market constitutional bedrock endured. But this support began to breakdown after the 2013 taper tantrum and the ensuing recession (GDP per capita slumped 15% from $15,700 to $13,400 in 2 years), culminating in years of massive labor and political unrest. Following the election of a conservative president in March 2018, these protests accelerated from about 19 protest per year to 151 in 2018. They ultimately spiraled into massive nationwide protests in October 2019 that shutdown the economy and led to an agreement in April 2020 to hold a Constitutional referendum. For the first time in a generation the bedrock of Chile’s entire political economy was open to reform. Ultimately amid a resurgence in economic growth after the pandemic and a surge in demand for copper and lithium, a better mood among the electorate led to two successive rejections of the new constitution, the last vote occurring in Dec. 2023. During this 5-year period of unrest and massive political uncertainty, Chilean equities substantially underperformed its EM and Latin American peers by -56% and -47% respectively. For most of the 15 years prior to this period, Chilean equities traded at a substantial 1.5-2x premium to other emerging markets, eventually slumping to a trough of a 60% discount to global emerging markets.

Poland was the only European Union economy to avoid recession during the 2008 global financial crisis and continued to grow by 2-3% more than most of its European peers over the next several years. The October 2015 election of the right-wing populist Law and Justice Party, and in particular its efforts at judicial reforms, brought Poland in persistent ongoing conflict with the European Union and led to a flight of capital and confidence from the market. This persisted through the pandemic until October 2023 when former European Council President Donald Tusk emerged as the new prime minister. During this 8-year period, and despite that economic growth continued to outperform regional and EM peers, Polish equities underperformed the rest of emerging markets (and its regional peers5) by -58%. Poland, which in the 15 years prior traded in a range around a 10% discount to the rest of emerging markets, hit a trough valuation of a 60% discount.

China’s post-GFC fiscal stimulus engineered a “soft landing” that may have saved the global economy from a much deeper recession, but did not stimulate its stock market. In the five years post-GFC, while economic growth continued at a blistering pace, the Chinese market was flat. A speculative bubble briefly formed in 2015, which was shortly followed by a collapse in prices back to the level of the previous 5 years. It took the 2017 rise of Chinese tech giants Tencent, Alibaba, Baidu, and others to see the market breakout, followed again by the 2020 breakout of all global tech during the pandemic. While the market hit its historic high in absolute terms in the first days of January 2021, its relative outperformance peaked on October 30, 2020. Days later, On Nov. 2, 2020, Alibaba cancelled the spinoff IPO of its fintech arm “Alipay” following founder Jack Ma’s negative public comments about China’s financial regulators. This was followed by a series of pronouncements, investigations, and fines into China’s tech sector, a ban on private tutoring that shutdown several companies widely held among global investors, and the cancellation of the IPO for Chinese ridesharing company Didi. By the end of 2021 (months before China began its draconian Covid lockdowns that sent the market into a further tailspin) Chinese equities had underperformed the EM xChina index by -38%. The lost confidence (and economic slowdown) caused by the Covid lockdowns was followed by defaults and a near shutdown of the real estate market. At its trough, China underperformed EMxChina markets by -59%. Pre-pandemic, China had been trading at an average of a 15% premium to EM xChina valuations. By the beginning of 2022, Chinese stocks slumped to a 20% discount to EM xChina and troughed at a 35% discount in 2024.

Following the historic 1994 election of Nelson Mandela as the first president of a free South Africa, South Africa’s real GDP growth averaged 4% per year for the next decade plus and it became a darling of investors as corporate governance standards far exceeded most emerging market peers. South Africa appeared poised to become the gateway to a frontier of new economic growth across Africa. Initially, the 2009 election of Jacob Zuma appeared to bring only a slightly more populist tilt to an otherwise continuing legacy of the moderate political economy installed by President Mandela. But Zuma’s kleptocracy eventually spread across the government and economy and sapped economic growth and investors’ goodwill. Beginning in October 2015, the first major court loss for President Zuma set in motion nearly a decade of political infighting and stagnation in the country. South African equities underperformed their emerging market peers by -40% at their trough in Oct. 2020 (-35% through February 2024 and the election of a new coalition government). In the decade prior to this period of political upheaval, South African equities traded at an average 20% premium to emerging markets, slumping to a 30% discount at trough.

After the most recent decade of outperformance for U.S. equities and the now acceptance that U.S. corporate governance is the envy of global markets, it’s easy to forget that this was not always the case. The fraud/governance/accounting scandals of 2001-02 that ensared corporate giants such as Enron, Global Crossing, Tyco, Worldcom, and Xerox among others, set off years of reform and cast a pall over American markets. From the end of 2002 until late 2007, the U.S. underperformed its developed x-US peers by -30%. However, unlike all the other episodes in this discussion, U.S. equities did not see a relative slump in valuations vs their peers (relative valuations were essentially flat).

On Aug. 15, 1971 U.S. President Richard Nixon shocked the world when he announced that the U.S. was abandoning the gold standard that had been the bedrock of the global monetary system for a generation. The overnight change in the global political economy was dubbed the “Nixon Shock” and set in motion a reordering of global financial markets over the next 15 years. While the relative underperformance of U.S. vs global markets during this period is almost entirely due to the depreciation of the U.S. Dollar against other major European currencies and the Japanese Yen, like with our other examples, it reflected a material repricing of the U.S. market in relative terms. From the Nixon Shock until the Plaza Accords in September 1985, the S&P 500 underperformed its developed x-US cohort by -46%, -25% vs Europe. For the decade prior to 1971, the U.S. traded at an estimated premium valuation of around 50% compared to most major European markets and roughly in-line or an occasional discount to the Japanese market. Over the subsequent 14 years the U.S. traded down to a trough 50% discount vs comparable European markets, and a mere fraction of the Japanese market. Harvard professor and former chief IMF economist Kenneth Rogoff has already made the argument that today’s episode of policy upheaval is most similar to the Nixon Shock, and expects the depreciation of the U.S. Dollar to follow a similar path, or to go even further..

Reliving the Rhyme?
The question for investors today is whether we are truly at the precipice of another such regime change in U.S. political economy or whether the volatility of Q2 merely reflects historically peripatetic policy communication. While U.S. markets are still well below their developed market peers year-to-date on a common currency basis, they have already fully recovered since the April 2 “Liberation Day” announcements.7 This would not be the first time that the markets have missed such long-term paradigm shifts. The U.S. market also outperformed other developed markets through the end of 1971 before embarking on their long underperformance over the next 15 years.
At a minimum, we err on the side of extreme caution at this time. We think the most likely path for U.S. equities over the coming 5-10 years is to underperform non-US equities. Whether this underperformance emanates from the weight of higher equity valuations, slower U.S. growth, higher rates/debt burdens, USD weakness, capital flight, and/or policy uncertainty remains to be seen. Indeed we think all of these factors are likely to be at play, roughly in reverse order of importance as listed above. Policy uncertainty, bred by a distrustful and polarized electorate, will lead to net capital outflows, USD weakness, higher debt burdens from fiscal populism/policy incoherence, slower growth (aggravated by labor shortages due to changes in immigration policy), with more room to fall from stretched valuations.
- The now removed section 899 of the U.S. Budget Bill threatened to impose taxes on foreign portfolio investments on investors from countries named at the discretion of the U.S. Treasury as “discriminating” against U.S. economic interests. This came in addition to the proposed remittance tax, which would be a global first at a national level.
- From JD Vance’s “new sheriff” speech in Munich until Trump’s 90-day post-Liberation Day tariff pause.
- Worldwide Google Trend data is structured relative to each search term, not relative to all search terms. A score of 100 represents the peak popularity of search interest for the term during the selected time period. A value of 50 means that the term is half as popular as at its peak. A score of 0 means there was not enough data for this term. Google Trend data methodology was significantly revised in Dec. 2021. National-level search Google Trend “Interest by Region” is constructed relative to all search data for that “region” during the specified time period.
- If PM Meloni can survive as PM until September 2026 it will constitute the longest stretch in power of any Italian PM since 1953, and is already the longest since the GFC
- -55% vs MSCI Hungary or MSCI Czechia, -62% vs MSCI Romania, -68% vs Baltic markets.
- Numbers reflect the difference in percentages from estimated valuation averages prior to the period in study to trough valuations during the period. Numbers can be greater than 100% if the market previously traded at a premium to peers and subsequently traded at a discount.
- Since JD Vance’s “new sheriff” speech in Munich, U.S. markets remain -7% behind EAFE markets in prices and -15% in valuations.
This report is neither an offer to sell nor a solicitation to invest in any product offered by Xponance® and should not be considered as investment advice. This report was prepared for clients and prospective clients of Xponance® and is intended to be used solely by such clients and prospective clients for educational and illustrative purposes. The information contained herein is proprietary to Xponance® and may not be duplicated or used for any purpose other than the educational purpose for which it has been provided. Any unauthorized use, duplication or disclosure of this report is strictly prohibited.
This report is based on information believed to be correct but is subject to revision. Although the information provided herein has been obtained from sources which Xponance® believes to be reliable, Xponance® does not guarantee its accuracy, and such information may be incomplete or condensed. Additional information is available from Xponance® upon request. All performance and other projections are historical and do not guarantee future performance. No assurance can be given that any particular investment objective or strategy will be achieved at a given time and actual investment results may vary over any given time.