
“If it Ain’t Broke, Don’t Fix It”
45 years of de facto Fed independence appears increasingly at risk. President Trump has already installed one Fed Governor, is attempting (possibly illegally) to dismiss another, and has triggered market speculation about his ability or willingness to even dismiss the Chairman. What does this mean for markets?
There is a long line of literature in economic theory, beginning with the groundbreaking Rogoff 1985 paper about the importance of legal (de jure) central bank independence for positive economic outcomes. This has been followed by decades of supporting research leading to the proliferation of reforms worldwide to promote central bank independence. However, there is now a growing body of empirical evidence to demonstrate the importance of de facto independence of central banks – i.e., independence from perceptions of political influence – in addition to legal or de jure independence. These analyses extend both globally and over long-time horizons. We will summarize here four highly relevant such recent studies, which we feel best address our present moment, including two studies into the specific effects of President Trump’s political attempts to influence Fed policy.
The empirical research suggests that the recent bout of perceived political interference at the U.S. Fed will lead to higher inflation than would have otherwise occurred and higher long-term rates, regardless of any actual change in policy response. The greater or more persistent the pressure continues to be, the higher the magnitude of those outcomes.
“The empirical research suggests that the recent bout of perceived political interference at the U.S. Fed will lead to higher inflation than would have otherwise occurred and higher long-term rates, regardless of any actual change in policy response.”
Sticks and Stones… But Maybe Words Can Hurt Too?
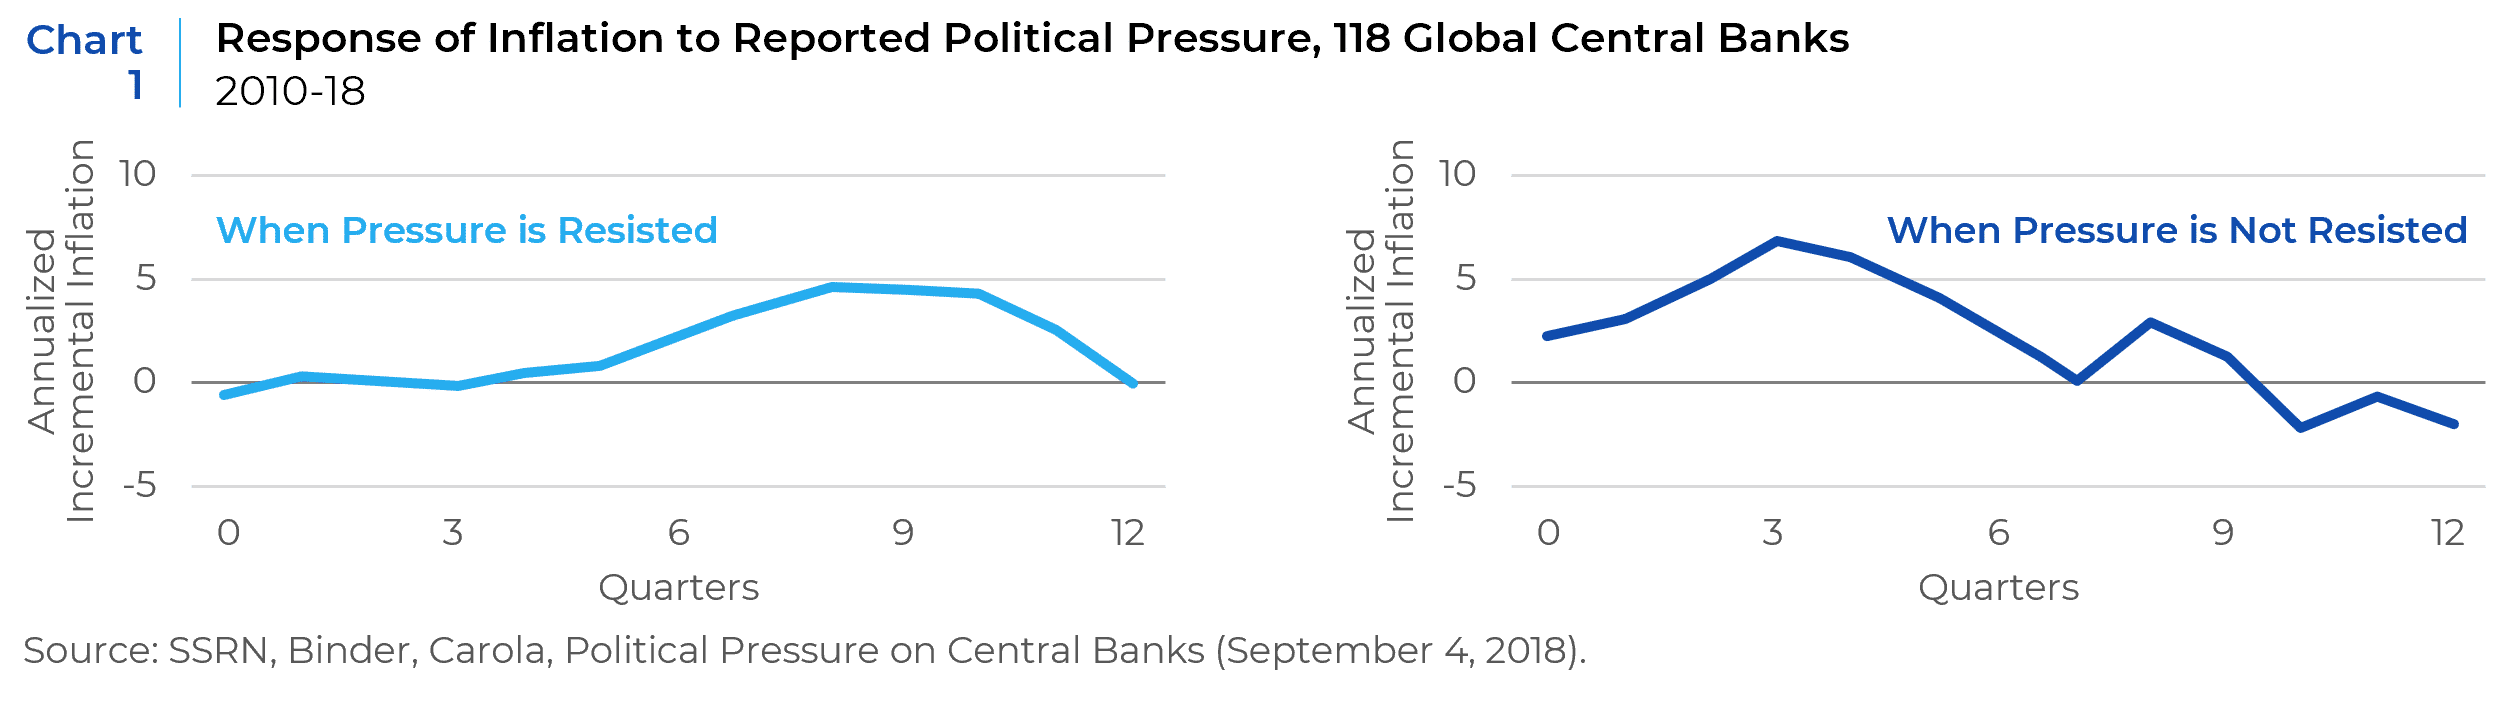
A 2021 study evaluated the political pressure faced by 118 different global central banks from 2010 to 2018. In that sample, about 10% of central banks faced political pressure or government interference (as identified by Economist Intelligence Unit analysts) in an average year, and 39% did so at some point in the time sample. It observed that “political interference with central banks is a global phenomenon, occurring in all regions and in both developing and developed economies” … and “even central banks with high legal (de jure) central bank independence are susceptible to government pressure.” Indeed, the research even found that political pressure was uncorrelated with typical measures of de jure central bank independence.
Unsurprisingly, the pressure is almost always for easier monetary policy. Holding constant prior inflationary trends, GDP growth, and other relevant factors, this research finds that political pressure on average produces material rises in future inflation, but with different lags depending on the levels of perceived resistance. As shown in Chart 1, when there is resistance to political pressure, inflationary effects are lagged, peaking two years after the initial political pressure was reported. If the central bank is reported to succumb to pressure, the above-trend inflationary effects are more immediate, but still persist for about two years on average. The lagged effect may be due to eroding central bank credibility, which only manifests itself in the data after a few quarters, on average. This research would suggest that if President Trump’s interventions in Fed policy in mid-2025 can be judged to have been resisted, then we should expect to see the impacts on inflation starting in mid-2026.
But the U.S. Is Different, Right?
A 2024 paper from the National Bureau of Economic Research (NBER) studied the relationship of personal interactions between the sitting U.S. President and the Fed Chair or any governors from 1933 to 2016 and the correlation of those interactions with future, above trend inflation. As with the paper on political pressure across global central banks, the longitudinal study on the U.S. also demonstrates that the political pressure “response function” tends to persist for about two years. Similarly, the responses to real GDP and fiscal variables are not distinguishable from zero, but the inflationary shock is material. The study found that the price level response was more immediate but then continued to build persistently to a 5% higher price level after 4 years (see Chart 2). But it also measured the effect over time, especially following the Nixon-Burns era (see Chart 3). Most relevant for the present day, they estimate that “exerting political pressure 50% as much as Nixon did, over a period of six months, permanently increases the U.S. price level by more than 8% after several years.”
Moreover, Presidential political pressure on the Federal Reserve has had an even longer lasting impact on inflation expectations (see Chart 4). The study posits that this long-term effect emanates from “the combination of higher inflation and the public discussion around political pressure by the President in subsequent years leads private agents to adjust their expectations.” The study corroborates this finding with a systematic analysis of newspaper articles, which reveals that “the media coverage of political pressure rises with a meaningful delay after periods marked by many President-Fed interactions. Consistent with that evidence, the disagreement in inflation expectations also widens with the same delay. Once inflation is elevated and the public begins to argue whether political pressure might have something to do with it, inflation expectations begin to move.”

Ok, But Trump is Different?
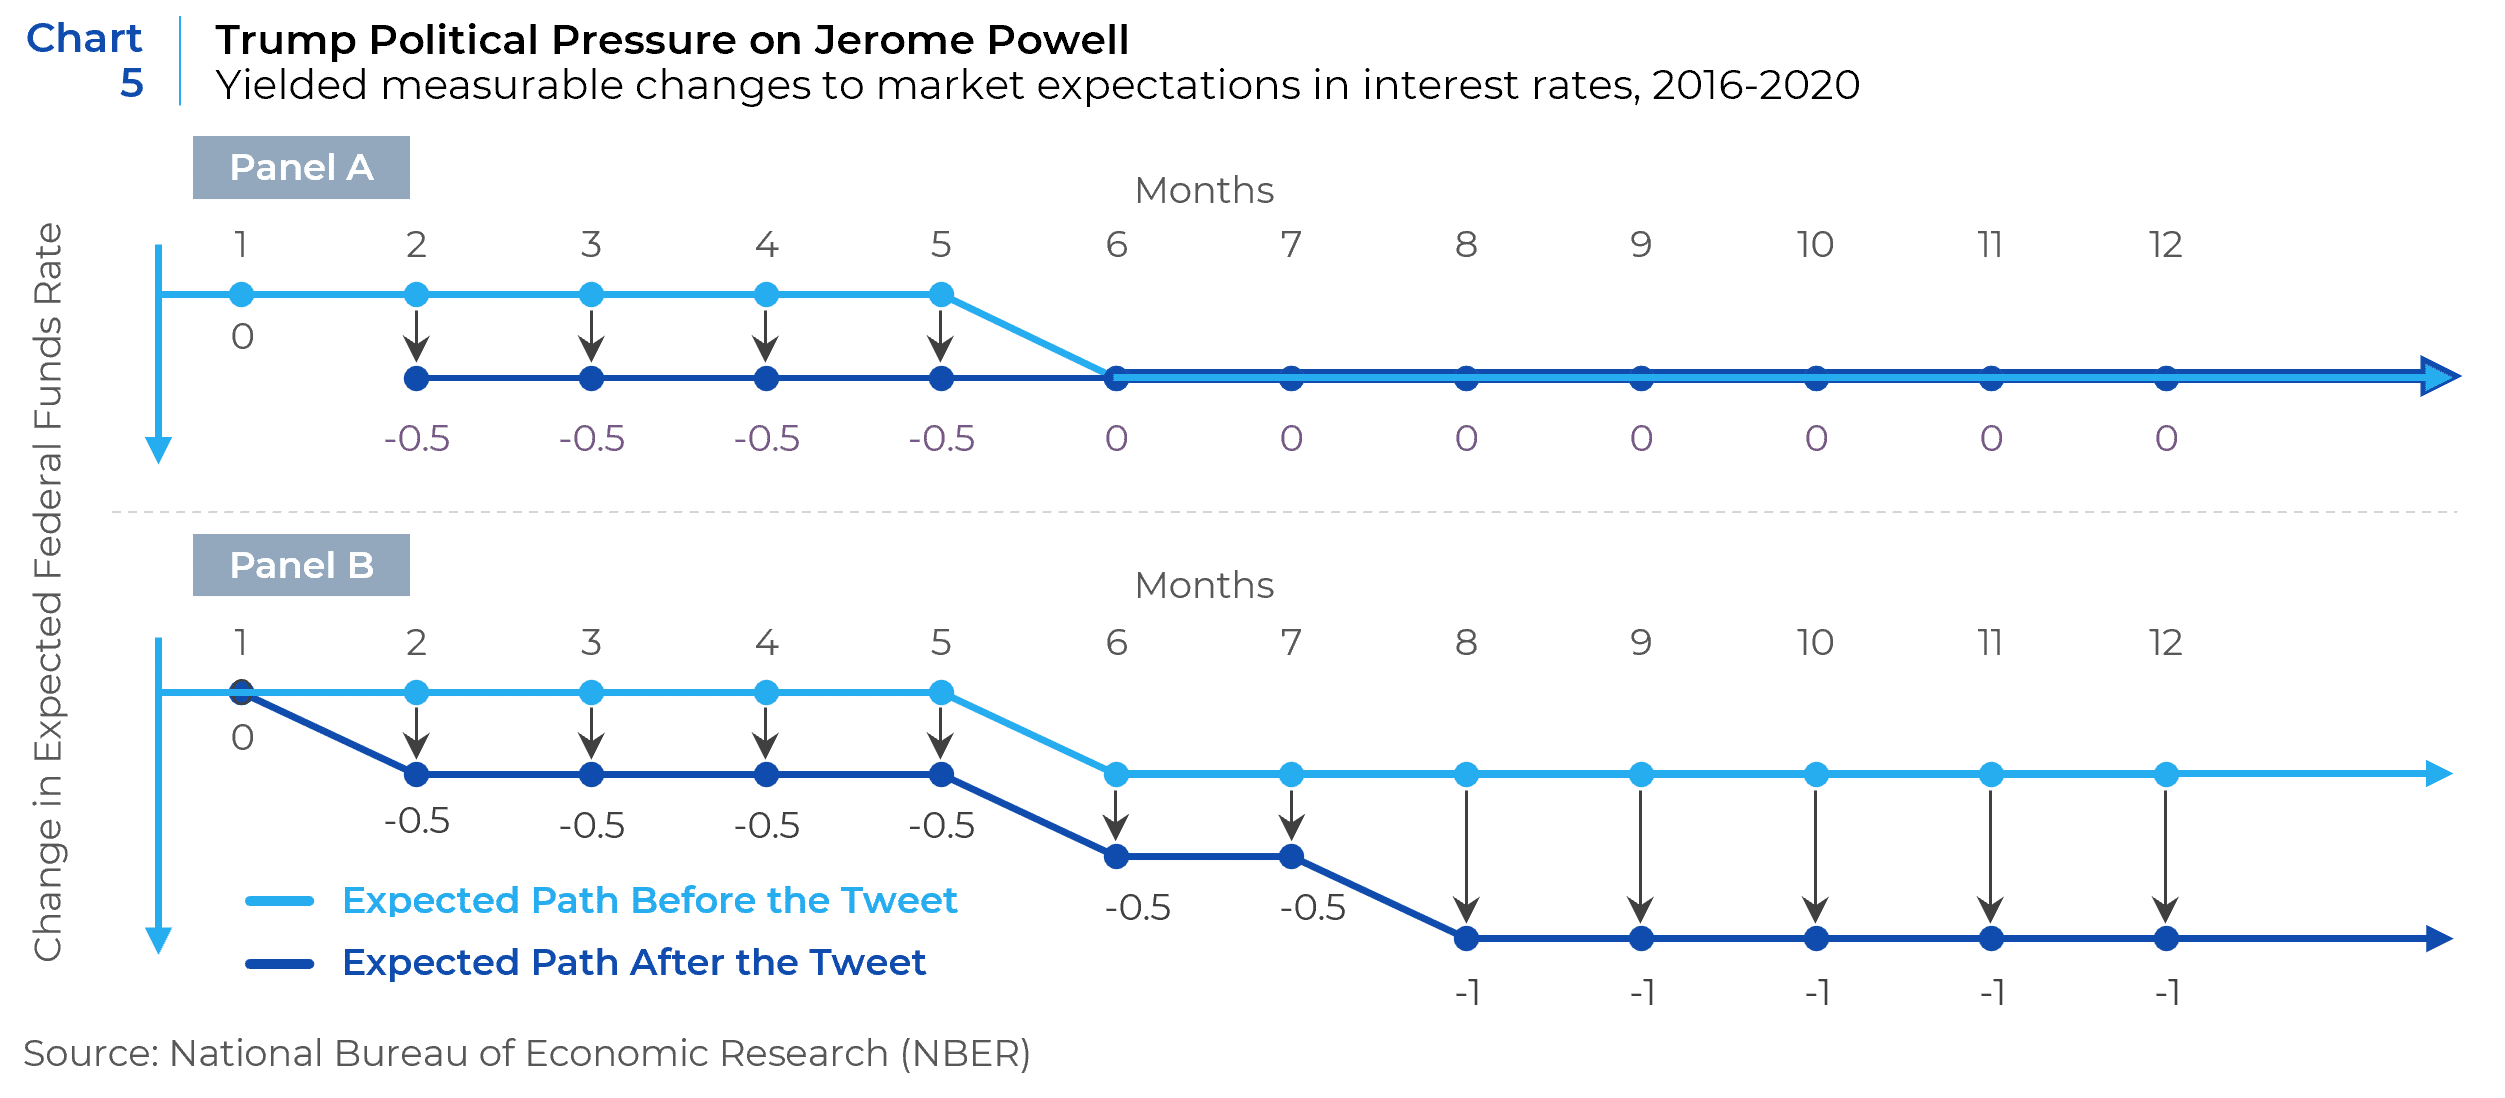
A different study published by the NBER looked at the effects of President Trump’s political pressure on the Federal Reserve and then Chairman Powell, during his first term. By evaluating price changes of various fed futures contracts coordinate with President Trump’s tweets advocating for lower rates, the study found that this political pressure significantly effected market expectations about the fed funds rate. “The revision in expectations caused by the tweets is present across all contract horizons with an effect that increases over time. Thus, the tweets do not simply affect expectations about the timing of changes that markets were already anticipating but instead move market expectations about the stance of monetary policy.”
Unlike the prior studies, which are across long periods of time and across global markets, isolating a recent episode in the U.S. market allowed the researchers to gauge the changes in market expectations in a meaningfully more granular fashion than was possible for the previous studies. Uniquely, it allowed a disaggregation of changes in market expectations over different future time horizons. As the study elaborates,
“Suppose that right before the tweet markets expect that the Fed will cut rates in six months, but not in the near future. If a tweet only induces a change in expectations about the timing of the already anticipated interest rate cut, a revision in expectations would be observed at only short horizons [see the top panel in Chart 5]. Our estimates documenting that the revision in expectations increases with the time horizon indicate that the revision in expectations is more pervasive. Markets are not sure if the Fed will succumb to political pressure in the immediate future (e.g., during the next FOMC meeting), but they assign an increasing probability of this outcome occurring at some point in the future. Suppose that, as in the previous case, before the tweet, markets expect that the Fed will cut interest rates in six months. If now the tweet generates a decline in expectations both at short and long horizons, we can infer that the tweet does not merely change the timing of an already anticipated decline (see the bottom panel in Chart 5).”
This reaction function of the market echoes both studies above, as well as other data the same NBER published paper added with regard two prior episodes in U.S. history of political pressure on the Fed, by President’s Johnson and Nixon. In these micro case studies, the research observed the change in future nominal Treasury yields with horizons of three months to one year following the public Presidential pressure. Note that in both cases, the largest effects accrued at the longest end of the curve and were persistent beyond the short-term event horizon of the news cycle (see Chart 6).

The change in expectations about future interest rate and inflation expectations at longer horizons is further commensurate with modern event studies as well. On June 18, 2019, Bloomberg published a story detailing how President Trump asked lawyers at the White House about the possibility of removing Chairman Powell. This article detailed how people familiar with the matter argued that Powell could not be fired without cause, but that he could be removed as Chairman and remain in the FOMC as a Governor. Chart 7 shows the response of expected short rates at different horizons to this news. While there is an observed decline in rates across all maturities, again the largest effects are observed at the longest maturities.

Yeah, But, Like, This Time Really is Different…. Right?!?
In case the previous empirical analyses remain unpersuasive, we offer even more timely research from the summer of 2025. Making use of the advent of liquid prediction markets on the platforms Polymarket and Kalshi, as well as the abundance of intra-day traded ETFs across various asset classes and maturities, economists were able to look at tick-by-tick market-created probabilities of Jerome Powell being fired by President Trump on July 16, 2025, and their impact on real-time asset price dislocations. The following charts show minute-by-minute changes in market estimated probabilities of whether Federal Reserve Chair Jerome Powell will leave office before the end of 2025 as measured by observable Polymarket contracts1 (“Polymarket” right axis) with the VIX, SPY, USD FX, and various maturities of Treasuries (see Charts 8a–8b, Chart 9 and Charts 10a–10f).


Note: UDN = Invesco DB U.S. Dollar Index Bearish Fund. The paper also showed near identical reaction functions for a falling USD against the EUR, JPY, GBP, CAD, CHF, and AUD. https://papers.ssrn.com/sol3/papers.cfm?abstract_id=5436816.

Note: Instruments refer to the iShares Treasury bond ETFs that span different portions of the yield curve: SGOV (0–3 month), SHY (1–3 year), IEI (3–7 year), IEF (7–10 year), TLH (10–20 year), and TLT (20+ year).
Pricing these estimates’ intra-day market impact, the observed increase in dismissal probability from 23 to 40 percent implies an aggregate equity loss of $125 to $214 billion for the S&P 500 and $150 to $256 billion for the total U.S. market. For the FX market, the implied depreciation of 3–4% would correspond to revaluation effects of about $200–250 billion in daily FX turnover and more than $1 trillion in valuation changes to the outstanding stock of U.S. securities held by foreigners. These FX estimates are in addition to the bond or equity value adjustments.
Of course, markets have already fully recovered in the short run, in absolute terms. However, as we discussed in our July 2025 paper “The Price of Distrust: How Much Downside Could There Be in U.S. Equities”2 history guides that at least the opportunity cost to a deteriorating political economy is likely to be meaningful.
The Takeaway
The empirical evidence is consistent across countries and over time. When political pressure is levied on central banks, and especially the U.S. Federal Reserve, regardless of whether it actually changes policy outcomes, the market’s expectations change. The evidence suggests that some of the damage has already been done, and we should expect higher long-term rates and higher inflation over the medium-term in the U.S. as a result of the perceived interference with the Fed that we’ve already seen. Indeed, given the aforementioned price recovery in U.S. assets since July 2025, it seems that very little of these risks are currently priced into the market, though this lag is also consistent with the historical evidence. In the advent of further political pressure, or worse, we would expect these trends to be further aggravated.
For U.S. allocators, the implications of this analysis are to reinforce our multi-year outlook for higher for longer rates in the U.S. The empirical evidence suggests that political interference at the Fed is likely to keep the yield curve steeper in the U.S. than it would otherwise be, or steepen it further, largely due to higher inflation expectations. The effects of this on insolvencies and balance sheets will be mixed, as short-rates move lower, but medium-long term refinancing rates do not improve (or worsen). More concrete is that this should exacerbate liquidity in the U.S. housing market, as mortgage rates stay elevated. Globally, higher long-term discount rates should benefit resource stocks, cyclicals, and commodities at the expense of long-duration growth assets.
- The study also showed Kalshi-based prediction markets, which had a similar reaction function across all observed asset classes/time horizons, but only the Polymarket chart here is shown as it was the more liquid market in this time period.
- Written weeks before, but posted effectively simultaneous, it turns out, to the July 16, 2025 episode of market fears over further Fed interference.
This report is neither an offer to sell nor a solicitation to invest in any product offered by Xponance® and should not be considered as investment advice. This report was prepared for clients and prospective clients of Xponance® and is intended to be used solely by such clients and prospective clients for educational and illustrative purposes. The information contained herein is proprietary to Xponance® and may not be duplicated or used for any purpose other than the educational purpose for which it has been provided. Any unauthorized use, duplication or disclosure of this report is strictly prohibited.
This report is based on information believed to be correct but is subject to revision. Although the information provided herein has been obtained from sources which Xponance® believes to be reliable, Xponance® does not guarantee its accuracy, and such information may be incomplete or condensed. Additional information is available from Xponance® upon request. All performance and other projections are historical and do not guarantee future performance. No assurance can be given that any particular investment objective or strategy will be achieved at a given time and actual investment results may vary over any given time.