
Perceived Inefficiencies in the Allocation Market
In a perfect world (for boutique managers), investment talent and execution would be enough. The best managers would prove their worth through performance, and allocations would follow. Anyone who has been involved with trying to grow the assets of a low AUM product knows that this reductive concept bears almost no relationship to the reality faced by boutique asset managers. Small products and firms face structural obstacles that their larger counterparts do not. It is a common refrain that this is a market inefficiency driven by behavioral biases. The reality is much more nuanced. Firms with small asset levels:
- Often operate below profitability and have less access to capital. Couple this with client concentration risk and the associated revenue fragility, it introduces significant business risk.
- May not have the back office, operations, and compliance systems and professionals necessary to meet the standards of large allocators.
- Will be excluded from searches when allocators have a maximum percentage of assets guideline (i.e. an allocator that is unwilling to be greater than 10% of a product’s total assets will need to exclude any product where current AUM isn’t 10x their typical allocation).
- May be difficult to source due to lack of database and consultant reporting.
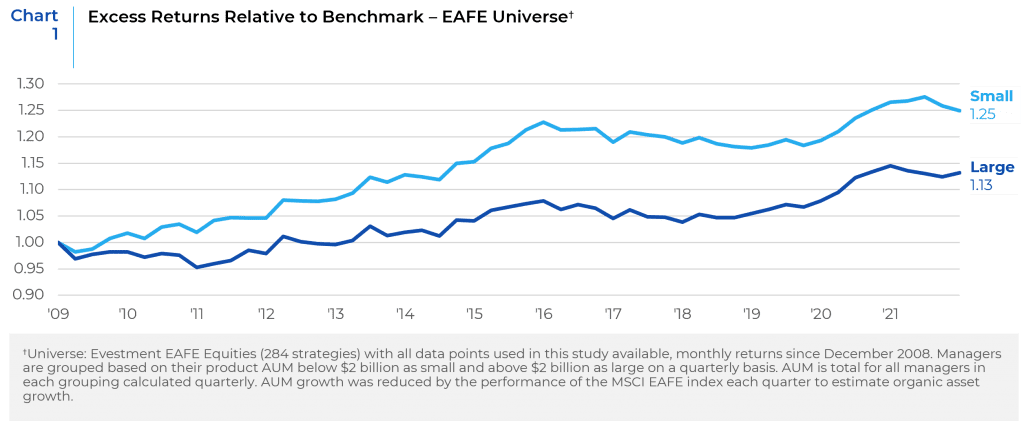
These are valid concerns and require significant resources to source, diligence, and safely invest in these boutique firms. However, this work is not without reward as lower AUM managers investing in developed non-us equity managers (product AUM below $2 billion) have been outperforming their large counterparts since the great financial crisis (Chart 1). We believe that the benefit of a low asset base is most pronounced in inefficient, capacity constrained markets. Developed international strategies are a good barometer of this effect having a large liquid market with enough inefficiencies for smaller managers to exploit. The return differential can be shown using excess returns relative to the MSCI EAFE index as well as the Aapryl1 style clone2. We believe the latter provides a more comprehensive estimate of a manager’s “value add”, removing the noise of their passive style performance (Chart 2) and thus the style biases of reporting strategies (e.g. value managers disproportionately not reporting returns into databases relative to growth managers during this period).
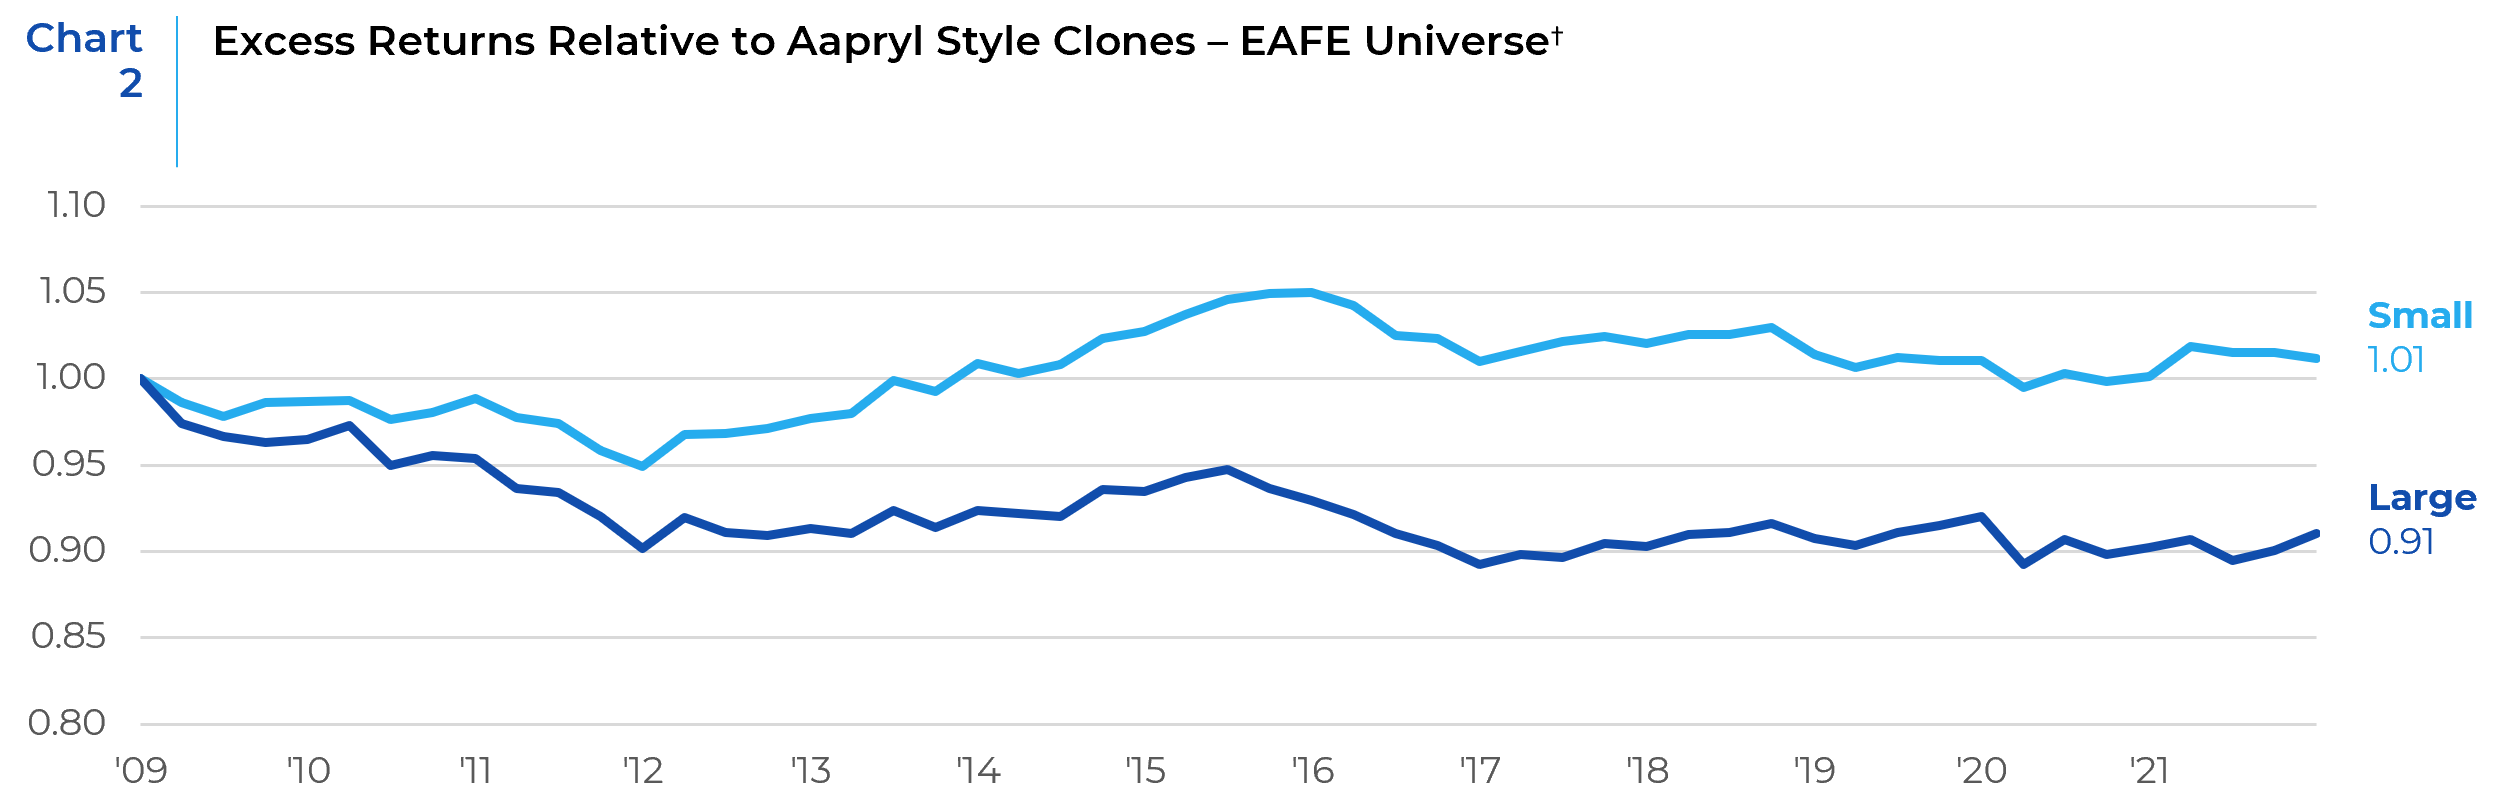
Small managers outperformed their large counterparts by 10% (Chart 2) in aggregate since 2008. Taking the styles into account, large managers failed to add value through skill, while small managers generated a small amount of alpha after accounting for their style.
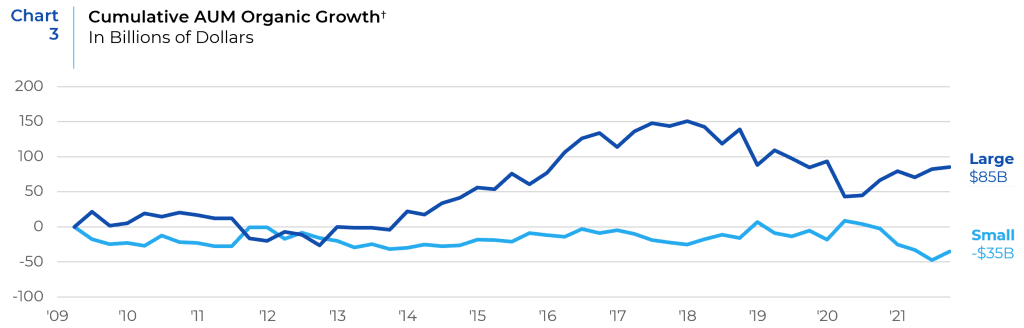
However, assets growth tells a different story….
Despite outperforming larger managers, small managers have been losing assets since 2009 while large firms have been enjoying solid organic growth. The past decade has been a boon for large managers from a business development perspective. Meanwhile, small developed international managers in total have been shrinking organically during the same period (Chart 3).
We believe that small, entrepreneurial managers have a structural performance advantage, particularly in capacity constrained strategies. These entrepreneurial firms can also be a vital source of portfolio management innovation. In order to take advantage of the performance benefits offered, allocators must dedicate the necessary resources focused on boutique managers. Allocators must be willing to partner with smaller firms to develop the necessary people, processes, systems and procedures required to handle institutional allocations. Beyond the potential performance advantage offered by smaller managers, allocators with a goal to increase the exposure to firms owned and run by women or diverse professionals will find that they are over-represented in the universe of boutique investment managers.
†Universe: Evestment EAFE Equities (284 strategies) with all data points used in this study available, monthly returns since December 2008. Managers are grouped based on their product AUM below $2 billion as small and above $2 billion as large on a quarterly basis. AUM is total for all managers in each grouping calculated quarterly. AUM growth was reduced by the performance of the MSCI EAFE index each quarter to estimate organic asset growth.
1 https://www.aapryl.com/wp-content/uploads/2020/08/Equity-Efficacy.pdf
2 https://knowledgebase.aapryl.com/glossary/clone-portfolio/
This report is neither an offer to sell nor a solicitation to invest in any product offered by Xponance® and should not be considered as investment advice. This report was prepared for clients and prospective clients of Xponance® and is intended to be used solely by such clients and prospects for educational and illustrative purposes. The information contained herein is proprietary to Xponance® and may not be duplicated or used for any purpose other than the educational purpose for which it has been provided. Any unauthorized use, duplication or disclosure of this report is strictly prohibited.
This report is based on information believed to be correct, but is subject to revision. Although the information provided herein has been obtained from sources which Xponance® believes to be reliable, Xponance® does not guarantee its accuracy, and such information may be incomplete or condensed. Additional information is available from Xponance® upon request. All performance and other projections are historical and do not guarantee future performance. No assurance can be given that any particular investment objective or strategy will be achieved at a given time and actual investment results may vary over any given time.