
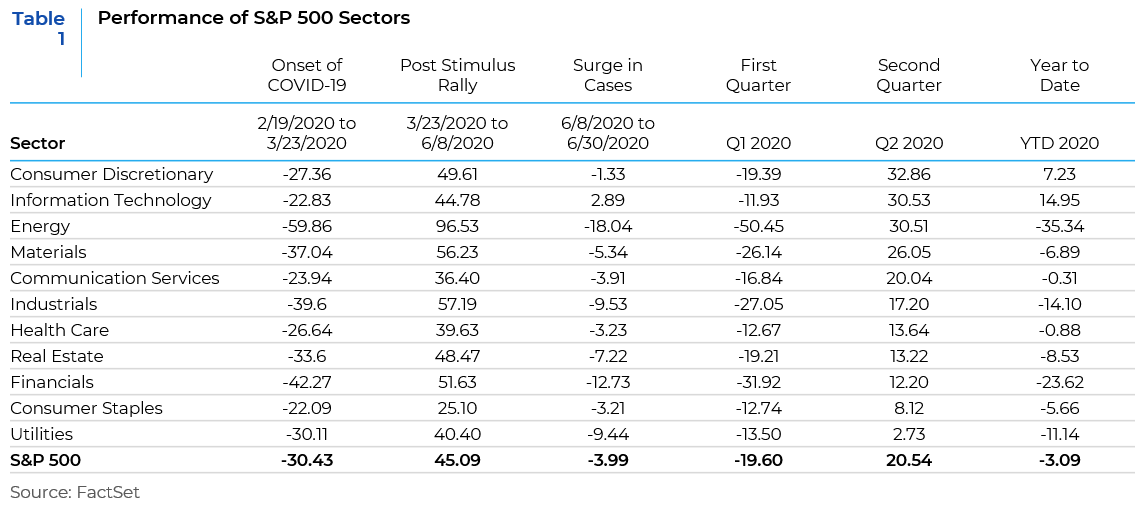
When this year began, no one could have predicted the path we would travel in just six short months. While the first quarter of 2020 was one of the worst on record, the second quarter was one of the best. Equity markets have experienced wild swings and high levels of volatility this year. Looking back, it feels like an entire market cycle occurred in a condensed period of six months. Table 1 below shows the sector leadership that was seen in the different phases of the market across the first half of the year.
- The bear phase (February 19th to March 23rd) was the market drawdown that was experienced with the onset of the pandemic and the closure of businesses throughout the country. The most cyclical sectors were hurt during this phase, with energy, financials, and industrials taking it on the chin, and consumer staples suffering the least, followed by technology and communications services which were led by FAANGM names.
- The recovery phase (March 23rd to June 8th) occurred after the Fed and Congress injected unprecedented amounts of monetary and fiscal stimulus resulting in a huge market rally. During the recovery phase, cyclical sectors led with a massive reversal in energy’s performance, followed by industrials, materials, and financials; while consumer staples and communication services brought up the rear.
- The consolidation phase (June 8th to June 30th) was characterized by a surge in coronavirus infections and a resulting brake in investor optimism with markets moving sideways to downward. During this phase, we saw investors again favor growth sectors like technology and consumer discretionary, and defensives like consumer staples and health care, while energy and financials were the laggards.
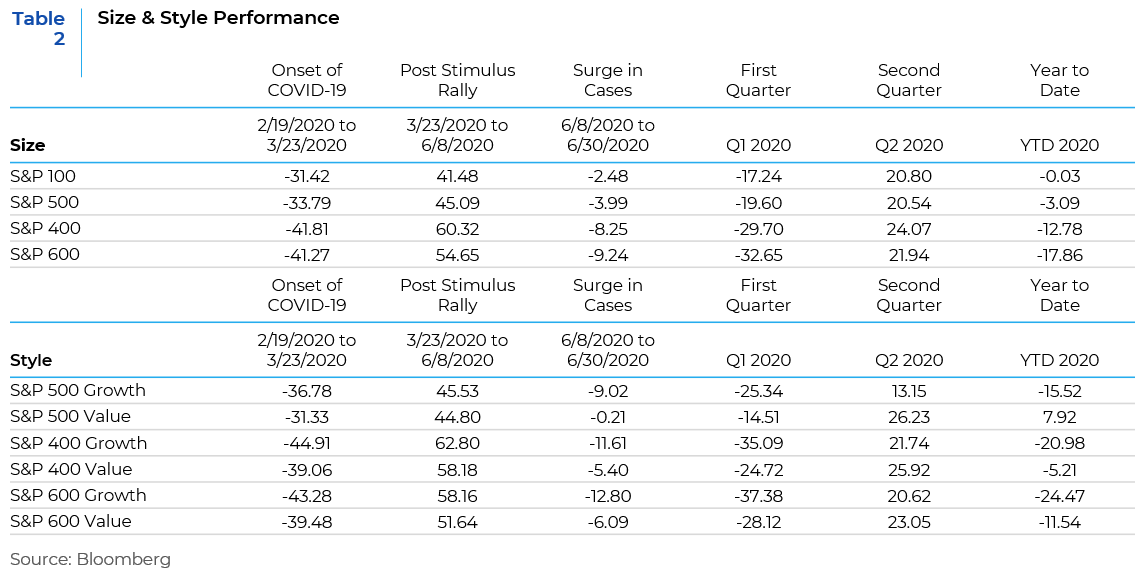
The S&P 500 has performed much better than might have been expected in a crisis like the one we are experiencing now. Index composition is a big reason behind that performance. While industries like hotels, restaurants and leisure, energy and airlines, which are highly vulnerable to virus-induced changes in behavior, have experienced sharp falls, firms in technology-related sectors and in health care that constitute a significant proportion of the index have been especially resilient to the coronavirus-induced slump in activity for obvious reasons. These are also the world’s largest firms with vast cash reserves and the strongest balance sheets. Some have even used it as an opportunity to secure their dominance, snapping up their weaker rivals. The five largest companies, for example, have announced a remarkable eighteen acquisitions between them since the crisis began. Thus, on the style and size front, we find large cap growth companies continue their winning streak from the past two years to dominate performance for the first half of 2020. There were some brief periods of resurgence for value, especially in the post-stimulus phase, but that petered out with the surge in coronavirus infections and concerns regarding the sustainability of an economic recovery. A more pronounced change in size performance was seen in the second quarter where small cap and mid cap companies were able to get marginally ahead of their large cap counterparts.
Increased Uncertainty Regarding the Outlook for Corporate Earnings
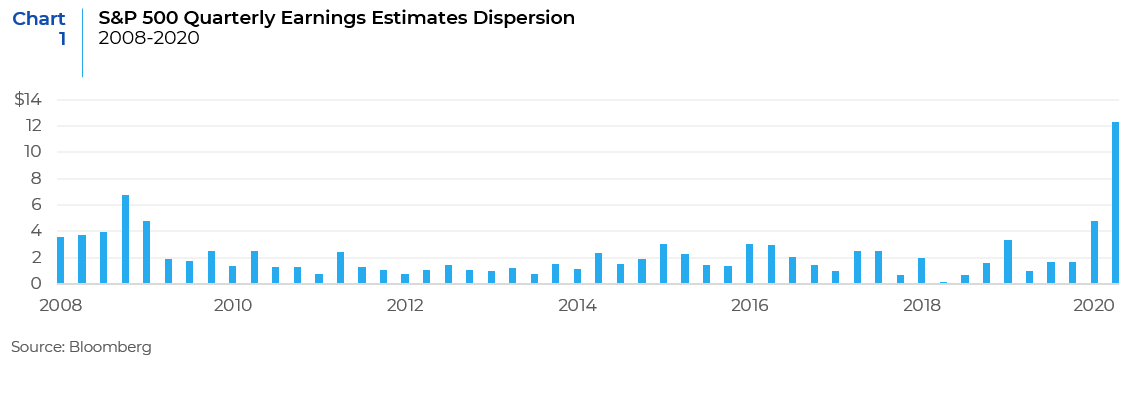
The current forecast for S&P 500 earnings is for an approximate 40% decrease versus second quarter 2019. Estimate dispersion, the difference between the highest and lowest estimates is at its highest level since the Financial Crisis as seen in Chart 1. The increase in dispersion is due to the inability or unwillingness of companies to provide forward guidance – only 20% of companies in the S&P 500 have provided guidance over the last three months. The bottom line is that there is little clarity on what the path forward looks like. Given the strong market rally over the past quarter, the outlook provided by companies will be very important in providing some insights on the sustainability of the rally for the rest of the year.
The Course of the Coronavirus Pandemic
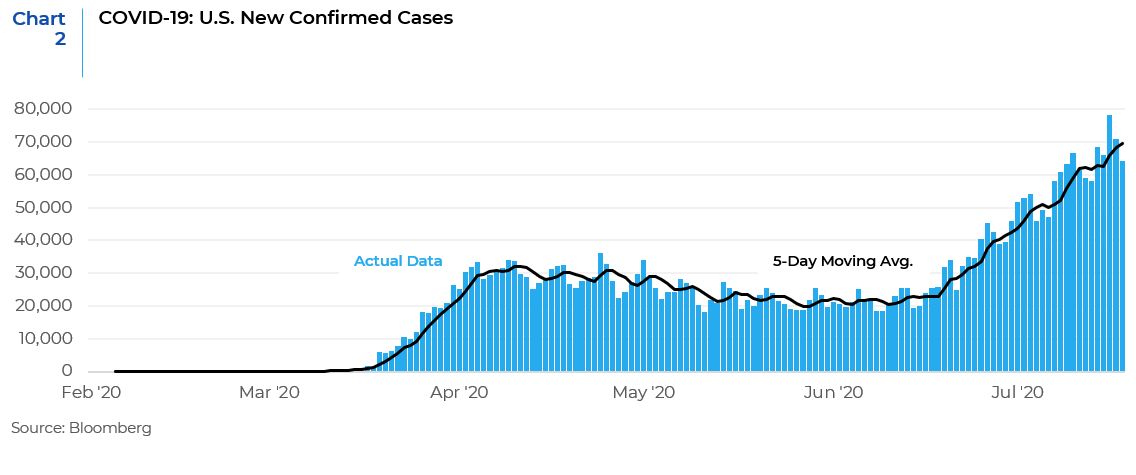
When the coronavirus pandemic started to show signs of improvement in late April and early May, all 50 states reopened in some form or shape, and the resulting increase in mobility and economic activity created a resurgence in infections. Further exacerbated by the non-adherence to CDC guidelines, especially over holiday weekends, and a general sense of fatigue and exhaustion accompanied by a letting down of the guard regarding stay-at-home and social distancing practices, the country is now facing a wave of cases that is much bigger than what was experienced in March and April. This has forced many states to dial back the pace of their reopening. Equity markets have been fairly resilient in the face of these rising infections. It seems that investors are primarily concerned with the Fed’s actions and fiscal stimulus, largely ignoring the high degree of uncertainty surrounding the pandemic’s path. A range of support measures for the financial system were enacted in late March that helped stem the plunge in asset prices. At the same time other major economies have generally been recovering. Additionally, this current wave of coronavirus in the U.S. is not yet as severe as the first in terms of hospitalizations and deaths. However, if increasing virus trends persist there may be a need to further restrict the reopening of the economy, and in that case equity markets may see another downturn. Additionally, the availability and production of a viable vaccine in the next two to three months will spur markets to rally further and provide a wind behind the back for risk assets.
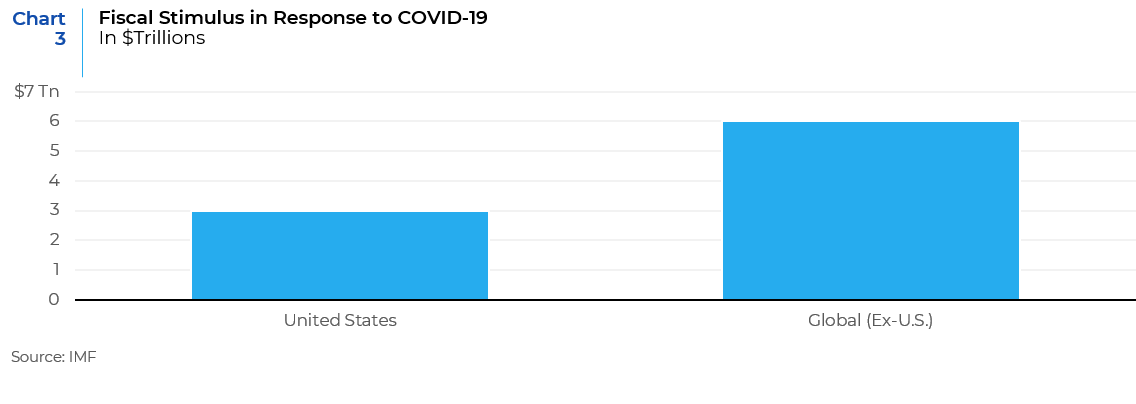
The Possibility of Further Stimulus
Leaders in Washington are weighing the benefits and costs that a second round of stimulus payments would have on the U.S. economy. President Trump wants another $2 trillion coronavirus relief package, while House Democrats have already passed a $3 trillion relief package (the HEROES Act) in May. Senate Republicans want a smaller $1 trillion bill but may capitulate in the face of a growing rise in cases that could derail the improvement in economic activity. Congress is highly likely to pass a new relief bill before the last day of the current session which ends on August 7. If some agreement is reached between the White House, Senate, and the House of Representatives, and there is another stimulus package that is put in place in the next couple of months, it could provide a near-term boost to equity markets.
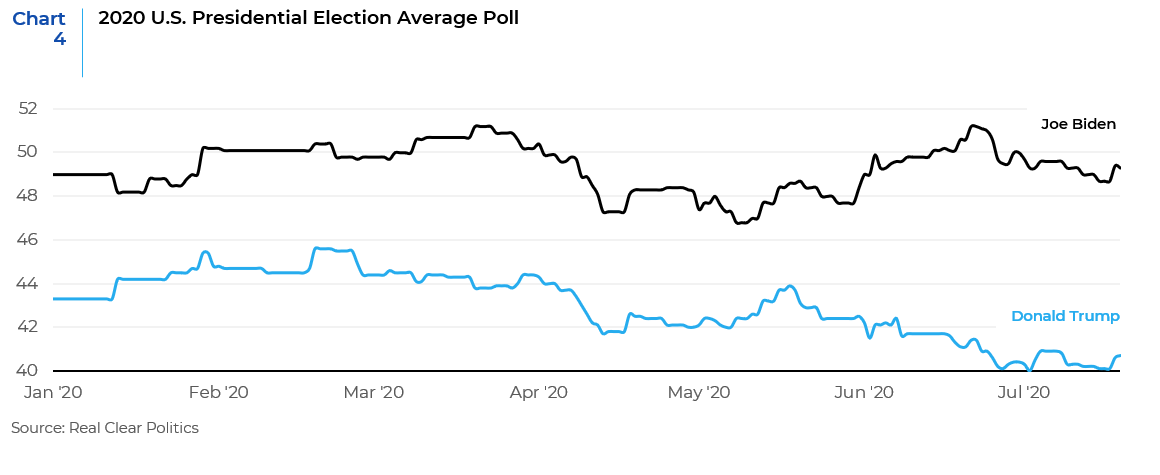
Political Uncertainty
The lead up to the presidential elections in November 2020 and the results of those elections are going to impact the performance of equity markets. The U.S. presidential candidates present two of the most divergent political approaches in recent memory, with policy differences on how to address the COVID-19 crisis; the tax system; the role of government in health care; immigration and the workforce; climate change; and the approach on foreign policy. Volatility normally rises ahead of elections, but it could be worse than usual this time given the extreme polarization of political views, the risk of vote recounts and contested results, Supreme Court interventions, and refusals by either candidate to concede. Moreover, the U.S. Congressional outcome is an equally important factor. Whether the same party will control the White House, Senate, and the House or whether there is a gridlocked government will influence the path of the markets. If the Democratic party wins the U.S. presidency as well as the majority in the U.S. Congress, the markets will have to price in the potential for increases in personal capital gains taxes, corporate tax increases, additional business and environmental regulations, expansion of the Affordable Care Act, price caps on pharmaceuticals, more regulations for banks and technology companies, changes in immigration policy and other initiatives that would be very different from the current administration’s stance. Over the coming weeks and months, the anticipated outcome of the elections will be hotly debated and analyzed. While it is unknown how things will eventually play out, the volatility in equity markets is likely to remain high for at least the rest of this year.
Geopolitics
While COVID-19 has dominated news for much of the year, a larger, longer-lasting problem has been unfolding in the background, which many businesses may soon need to contend with – the rapid deterioration of U.S.-China relations. The pandemic has added major points of contention to the friction points between China and the United States. These include the pre-pandemic negotiations on trade and tariffs, the question of responsibility for the pandemic itself, Beijing’s decision to put an end to the “one country, two systems” in Hong Kong and its imposition of a national security law there, and the increasing tensions in the South China Sea. All of this has resulted in an acceleration in de-globalization trends in recent years. These trends have gained further strength amid the coronavirus pandemic. Therefore, one of the biggest economic trends going forward may be the relocation of supply chains to bring them closer to the U.S. The employment cost differential of manufacturing in China versus the United States has dropped dramatically as the cost of employment in China has risen. More importantly, automation, robotics, lower energy costs, and higher productivity in the United States provide reasons for industries to return to the United States. As countries increasingly focus on health concerns, national security, and other domestic issues, globalization is at risk of being further cast aside. Structural shifts toward domestic production and regional supply chains would have major implications for the global economy and financial markets.
In conclusion, while there may be near-term risks for equities, and the market may give back some of its recent gains over the rest of the year, the possibility of retesting the March lows are unlikely, primarily due to the willingness of the Fed and Congress to use monetary and fiscal stimulus to prop up the economy. The highest probability scenario has equity markets ending the year relatively flat and GDP growth negative through the end of the year with debt levels growing to unprecedented levels. Many of the uncertainties that are causing market volatility right now may subside next year with the availability of a vaccine, the elections out of the way, and an economy that has started to heal with a recovery in consumer spending and employment. In the long run we still have to deal with the bigger issues pertaining to geopolitics and unprecedented levels of government debt.
This report is neither an offer to sell nor a solicitation to invest in any product offered by Xponance® and should not be considered as investment advice. This report was prepared for clients and prospective clients of Xponance® and is intended to be used solely by such clients and prospects for educational and illustrative purposes. The information contained herein is proprietary to Xponance® and may not be duplicated or used for any purpose other than the educational purpose for which it has been provided. Any unauthorized use, duplication or disclosure of this report is strictly prohibited.
This report is based on information believed to be correct, but is subject to revision. Although the information provided herein has been obtained from sources which Xponance® believes to be reliable, Xponance® does not guarantee its accuracy, and such information may be incomplete or condensed. Additional information is available from Xponance® upon request. All performance and other projections are historical and do not guarantee future performance. No assurance can be given that any particular investment objective or strategy will be achieved at a given time and actual investment results may vary over any given time.