
The new decade of 2020 began in an unprecedented way. There were two distinct phases to the first quarter of the year. The first was characterized by an equity market surging to all-time highs despite concerns about a manufacturing slowdown, geopolitical tensions, and US political uncertainty. This phase quickly faded into the recesses of memory following the emergence of Covid-19 as a global pandemic, largely shutting down the international economy while racking up a huge death toll. The S&P 500 dropped more than 35% from its 19-Feb record high through 23-Mar, before gaining some ground back on hopes of adequate monetary, fiscal, and public-health policy responses. The end of the quarter saw both the US and the global economy likely in recession, an epidemic that is still spreading, and day-to-day life largely on hold.
US equities were down in Q1, falling into a bear market and ending a bull run that dated back to 2009. The S&P dropped 20%, logging its worst quarter since Q4’08. The index’s worst two days since 1987 came in mid-March (down 11.98% on 16-Mar, down 9.51% on 12-Mar). The S&P also saw two days of 9%+ gains (13-Mar and 24-Mar) in the extremely volatile March period. Treasuries were notably stronger, with yields dropping to long-term lows and the curve steepening somewhat. The dollar strengthened against the euro and pound while it lagged the risk-sensitive yen. The dynamic was driven by a broad-based liquidity grab amid solvency concerns as well as the unwinding of leveraged trades. Gold was up 4.8% for the quarter, its sixth consecutive quarterly gain. Oil lost more than 66%–its worst quarterly performance ever–after the collapse of the OPEC+ output agreement and the demand shock from the expanding coronavirus pandemic.
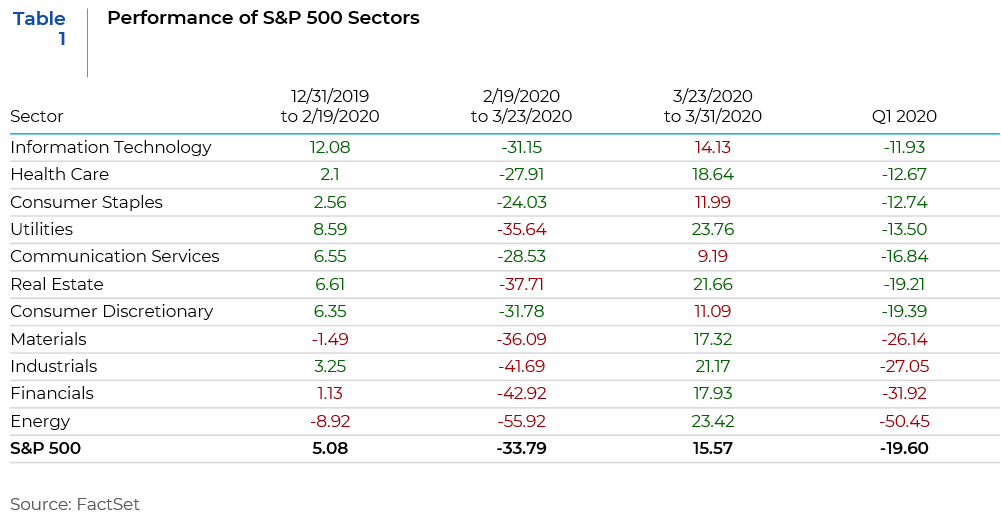
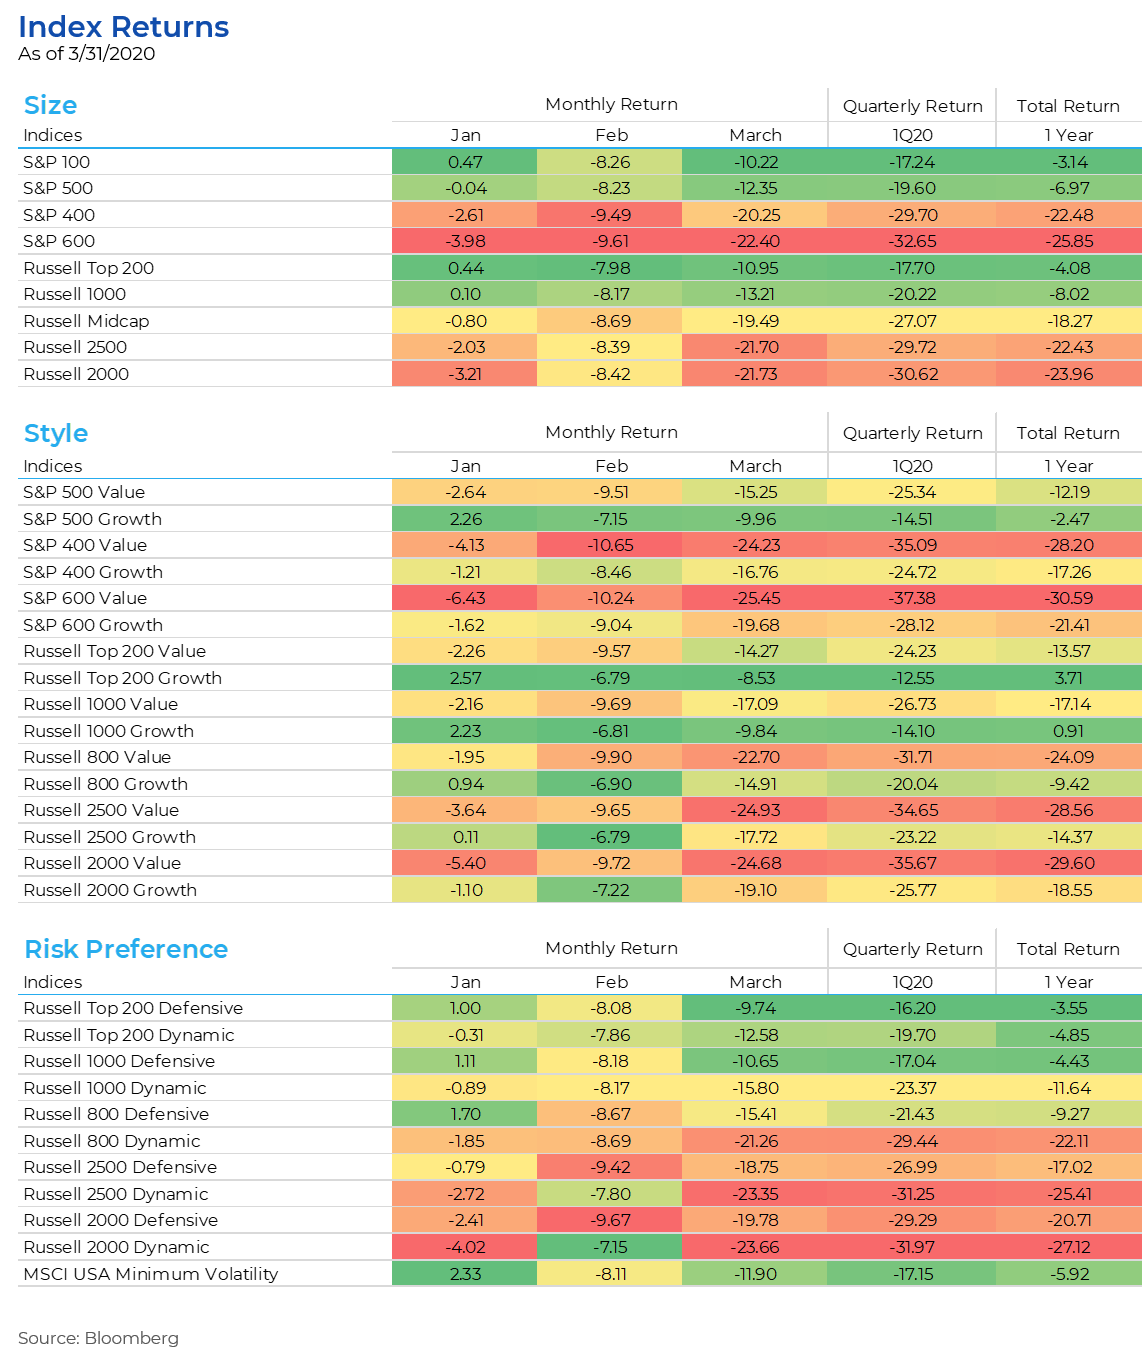
As seen on the Index Returns table (at the end of this article), large cap growth names in defensive sectors weathered the storm best while smaller, value-oriented companies fared the worst during the quarter. These performance trends were reversed for a few short days after the announcement of stimulus on 23-Mar but have subsequently been reinstated. As seen in the Sector Performance table (Table 1), secular growth names with large market shares and strong balance sheets in Information Technology, Health Care, and Consumer Staples were the ones that held up the best. These sectors were outperforming in the pre-crisis period and their performance became even stronger as the COVID-19 crisis intensified. Information Technology led the market on a relative basis with the software industry holding up best due to increased demand as companies around the world geared up to implement work from home policies and equip its workforce to work remotely. Health Care, and especially Biotechnology companies did well amidst the race to develop potential vaccines or cures for tackling COVID-19. Grocery chains and food product companies in the Consumer Staples sector saw sales spike from the huge trend of hoarding food and consumer products as “shelter-in-place” and “stay-at-home” policies were announced by various states across the country. Energy was by far the worst performing sector as the price of oil dropped to under $20 per barrel. In addition to the expected negative impact on global demand due to COVID-19, a dispute between Russia and Saudi Arabia resulted in both countries increasing supply in an already saturated market. Financials were hit by the significant drop in interest rates, slowing economic and corporate activity, and the sell-off in the equity markets.
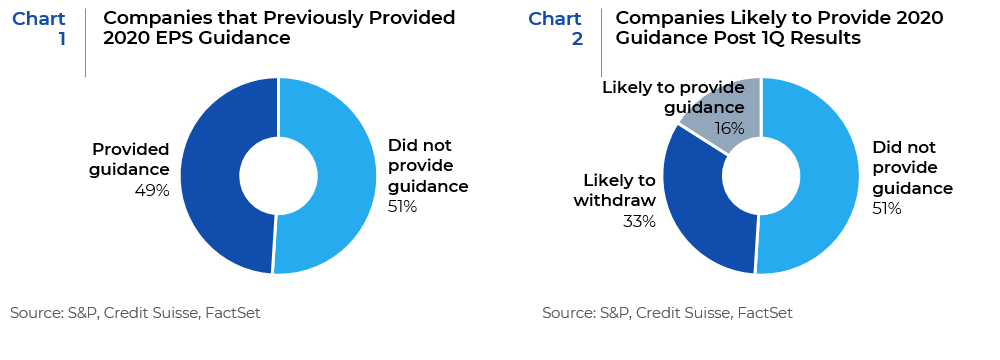
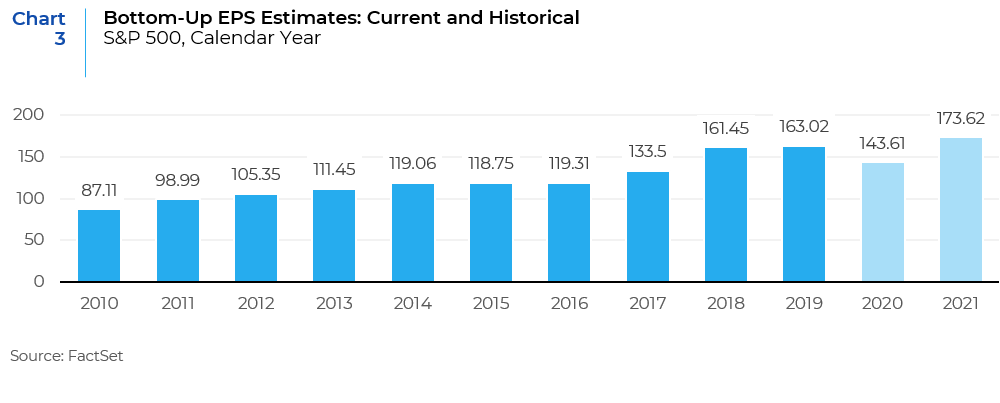
Adding to the uncertainty of the equity markets is the lack of visibility in earnings guidance and estimates. While earnings estimates have been declining rapidly, few companies have withdrawn or reduced their earnings per share guidance. In the coming weeks many firms will most probably lower or rescind previously issued EPS guidance and there will be further declines in earnings estimates and therefore changing company valuations. This lack of visibility makes it more difficult for investors to identify which companies provide good investment opportunities in the coming quarters. Despite this uncertainty, analysts appear to be optimistic and expect earnings to bounce back sharply in 2021. Whether those expectations materialize or not is a matter of debate.
The Road Ahead
Equity markets are most probably going to follow a 3-phase roadmap – (1) the crash that happened after markets reached their peak on February 19th, 2020; (2) the rebound that is being experienced since March 23rd, 2020 as a result of the massive monetary and fiscal stimulus injected by the Fed and Congress; and lastly (3) the slow drift and increased volatility that will happen before an eventual bottom is found and markets start recovering and gradually climb back to their pre-crash levels.
This roadmap and the length of the second and third phases will be very dependent on the duration and direction of the COVID-19 crisis. If the rate of new infections and rate of deaths decreases significantly and is accompanied by the discovery of a cure/vaccine, then both the markets and the economy will rebound strongly. The aggressive policy initiatives that have been taken so far have prepared the foundation for a recovery once the virus outbreak blows over. Stock prices will rally before the economy finds a bottom. However, if the crisis lingers and the shutdown lasts beyond the second quarter of 2020, then markets can become very messy. In that case the government will have to unveil more stimulus, or both the economy and the equity markets will experience sharper nosedives than witnessed so far.
The question is what shape will the roadmap take? There is a virtual alphabet soup out there with strategists predicting V, W, L, Y, and U shapes for recovery. The “V” shape is the most optimistic and can occur in a scenario where the crisis is controlled shortly, and the recovery is quick and sharp. The “L” shape is the direst of all scenarios where the economy flatlines and there is almost no hope of recovery. The “W” shape is that of a double-dip scenario and has a moderate probability of occurring, especially if there is a second wave of virus infections later in the year after a recovery in the short-term. The “U” scenario appears to have the highest probability of occurring with a gradual decline and recovery and no clear trough. The upward slope of the “U” likely will be a bumpy and slow rise with markets displaying high volatility and changes in factor leadership along the way.
Markets move on sentiment in the short term but respond to fundamentals over the medium and longer term. This is reflected in the performance of the factors we use in our stock selection models. Going into 2020, value was poised for a strong rally given the increasing signs of a global business cycle recovery, but the COVID-19 outbreak significantly impaired the performance of value stocks amidst rising liquidity and solvency risks. Since then value has sold off hard and is now trading at a steep discount. This makes an increasingly strong case for a value comeback and we have seen a few days of this trend towards the end of the first quarter. However, the sustainability of this trade remains highly questionable. In all probability large secular growth companies, especially those in the Technology sector, with strong balance sheets, low leverage, and high profitability will continue to perform better in the current environment. It is only in the most optimistic scenario outlined above will value stocks have a sustained performance run. With that in mind we have increased the exposure of our diversified portfolios to larger, less volatile names. We continue to own names with reasonable valuations, strong earnings momentum, and quality, to strike that fine balance between providing downside protection and leveraging upside potential in our clients’ portfolios. While we are committed to our investment discipline and are confident that we will outperform markets in the long run, we are not complacent about markets or our models. We understand that extreme market shocks and black swan events like the one we are experiencing happen infrequently, but when they do happen, they provide opportunities for improving our processes through examination and analysis.
Important Disclosures: This report is neither an offer to sell nor a solicitation to invest in any product offered by Xponance® and should not be considered as investment advice. This report was prepared for clients and prospective clients of Xponance® and is intended to be used solely by such clients and prospects for educational and illustrative purposes. The information contained herein is proprietary to Xponance® and may not be duplicated or used for any purpose other than the educational purpose for which it has been provided. Any unauthorized use, duplication or disclosure of this report is strictly prohibited.
This report is based on information believed to be correct, but is subject to revision. Although the information provided herein has been obtained from sources which Xponance® believes to be reliable, Xponance® does not guarantee its accuracy, and such information may be incomplete or condensed. Additional information is available from Xponance® upon request. All performance and other projections are historical and do not guarantee future performance. No assurance can be given that any particular investment objective or strategy will be achieved at a given time and actual investment results may vary over any given time.