Market Outlook
Article Summary
Our Q1 2017 Global Market Outlook, Who Knows? Navigating the Known Knowns and Underappreciated Knowns In Current Market Consensus, examines vulnerabilities in the bullish consensus narrative underpinning global equity markets. The key vulnerabilities discussed are U.S. dollar appreciation, elevated U.S. Small Cap valuations, questionable assumptions behind the bullish narrative on EM equities, as well as gathering geopolitical risks. The outlook also includes a note on whether the conditions for active management making a comeback may be falling into place. Following up from our 2013 study evaluating the cyclical and structural dimensions of active management performance, the outlook notes that with stock correlations seemingly falling, market dispersion rebounding, and the Fed’s plan to raise interest rates two to three times this year, the conditions necessary for active management to regain its luster are in place.
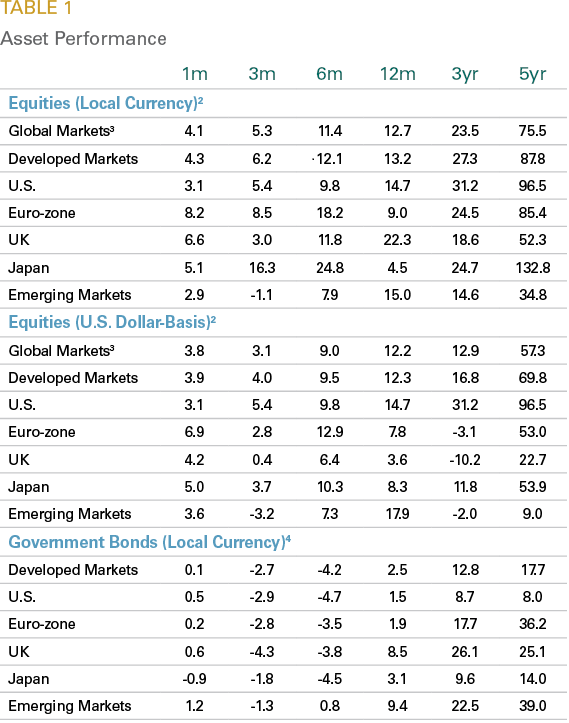
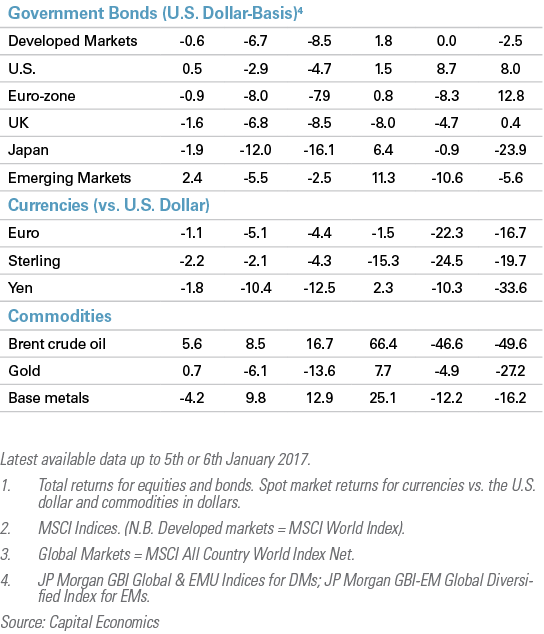
2016 was a year in which the pundits and other “wise ones” were roundly repudiated and the market just didn’t care. No major election played out as predicted by our so called best minds; and despite various predictions of Armageddon should the angry mob prevail, global equity markets shrugged off each event – Brexit, President Trump and the Italian Referendum – as minor rain showers that refreshed their combined 8% gallop over the course of the year. TABLE 1 summarizes the return of key indices and asset classes.
The title of this paper reflects our belief that 2017 is unlikely to bring reprieve from the policy and market uncertainty which ruled its predecessor. We of course borrowed and amended this title from former defense secretary Donald Rumsfeld’s description of the risks of the Iraq invasion and occupation to the press. It turns out that he was grossly over-confident in what he believed to be “known knowns” and thoroughly underappreciated the ‘known unknowns” and “unknown unknowns”. Those unknowns came back to ultimately haunt President Bush’s (43) legacy. We believe that the current equity rally and the underlying consensus narrative which supports it will face such a fate over the next three years. Therefore, BELOW, we examine the vulnerability of the consensus narrative underpinning the recent market rally relative to “underappreciated knowns” in a broad range of areas.
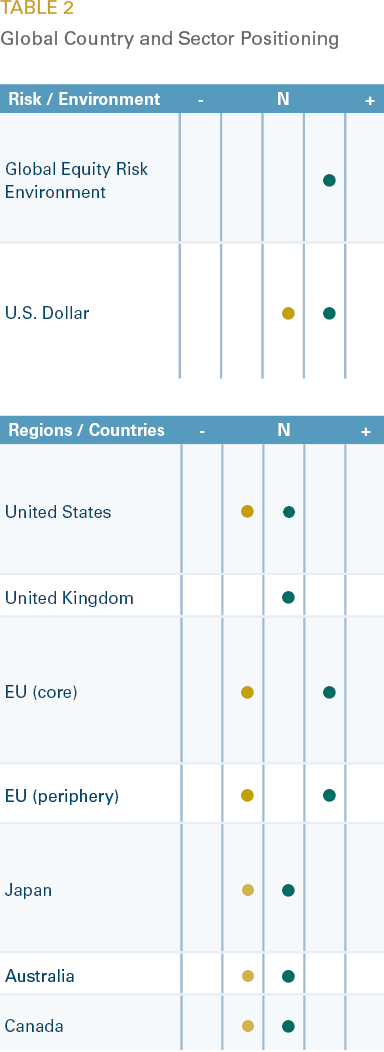
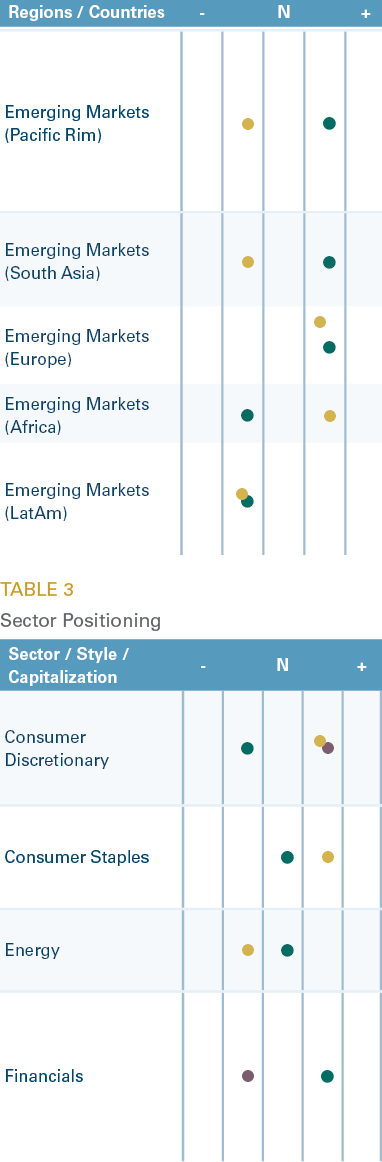
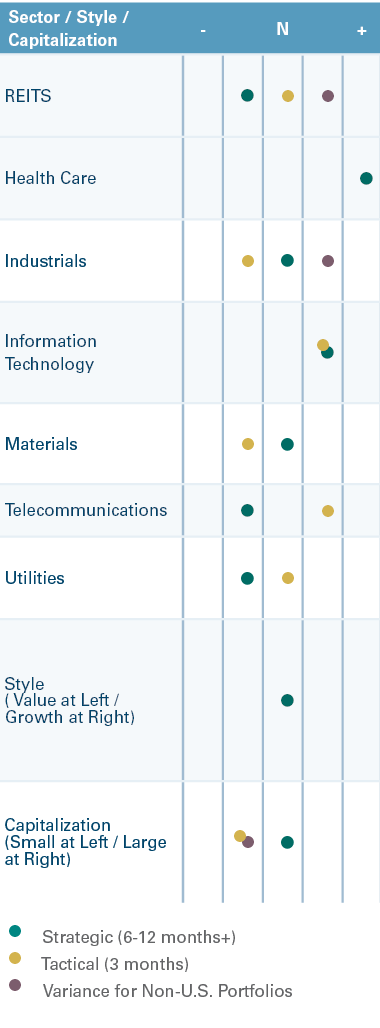
Our strategic and tactical views with respect to key countries, sectors and factor are summarized in TABLES 2-3.
The rationale for our global country and sector positioning can be found in the PDF version located HERE.
Who Knows? Navigating the Known Knowns and Underappreciated Knowns In Current Market Consensus
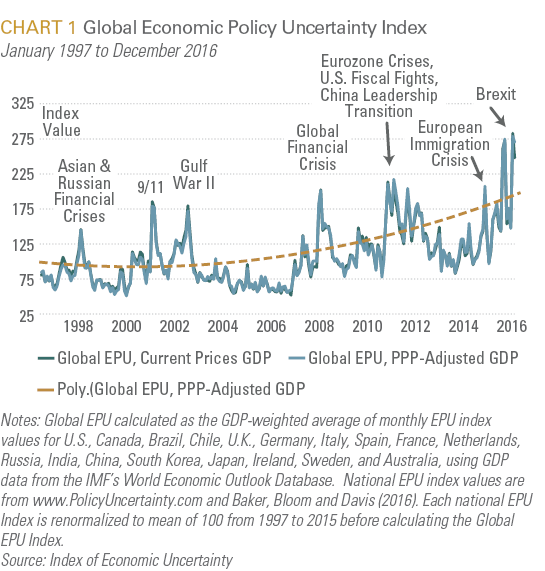
This year, investors will once again be holding their breath as France, Germany and the Netherlands face their own electoral crucibles amidst a wave of change elections that have rewarded populist insurgents. In the U.S., we will have a President whose self-described negotiating tactic is uncertainty and whose unconventionality is most frequently communicated through 140 character tweets. Finally, China’s ongoing struggle to maintain labor stability while addressing structural overcapacity caused by decades of credit fueled investment growth is likely to face even more uncertainty from a U.S. administration who has promised to label it as a currency manipulator, impose tariffs on its exports and challenge its regional hegemony. It is no wonder that policy uncertainty, which has markedly increased after 2008, is now at an extreme. (See CHART 1).
In such an environment, it is critical to be mindful of the changing policy and macro risks and most importantly, to evaluate the governing assumptions that underpin market consensus for underappreciated risks or “unknown” risks. For example, while we expect global equities to be higher in 12 months than they are today, the risks for stocks are tilted to the downside over both a shorter-term horizon of less than two months and a longer-term horizon exceeding two years.
The primary risks to the recent rally in global (and particularly U.S.) equities are that they are overbought; based on a consensus which is essentially pulling forward a “good news” narrative that is highly vulnerable to disappointment. Expectations of long-term U.S. earnings growth have also jumped to over 12%, something that strikes us as rather fanciful. Renewed rumblings in China could also spook the markets for a while. Consequently, we expect global equities to correct 5-10% from current levels, setting the stage for a more durable recovery. Once that recovery begins, higher-beta developed markets such as Japan and Europe should outperform the U.S. As the economy gains steam and inflation propagates towards the end of 2018, the Fed’s tightening is likely to get to more contractionary levels. A higher/rising fed funds rate will lead to multiple contraction. Since 1979 (when forward EPS data commence), every time the Fed has embarked on a tightening cycle, the forward P/E multiple has been squeezed. This eventually, is more likely to occur towards the end of 2018.
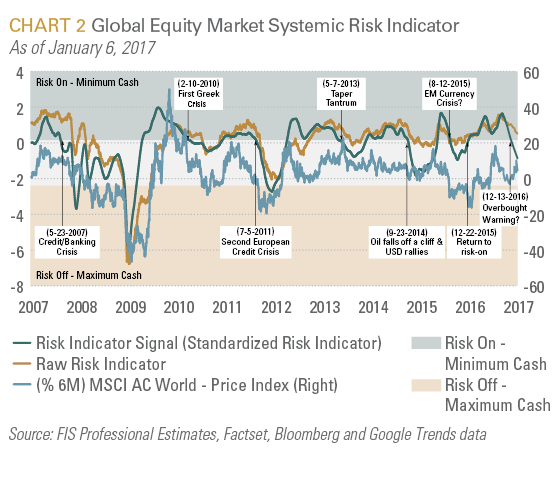
Underscoring short term momentum risks, as discussed in our summary investment outlook ABOVE, our equity risk models appear to be flashing caution. While both the social media and futures component of our equity sentiment models are solidly in risk-on territory; the systemic equity risk model which has developed a solid forecasting record over its 7-year existence; crossed from risk-on to risk-neutral on December 13 and remains there today. (See CHART 2).
The Path of the U.S. Dollar is the Single Biggest Risk
The US dollar enters 2017 up by 25% against a broad basket of currencies over the last two-and-half years. The single biggest question for investors in 2017 and an underappreciated risk is whether the dollar continues its bull run. A dollar reversal would be largely neutral. A move by the dollar into even more over-valued territory would be destabilizing in various ways. Additional dollar strength in advance of the tax changes would hammer US manufacturers, leading to a sharp deterioration in the US trade balance that could prompt an even more protectionist response from Washington. And a stronger dollar could inflict severe pain on EM dollar denominated debt and certain EM equity markets.
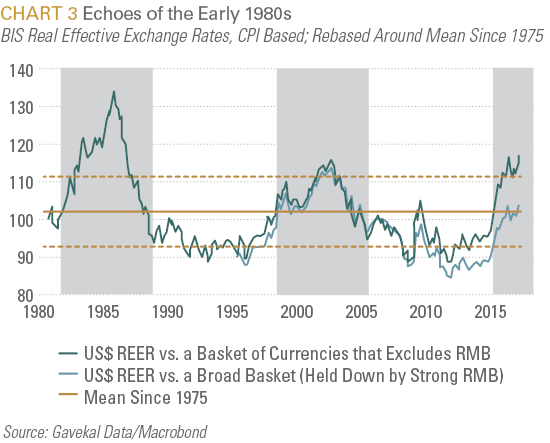
Dollar bears note that the currency is overvalued in historical terms, argue the market is overly fixated on the possibility of President-elect Trump’s reflationary policies in the US, while ignoring improved fundamentals elsewhere. The dollar is now overvalued by most measures. Against the euro, yen and pound, the dollar is now one to 2.5 standard deviations overvalued relative to its average long-run deviation from purchasing power parity. Similarly, against a broad basket of currencies that excludes the renminbi, the US dollar is now stronger in real effective terms than at any time since 1986. (See CHART 3). With the dollar’s strength eroding US competitiveness, the rally is over-extended, especially against the euro, which is being held back by in part by an underappreciation of the area’s economic growth and exaggerated fears over upcoming European elections in 2017. (See our summary on geopolitical risks in TABLE 4 on PAGE 13).
Dollar bulls point to widening yield spreads and the likelihood that proposed changes in the US corporate tax code could prove strongly dollar-positive. Additionally, while exchange rates may revert to the mean in the long run, deviations often go further and last longer than valuation-focused analysis suggests. With US interest rates rising, and yield spreads over Europe and Japan widening, there is a strong possibility that the dollar could move from overvalued to even more overvalued in the course of this year.
The dollar could also get a big boost from tax changes proposed by president-elect Donald Trump and Congress. Like the Reagan presidency in early 1980’s, the dollar entered into a structural bull run because of shifting ROIC (return on invested capital) expectations, as a result of so called “animal spirits” unleashed by corporate and capital friendly tax changes. The Congressional Republican majority is discussing border tax adjustments that would favor US manufacturers at the expense of foreign competitors in order to redress perceived imbalances in the global trade regime. Similarly, Trump’s advisors are discussing what would amount to a subsidy for US exporters and/or a tariff on foreign imports into the US. Such policies would theoretically strengthen the U.S. dollar to a degree that would eliminate any competitive advantage gained by US business. Greater policy visibility following Trump’s inauguration on January 20 could add further momentum to the US dollar’s climb.
We believe that the dollar is due for short term consolidation but will end the year higher in 2017, particularly against the Japanese yen and the Chinese RMB. While this will increase the geopolitical risks associated with protectionism, it will also constrain inflation and possibly result in another feedback loop whereby Fed policy hike intentions are thwarted by decelerating inflation.
“Known Knowns” That the Market Is Discounting
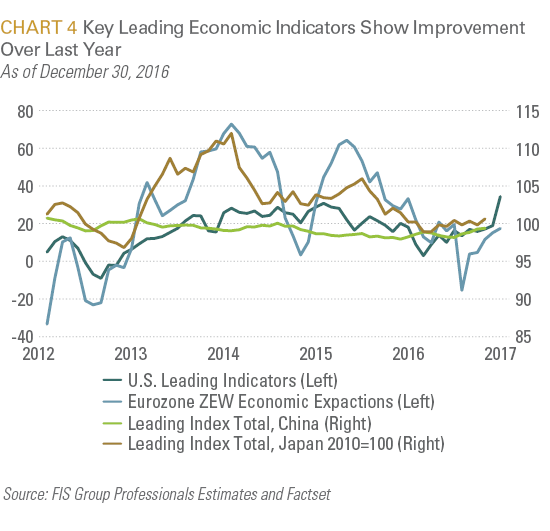
Both U.S. and non-U.S. equities are discounting a significant pickup in growth and earnings. This is supported by leading economic indices which show a marked improvement in economic activity irrespective of policy changes in 2017. (See CHART 4).
The nine key elements underpinning the bullish consensus on U.S. equities are:
- Continued improvement in corporate earnings, primarily as a result of stabilizing oil/commodity prices. After growing an estimated 2.6% in Q3, consensus forward EPS estimates now stand at $131.5, which represents a 12% year on year increase. In 2018, EPS estimates forecast a further 12% growth.
- Continued growth in real wages and income. In December, Average Hourly Earnings of all employees rebounded to 2.93% on a year on year basis (vs. 2.49% prior), which is the highest gain since May 2009 (+2.49% prior). Private wages increased in 13 of the 14 major industry sectors; with average wages increasing 2.89% Y/Y. This will initially boost aggregate demand and not materially impact corporate profits until well into 2018.
- Inflation trending higher in fits and starts as a result of dollar strength. With recent readings on headline CPI at 1.6% and core CPI at 2.1%; but well below the 4% and above levels that are historically associated with Fed induced bear markets and recessions. As we anniversary the drop in commodities prices, headline inflation should eclipse core inflation in 2017 and possibly climb to 2.5% by year end. Inflation at these levels is typically associated with P/E expansion because it allows corporations to raise prices. The link between P/E derating and high inflation is via the ebbs and flows of the fed funds rate or the discount rate.
- Higher interest rates at the long end of the yield curve because of 1 through 3 which while halting, will mark the beginning of the end of the 35-year long bond bull market. During the second half of 2016, rising treasury bond yields was largely driven by net selling during the September through October period; with China, which unloaded $128 billion between May and October, being the largest seller. Treasury and global bond yields are likely to rise further in 2017; with the pace and magnitude being substantially driven by selling by the PBOC and other central bank’s responses to improving global growth and inflation pressures. As we wrote about in our Q3 Outlook, we believe that we are in the last innings of the 35-year bull market. During the post-GFC period, asset allocation flows have heavily favored fixed income. As investors incur principal losses, some of those flows will enter the equity markets.
- Mildly higher interest rates at the short end of the yield curve as a result of two (or maybe three) 25bps. hikes by the Fed.
- Accelerating GDP growth to around 2.5%. Notably, the BEA recently reported that Real GDP increased by a seasonally adjusted annualized rate of 3.47% in Q3 2016, compared to the prior estimate of +3.12%. Overall, Q3 GDP increased +1.65% Y/Y.
- Fiscal expansion with President Trump jawboning erstwhile deficit hawks in Congress to combine tax cuts and offshore profits repatriation with higher defense and infrastructure spending.
- Elevated “animal spirits” unleashed by the rollback of Obama era regulations, particularly for the financial, healthcare and coal/oil industries.
- Possible protectionist measures which should advantage small cap and domestically focused industries at the expense of large cap multinational industries.
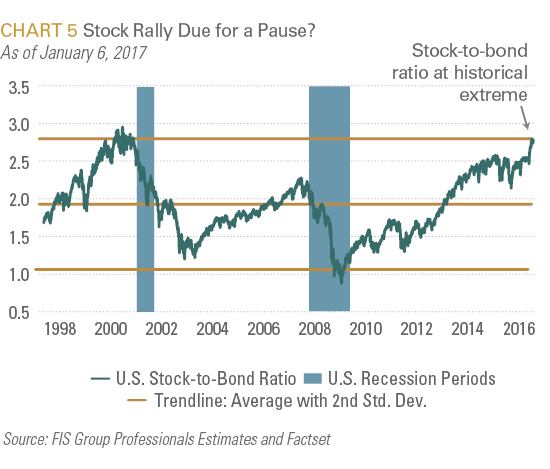
In combination, these expectations have fueled a 4.6 % post-election boom through December 31, 2016. During the first week of January, U.S. stocks rose again by 1.7%. Consequently, the stock bond ratio is now close to a two standard deviation extreme. (See CHART 5).
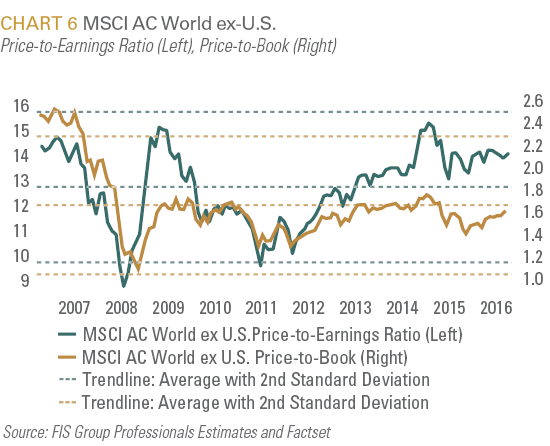
Non-US equity markts rallied by 4.5% in 2016. During the first week of January, they continued to advance by 1.9%. While the fundamentals vary across markets and while their valuations are less demanding than U.S. equities, they are no longer cheap. (See CHART 6).
The four primary elements of the consensus narrative for key non-U.S. markets are:
- Policy divergence from the U.S. as both the ECB and Japan continue to employ accommodative monetary measures that will generally support the U.S. dollar.
- While the ECB has curbed its purchase program from €80 billion to €60 billion per month, it has expanded the scope of issues eligible for purchase and extends its duration to at least December 2017
- In Japan, highly accommodative fiscal spending through the government’s large-scale stimulus measures combined with the BoJ’s 80 trillion yen per annum asset purchase and “QQE with Yield Control” programs to target zero percent on 10-year JGBs.
- Strengthening industrial production data and positive economic survey data in both Europe and Japan.
- Continued policy support by Beijing to promote growth and avoid labor unrest in advance of the communist party congress in September 2017.
- Higher operating leverage for both European and Japanese companies (that are also more leveraged to Chinese growth than the U.S.) as well as more attractive valuations provide more room for P/E expansion relative to the U.S.
So What Could the Underappreciated Knowns Be?
1. “Good news” may already be priced in.
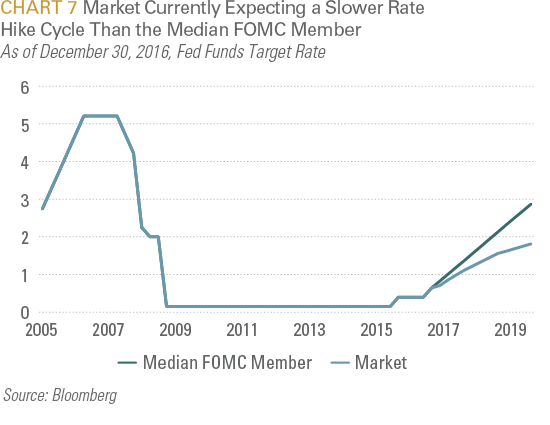
The consensus narrative described above has allowed investors to pull forward profit growth expectations into current prices; thus leaving less room for either earnings or policy disappointments. For most of the GFC period, investors were essentially forced to look pass growth disappointments and invest in riskier investments, as ultra-loose monetary policy punished the return on safe assets. In the U.S., as monetary conditions tighten, investors can be more discerning. Secondly, early in a tightening cycle, investors have historically underestimated the pace and extent of rate hikes every time and equity returns also faltered. Thus far, as we have written in the past, the FOMC’s projections have tended to converge towards market expectations, instead of the other way around. In its December 2016 meeting, the median FOMC forecast implied three .25% hikes, while the market is only forecasting two such hikes. (See CHART 7). While the leadership of the Fed (Chair Yellen and Vice Chair Fischer) is expected to stay in place until 2018; President elect Trump, who has been highly critical of the Fed’s extended period of monetary accommodation, will be able to fill two vacancies on the seven member committee. To the extent that President Trump’s perspective on the distortive effects of the Fed’s policies remains consistent with candidate Trump (which is yet to be determined); this could over time (but probably not within the next two years) shift the Fed’s policy making to a more traditional hard-money approach. That would hasten the pace of interest rate normalization.
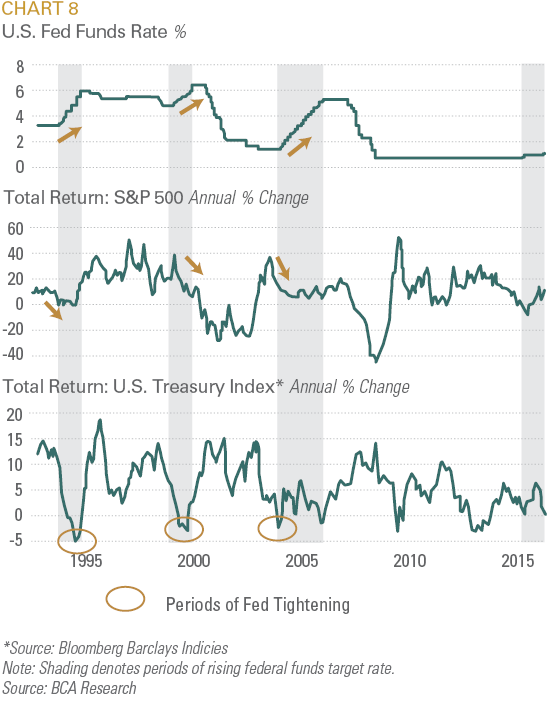
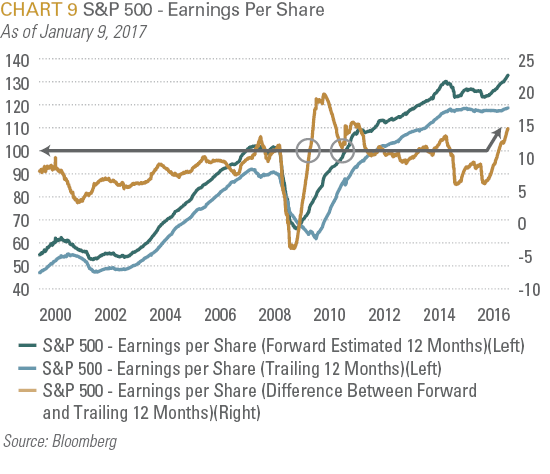
For historical context, there have been three other major Fed tightening cycles since 1985. In each case, the 10-year Treasury suffered an almost 10% or more annual loss, either following or just before short-term rates began their ascent. This was the case even when the Fed telegraphed a modest and steady 25 basis point-per-meeting pace of rate hikes from 2004-2006. (See CHART 8). While the fed funds rate is significantly lower today than in prior periods, so is EPS growth; and the gap between trailing earnings growth and 12-month forward expectations is wide. For example, as shown in CHART 9, the current gap between forward and trailing S&P 500 earnings per share was only exceeded in 2009 and 2011; both periods characterized by significant prior period market and economic dislocation or stress and which were boosted by quantitative easing policies by the Fed. With U.S. equities haven risen 14.7% in 2016 and 97% over the last five years; that is hardly the case today. Accordingly, equity valuations are significantly higher today. This suggests that there is a greater risk of earnings disappointment than was the case in prior early tightening periods. The longer the uptrend in stocks continues without interruption, the greater the risk of a pullback should growth disappoint.
Additionally, the rosy consensus for U.S. equities downplays two countervailing headwinds: rising wage costs and an appreciating U.S. dollar. As shown in CHART 10, most of the profit improvement in non-financial business profits occurred in the second half of the year as oil price rebalancing stabilized margins in the energy sector and as the dollar corrected from its 9% rise in 2015. With a 66% appreciation in 2016, the balancing of oil prices largely occurred in 2016. On the cost side, improving but subdued wage and interest costs were not material headwinds.
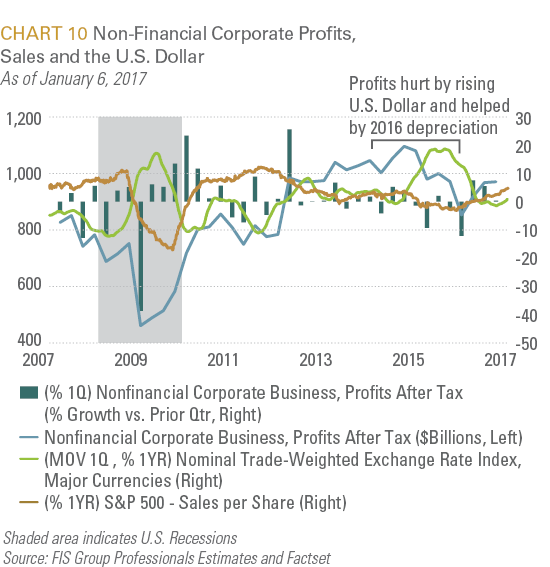
Going forward into 2017, wage growth is expected to pick up from the 2.9% year over year growth recorded in late 2016. The U.S. dollar’s appreciation, which negatively impacts large multinational S&P companies in 2015, has already resumed.
One segment of the U.S. equity market which seems vulnerable is small cap stocks. The narrative here is that small cap stocks are least vulnerable to protectionist policies or a rising U.S. dollar because of their relative domestic exposure. They are also expected to most benefit from corporate tax reduction because unlike multinationals, they have had fewer opportunities to reduce their corporate tax through jurisdictional arbitrage. For example, according to a recent Goldman Study, a cut in the corporate tax rate from 35% to 25% would be expected to raise S&P 500 companies’ profits by 8%. This narrative is also supported by a marked pick-up in companies surveyed by the NFIB Small Business Optimism survey which saw a marked spike after the November 8th election. As a result of this narrative, small cap stocks embarked on an almost hyperbolic gallop which as of the first week of 2017 has taken their Price Earnings ratio perilously close to the second standard deviation which has traditionally been a ceiling for further appreciation. (See CHART 11).
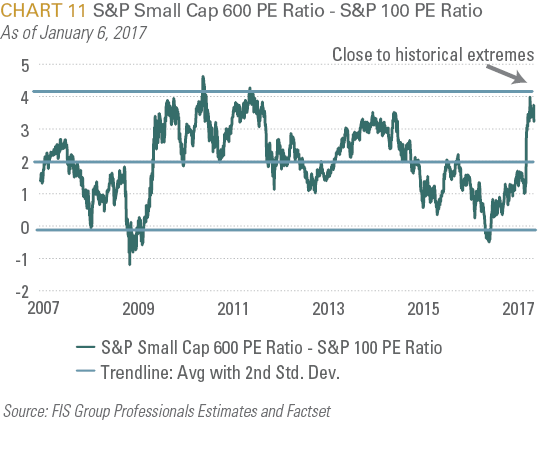
We recognize that valuations are not determinative of short term outcomes as markets can punch through and remain above historic deviation thresholds once a bullish narrative captivates investors; but they can help us evaluate the likely range of outcomes as well as the downside risks.
2. Little room for earnings or growth disappointment in EM
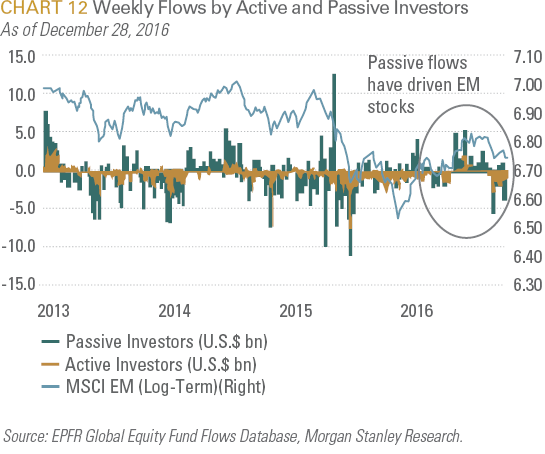
Following their 8.6% gallop in 2016, EM equities are also a consensus favorite; based on assumptions of further Chinese reflation in advance of the communist party congress in September, that they would disproportionately benefit from a pick-up in global growth and that their improved fiscal and trade balances would allow them to better withstand further Fed tightening than they did in 2013. While this narrative is not without merit, we are again concerned that EM prices have seemingly discounted so much good news that there is little room for disappointment.
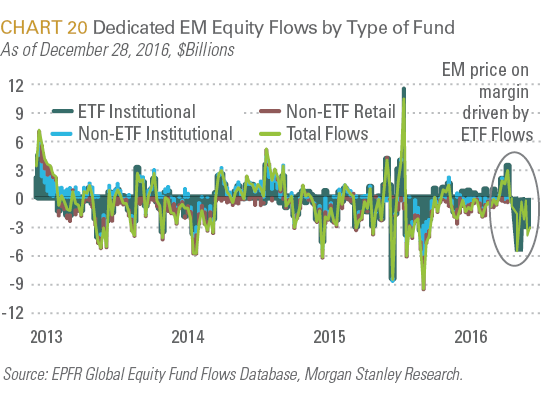
As discussed in our Q4 Outlook, most of the EM stock appreciation last year was driven by passive and particularly ETF investors; suggesting that the rally was primarily driven by portfolio rebalancing and early in 2016, short covering. As we suspected, these flows actually began to reverse in Q4, 2016. (See CHART 12).
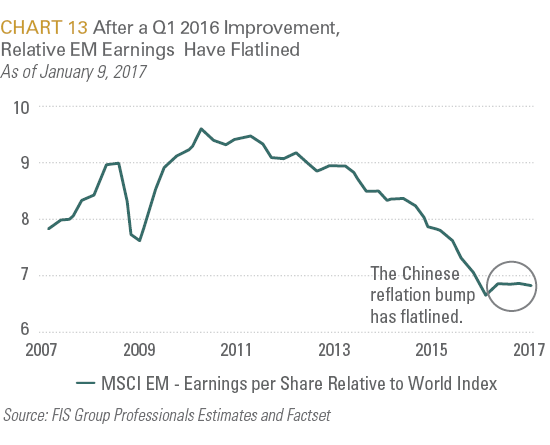
Perhaps more concerning is that after showing signs of improvement in early 2016 as a result of the delayed flow-through impact of Chinese reflation in 2015, EM EPS relative to developed market EPS has gone nowhere. (See CHART 13). Most of the improvement in earnings occurred after the sharp drop in the U.S. dollar which allowed export oriented EM companies to earn higher U.S. dollar prices on goods shipped overseas, despite increasing local input costs. This is why while Chinese PPI and labor costs increased markedly in RMB terms, they did not really translate into U.S. import prices (as is commonly misunderstood) because of the RMB’s depreciation against the U.S. dollar. In fact, while Chinese export prices rose in RMB terms, the RMB’s depreciation allowed Chinese export companies to reduce U.S. dollar prices while receiving more RMBs per unit.
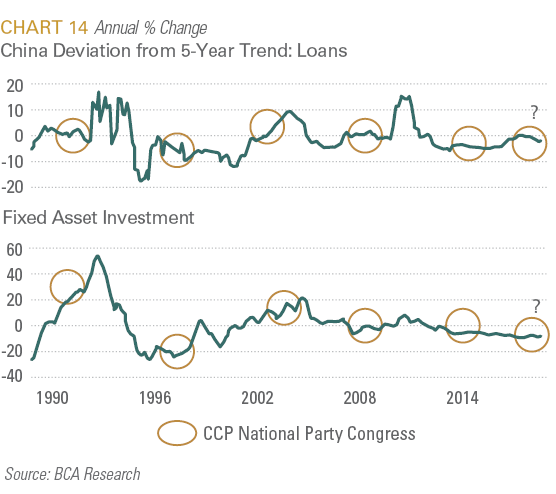
Part of the bullish EM narrative is based on an expectation of meaningful Chinese reflation policies in advance of the CCP’s National Party Congress in September, under the assumption that Beijing would want to minimize the probability of labor unrest. While an examination of prior five year periods with respect to credit expansion and fixed asset investment does not necessarily support this assumption, (See CHART 14), we would expect the government to use various policy measures to avoid a downturn.
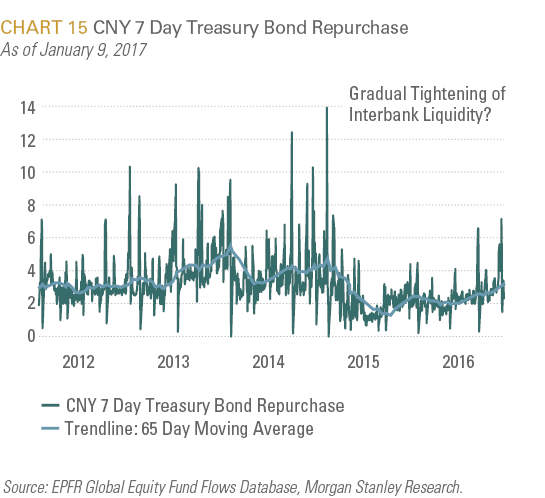
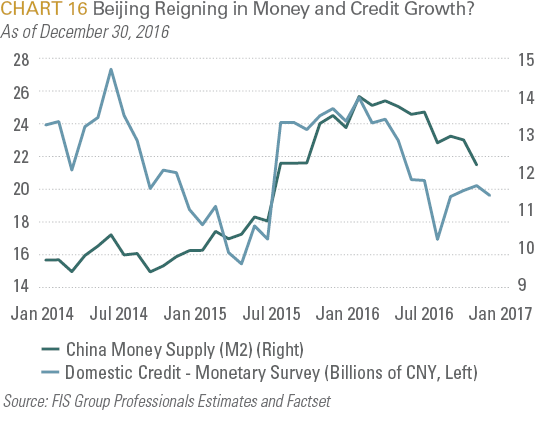
Moreover, it is worth noting that monetary policy has actually been quite restrictive recently. As U.S. and European growth is firming up, Chinese policymakers may be emboldened to moderate unsustainable credit growth and not repeat the massive fiscal push of early 2016. This policy move is consistent with PBoC Governor Zhou Xiaochuan’s statement this past October at the annual World Bank/IMF meetings in Washington, namely: “With the gradual recovery of the global economy, China will control its credit growth.” Thus Chinese corporate bond yields climbed alongside rising global bond yields, and the People’s Bank of China (PBoC) has also tightened liquidity in the interbank market for non-bank financial institutions. (See CHART 15 and CHART 16). At the margin, the Trump administration’s threats to label China as a currency manipulator increase Beijing’s sensitivity to avoiding a free fall in the RMB; which necessarily leads to further liquidity tightening particularly if the U.S. dollar is appreciating.
Beijing has also introduced measures to curb excessive bank credit growth and discourage “window dressing” accounting, the PBoC announced in late October that going forward it will include off-balance-sheet wealth management products (WMPs) in the calculation of banks’ quarterly Macro Prudential Assessment ratios, starting from the third quarter. The clampdown on WMP accounting will reduce banks’ capital adequacy ratios, curbing their ability to originate loans. Finally, property market tightening measures implemented of late are expected to lead to a slowdown in sales and renewed contraction in property starts. This will depress Chinese construction and demand for industrial commodities/materials as well as capital goods. This is intended to limit speculative activities among non-bank financial organizations (shadow banking). On a rate-of-change basis, this policy stance could result in a slowdown in the nation’s industrial cycle later in 2017.
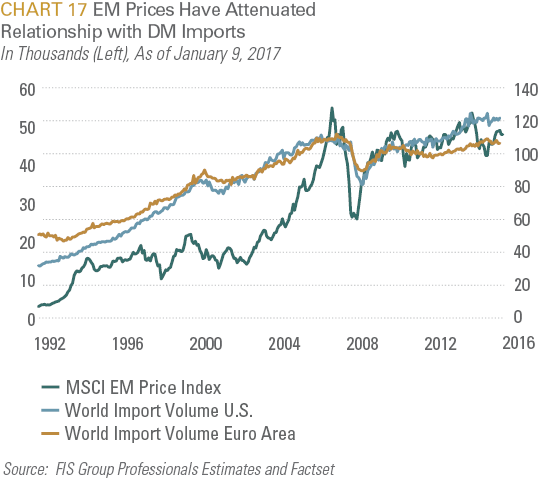
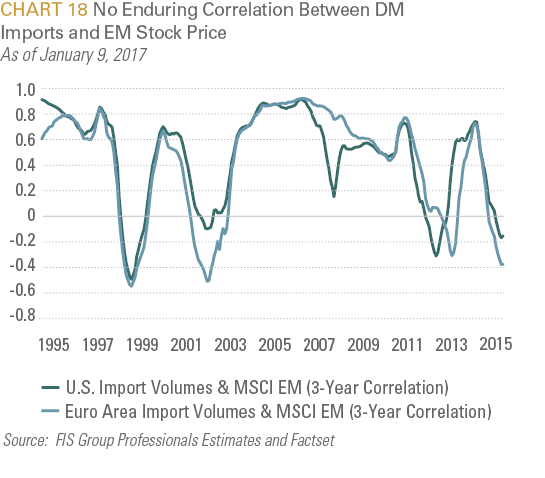
Another linchpin on which the bullish EM narrative rests is that an anticipated pickup in global growth, which will further lift commodity prices, is positively correlated with EM shares. First, we believe that strengthening/robust growth in the U.S. and other developed economies is a helpful but not necessarily a sufficient fillip for lifting EM growth. Specifically, U.S. import volumes have been weak the past 12 months and will likely recover in 2017, but this may not be enough to significantly boost EM asset prices. For example, CHART 17 and CHART 18 evaluate the relationship between EM prices and import volumes for both the U.S. and the Euro Area. The charts show a somewhat attenuated relationship, where the 3-year correlation varied from above a .6 correlation in the late 1980s to 1990s and in three-year period ending in 2011 to a negative relationship in the late 1990s and more recently. This correlation disintegrated in the 1997-98 period, when real GDP growth was 4.5% in the U.S. and 3.5% in Europe. During this period, U.S. import volume growth was booming at a double-digit pace yet it did not prevent widespread crises throughout the EM during this period. Second, the importance of U.S. and European economies to EM has declined tremendously since the late 1990s, while the importance of China and intra-EM trade has grown. Third, EM prices tend to have an inverse relationship with the U.S. dollar, which is likely to strengthen. Today, in an era of floating exchange rates and improved current account balances, most EM countries are less vulnerable than they were in the 1997-98 crisis or even in 2013, when the U.S. dollar spiked up as a result of the Fed taper discussion. However, at the end of the day, EM prices are driven by EM fundamentals and strengthening DM imports are a helpful but insufficient condition for EM outperformance.
3. Geopolitical “knowns” and underappreciated unknowns
Whilst the risks highlighted above would classify as “known”, with uncertain timing but reasonably quantifiable, (historically a 5% to 10% market or market segment decline), geopolitical risks can mostly be categorized as under-appreciated or over-stated known unknowns or unknown unknowns with less quantifiable and non-linear outcomes, with the clearest potential to fuel a left tail “black swan” type event.
TABLE 4 below delineates those risks, their likely impact, the market impact and suggested strategy should they play as well as their likeliness.
Risk
Nature of Risk
Likely Impact
Market Impact/Strategy
Likeliness(Unlikely, Somewhat Likely, Likely, Highly Likely)
Retreat from Globalization
Increased isolationism and mercantilism weakens 20th century institutions underpinning Pax Americana.
Two leading economies not overwhelmingly dependent on globalization: (exports only 12% of US GDP and 19% of Chinese GDP)
Historically, corporate profits and globalization have been positively correlated because as globalization intensifies, global trade links deepen and “borders fall,” boosting companies’ international revenue exposure. The opposite occurs under de-globalization. Typically, higher top-line growth from foreign markets has also been associated with increasing overall sales and profitability.
De-globalization is also inherently inflationary. However, structural demographic trends (older people consume less of most goods except for health care), will limit demand induced inflation.
-
Supportive of safe-haven assets and more closed economies. Trade dependent EMs, such as Korea, Taiwan and Vietnam will underperform.
-
Black Swan risk. Isolationism raises the probability of devolution into nationalism/ jingoism; which in turn enhances the probability of regional or global conflict. Despite the fact that they are not cheap relative to their historical trading ranges, defense and cyber-security companies will be entering a structural bull market.
-
Inflationary, therefore supportive of real assets and precious metals. Health care inflation will necessarily continue to be a source of technological disruption.
-
Highly Likely
-
Somewhat likely
-
Likely
Populist revolt in Europe
While refugee migration and terrorism are real sources of social angst; relative to both the U.K and the U.S., Europe’s social welfare state bureaucracy has blunted globalization’s negative redistributive impact on its middle class. This is why populism is a somewhat over-stated threat, particularly in Northern Europe.
Barring a high-profile terrorist attack, populist parties (perhaps outside of Italy) are unlikely to prevail. Rightward shift in policy likely.
Increased Eurostoxx volatility in light of the various elections slated for 2017. However, European assets should surprise to the upside both because of the overestimation of the risk of populist parties prevailing but also because of relatively attractive fundamentals (valuation and higher operating leverage to global growth).
Likely in Italy. Somewhat likely to prevail in France or Germany where support for the Euro remains very strong. (Outlier risk however is a high-profile terrorist attack)
Great power conflict -Eurasia
Russia continues to restore dominance/control over former Soviet empire.
Ukraine-like incidents in neighboring Belarus and Kazakhstan would not suprise.
Trump administration and likely winner of French election – Center Right Francois Fillion likely to support détente with Russia. Chancellor Merkel will not independently push for sanctions because of weakened parliamentary position as well as strong German economic ties to Russia.
Lower geopolitical risk premium on Russian assets. Bullish for Russian assets.
Likely, particularly if US signals acceptance with Russia asserting its sphere of influence in former Soviet empire vassal states.
Great power conflict – Asia
- Sino-American symbiosis (America purchases/borrows & China exports/lends) becoming frayed. China will not be able continue to capture global market share while exporting deflation; particularly now that its higher value exports are encroaching on developed market economies.
- China’s attempt to assert regional dominance is being challenged by the Trump administration’s questioning of the “One China” doctrine which requires that neither China nor the US seek regional hegemony. America’s retreat from TPP will further facilitate China’s regional economic dominance
- China will defend domestic market (45% middle class and second largest market) from competition through non-tariff barriers.
- Emergence of U.S. – China proxy conflicts relative to China’s periphery (North Korea, South Korea, Hong Kong, Taiwan and Vietnam)
See “Retreat from Globalization” above
Likely
Middle East conflicts
- ISIS territorial defeats in Syria and Iraq leads to disbursement of the group into local terror networks in Turkey and Europe.
- Turkish escalation in Syria provokes Turkish-Russian conflict.
- A post-ISIS vacuum emboldens Iraqi Kurds towards independence.
- Escalation of proxy wars between Saudi Arabia and Iran.
- Expanded ISIS attacks in Europe would stoke nationalistic, anti-immigrant and populist support. In Turkey they would embolden Erdogan’s authoritarianism.
- Turkish-Russian conflict, if allowed to escalate, could lead to interdiction of Russian shipping through the Bosporus.
- Turkey is drawn into a direct conflict with Iraqi Kurds on Iraqi soil.
- Saudi Arabia has already effectively surrendered in Syria and is looking for an exit in Yemen, but would defend any further Iranian meddling in their vassal state of Bahrain or elsewhere in the GCC, should Iran feel emboldened by their success in Syria.
- See above for results of European populism. Turkish risk assets remain depressed, possibly even selloff further.
- This is a threat to our otherwise positive outlook for Russian risk assets and could add to risk premiums across the region as well.
3 & 4.(Iraqi Kurds are too financially strapped to pick a fight they cannot possibly win). Temporary geopolitical premium attached to oil prices. But this will ultimately bring more shale production on-stream (neutral or long oil).
- Highly likely
- Somewhat likely
- Unlikely
- Somewhat Likely
And Finally; Are We Beginning to See the Makings of a Cyclical Active Management Comeback?
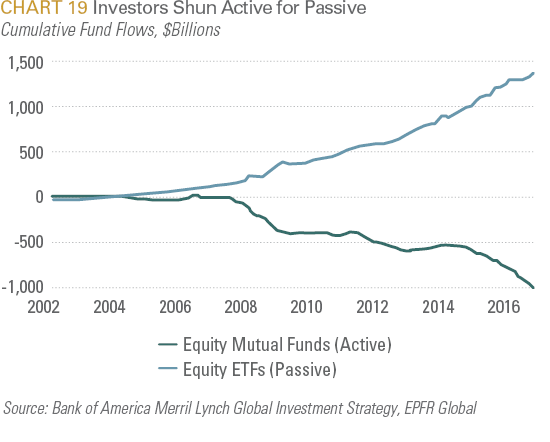
Active management of publicly traded equities has been in a bear market. According to Bank of America Merrill Lynch’s September 29, 2016 Flow report, since 2002 there have been $1.4 trillion of inflows into passive ETFs verses $1 trillion of redemptions from active mutual funds. As shown in CHART 19 during recent years the rotation out of active funds into passive managed investments has accelerated. Year-to-date $260 billion has flowed out of US long-only equity mutual funds, 3.9% of industry assets under management. In comparison, US equity ETF’s have attracted $74 billion year-to-date, 3.3% of industry assets under management. (See CHART 19).
Some observers have noted that with interest rate normalization and the return of stock volatility, we are beginning to enter into a period in which active security selection may begin to outperform passive strategies. In 2013, FIS conducted a study to evaluate the cyclical and structural dimensions of active management performance. We noted in that study that there were clearly structural elements in more efficient asset categories that would continue to challenge active managers. Those elements included increased market efficiencies, information technology’s ability to increase information efficiencies such that the speed and scope with which information is disseminated undermines information advantages, and the growth of basket or index trading, which drives up stock correlations. The rally in the EM market last year is a poignant and recent example of this latter phenomenon where the vast majority of net purchases were through passive ETFs. (See CHART 20).
But there are also cyclical elements that impact the relative performance of active managers. In that study, we conducted a regression analysis where the performance of the market benchmark within a universe of active managers was assigned as the dependent variable and various market conditions (e.g.: money growth; security dispersion; stock correlations) were evaluated as independent variables. Through this analysis, we created a statistically significant model for explaining the cyclical element of active managers’ benchmark relative performance. To recap, CHART 21 depicts those variables that were most statistically relevant, as well as their beta coefficients.
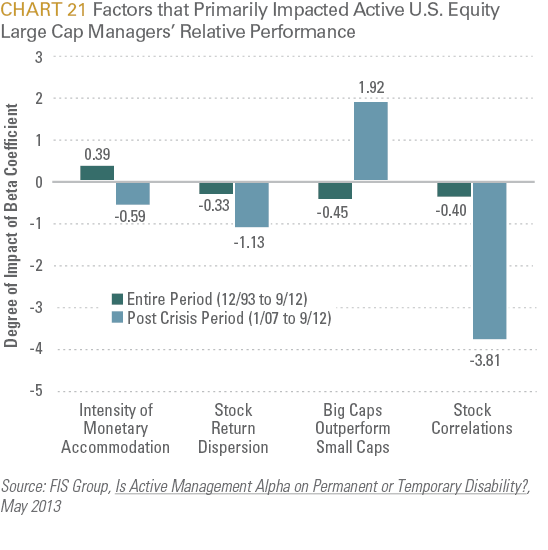
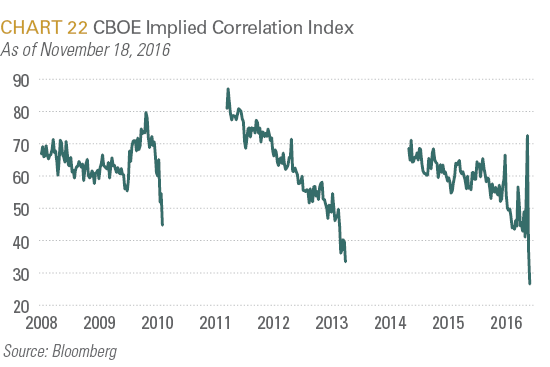
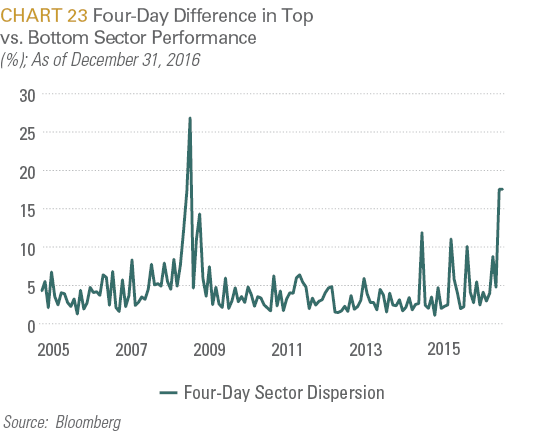
As shown above, the most significant negative factor were stock correlations and stock return dispersion. The third most significant variable was intensity of monetary accommodation, which tended to encourage yield/risk seeking, irrespective of fundamentals. While we have not yet re-evaluated this model at the same level of detail, we do note that stock correlations appear to be falling and market dispersion appears to be rebounding. (See CHART 22 and CHART 23). With the Fed once again telegraphing its intention to hike interest rates two to three times this year, this third variable appears to be gradually normalizing. Bottom line, we cannot say with certainty that this is the year that active management will regain its luster but it does appear that the conditions for it doing so are gradually returning.
- Policy divergence from the U.S. as both the ECB and Japan continue to employ accommodative monetary measures that will generally support the U.S. dollar.
Important Disclosures:
This report is neither an offer to sell nor a solicitation to invest in any product offered by FIS Group, Inc. and should not be considered as investment advice. This report was prepared for clients and prospective clients of FIS Group and is intended to be used solely by such clients and prospects for educational and illustrative purposes. The information contained herein is proprietary to FIS Group and may not be duplicated or used for any purpose other than the educational purpose for which it has been provided. Any unauthorized use, duplication or disclosure of this report is strictly prohibited.
This report is based on information believed to be correct, but is subject to revision. Although the information provided herein has been obtained from sources which FIS Group believes to be reliable, FIS Group does not guarantee its accuracy, and such information may be incomplete or condensed. Additional information is available from FIS Group upon request.
All performance and other projections are historical and do not guarantee future performance. No assurance can be given that any particular investment objective or strategy will be achieved at a given time and actual investment results may vary over any given time.