
Executive Summary
Boutique investment managers have durable structural advantages that can lead to enhanced alpha generation. Clear accountability, sharper incentive alignment, and the agility to operate in capacity-constrained segments allow boutiques to run more concentrated, high-conviction portfolios and to access parts of the market that large platforms often cannot. What varies is how fully those advantages translate into excess return, which depends on market structure and macro context such as breadth, dispersion, concentration, and stock level correlations. Building on our 2011 study Survival of the Nimble1 as well as various earlier studies on active management alpha, this paper reassesses the boutique versus established firm question in today’s environment and tests where those enduring strengths show up most clearly.
At the center of this story is the link between broad opportunity sets, access to the illiquidity premium, and how each equity universe delivers returns through time. Smaller, capacity-aware boutiques can reach more of the investable universe, especially small-cap and less liquid names, which allows them to convert market breadth and dispersion into excess return when stock-level outcomes are diverse. Our three-regime framework across U.S., non-U.S., global, and small-cap universes shows that the edge expands when gains are broadly distributed, dispersion is high, correlations are low, and periods of financial stress or volatility reward decisive repositioning. It compresses when leadership narrows to a handful of index heavyweights, correlations rise, or breadth favors cap-weighted over equal-weight exposure. These patterns are intuitive across drivers. Through the full period boutiques outperformed in all six universes, with the largest differentials in capacity-constrained segments where smaller AUM allows access to a broader opportunity set. In the last five years of mega-cap dominance the edge of boutique managers proved more resilient in small-cap and emerging markets than in U.S. large and global categories.
Why invest in Boutiques?
For almost thirty years, our firm has researched and invested with smaller, early stage “emerging” asset managers. Throughout this experience, we have observed that the entrepreneurial boutique model offers structural advantages that can translate into superior performance. Many of the characteristics of boutique managers have shown to enhance performance in empirical studies (By Xponance and others2). Research finds that funds with the highest active share (a hallmark of high-conviction portfolios) significantly outperform their benchmarks over the long term.
Boutique investment firms are built for clarity and speed. Ownership and decision-rights are concentrated around the principals who are directly accountable for results, which tightens incentive alignment and reduces organizational drag. That structure lets portfolio managers devote more time to research and to acting on high-conviction ideas, rather than navigating layered committees or benchmark-aware compromises common at larger platforms. In practice, that means boutiques can move earlier and with greater conviction when opportunity appears. The result is faster feedback from research to portfolio and a cleaner alignment between client outcomes and partner incentives.
In contrast, large asset management firms often divide responsibility among multiple co-managers and committees, which can lead to more cautious, benchmark-aware behavior and a diffusion of accountability. Research supports these structural advantages. A 2025 study by Professor Andrew Clare of Bayes Business School, conducted with the Independent Investment Management Initiative (IIMI)3, found that boutique asset managers consistently outperform larger peers and attribute the edge to independence, alignment of interests, and nimbleness in decision-making. Similarly, academic work4 on managerial ownership has shown that funds where managers invest their own wealth tend to deliver superior risk-adjusted performance, as this ownership structure better aligns incentives and curbs agency-driven behavior. Together, the evidence suggests that decision-making clarity and personal investment, hallmarks of the boutique model, should translate into measurable performance benefits.
We have many examples of star portfolio managers at large institutions feeling so constrained that they take the risk of launching their own firm. Often, as their teams and administrative responsibilities grew, they found less time and flexibility to focus purely on portfolio management. This journey is one of the most common “origin stories” of the boutique firms that we work with as you can see from the sidebar quotes.
A second advantage is access. Smaller, capacity-aware firms can operate across more of the investable universe, especially in less liquid and smaller-cap names, where large products struggle to take meaningful positions without creating ownership or liquidity frictions. That broader opportunity set is not a promise of excess return on its own; it is the raw material from which skill can be expressed when market conditions are favorable. We quantify this dynamic throughout the paper using our three-regime framework.
Crucially, this leads to an embracing of active risk by smaller managers. Our prior is explicit: high active share is a necessary, not sufficient condition for outsized excess returns. It amplifies skill (or the lack of it), so payoffs depend on the skill of the manager.
In the Alpha Availability studies5, the environments most conducive to active alpha, and likely where boutiques’ structural advantages are most convertible, share recognizable traits: concentrated weakness in benchmarks, lower pairwise correlations, and low-to-moderate liquidity regimes. On the other hand, narrow leadership (concentrated gains in a handful of index heavyweights), high correlations, or liquidity waves that “lift all boats” tend to compress the opportunity for stock-specific edge.
Boutiques possess durable structural advantages: alignment, focus, and capacity to fish where bigger boats cannot, but the conversion of those advantages into excess return is somewhat dependent on the macro environment. The sections that follow tie these claims to data: we show where breadth, dispersion, correlation, concentration, and liquidity regimes historically magnified or muted boutique outperformance across U.S., non-U.S., global, and small-cap universes.
No Free Lunch
Allocating to boutique managers can add distinct alpha, but capturing that edge requires deliberate and ongoing oversight, not a one-off screen. The work is less transactional and more programmatic: a standing investment in diligence, monitoring, and partnership.
Boutiques carry business and operating risks that larger managers have largely outgrown: financial and business durability, key person risk, limited redundancy, thinner in-house compliance, vendor concentration, and uneven cyber and IT maturity. Diligence should confirm baseline institutional standards and evidence of a resourcing plan to improve these functions as the firm grows. The most labor-intensive reviews often focus on business risk: plans, budgets, ownership, governance, and compensation so that incentives, runway, and succession are credible.
External reviews, including operational, legal, cyber, or other specialist work, can be material (cost ranging from 25,000 and 75,000 U.S. dollars6). For institutions managing multi-manager portfolios, maintaining an updated view of each boutique manager’s operations can significantly increase oversight budgets. This pressure intensifies when boutique firms use ad hoc / distinct systems, data processes, or governance structures that require tailored evaluations. In short, the very characteristics that make boutiques agile and distinctive also make them more expensive and time-consuming to evaluate and monitor. The opportunity cost is measured not only in dollars but in analyst bandwidth diverted from research and portfolio construction (which is why we utilize an operational due diligence team, without research duties).
Thorough due diligence must therefore extend beyond investment process evaluation to encompass a firm’s business and operational stability, technology posture, vendor resilience, governance depth, and succession planning. Yet allocators who proactively budget for these commitments can realize outsized returns through relationship-driven access to high-conviction capacity. In the words of the 2025 Callan Cost of Doing Business study, “strategic diligence investment now represents the price of access to differentiated alpha”7.
Analysis Overview
This paper extends our 2011 work and subsequent updates by asking two practical questions. First, do boutiques still outperform across market cycles? Second, under what conditions is that edge most likely to show up. We answer with a transparent three regime framework that segments each driver into low, moderate, and high ranges and then measures the average excess return of boutiques versus established peers in each range. We run this the same way in every equity universe we cover. The approach is deterministic and replicable, so the resulting thresholds are decision ready rather than model dependent.
We test a consistent set of market structure variables that plausibly governs when active risk is rewarded. These include the concentration of gains and losses in the benchmark, cross stock correlation, measures of breadth using cap weight versus equal weight, the size premium, style skew between value and growth, volatility, financial stress, and policy uncertainty. By mapping outcomes across low, moderate, and high regimes for each variable, we convert a large body of returns data into a plain language guide for allocators. The sections that follow first recap the structural advantages of boutiques and the liquidity context for their portfolios, then present the regime results by universe with a focus on when to expect payoffs to compress or expand.
Characteristics of Boutique Portfolios
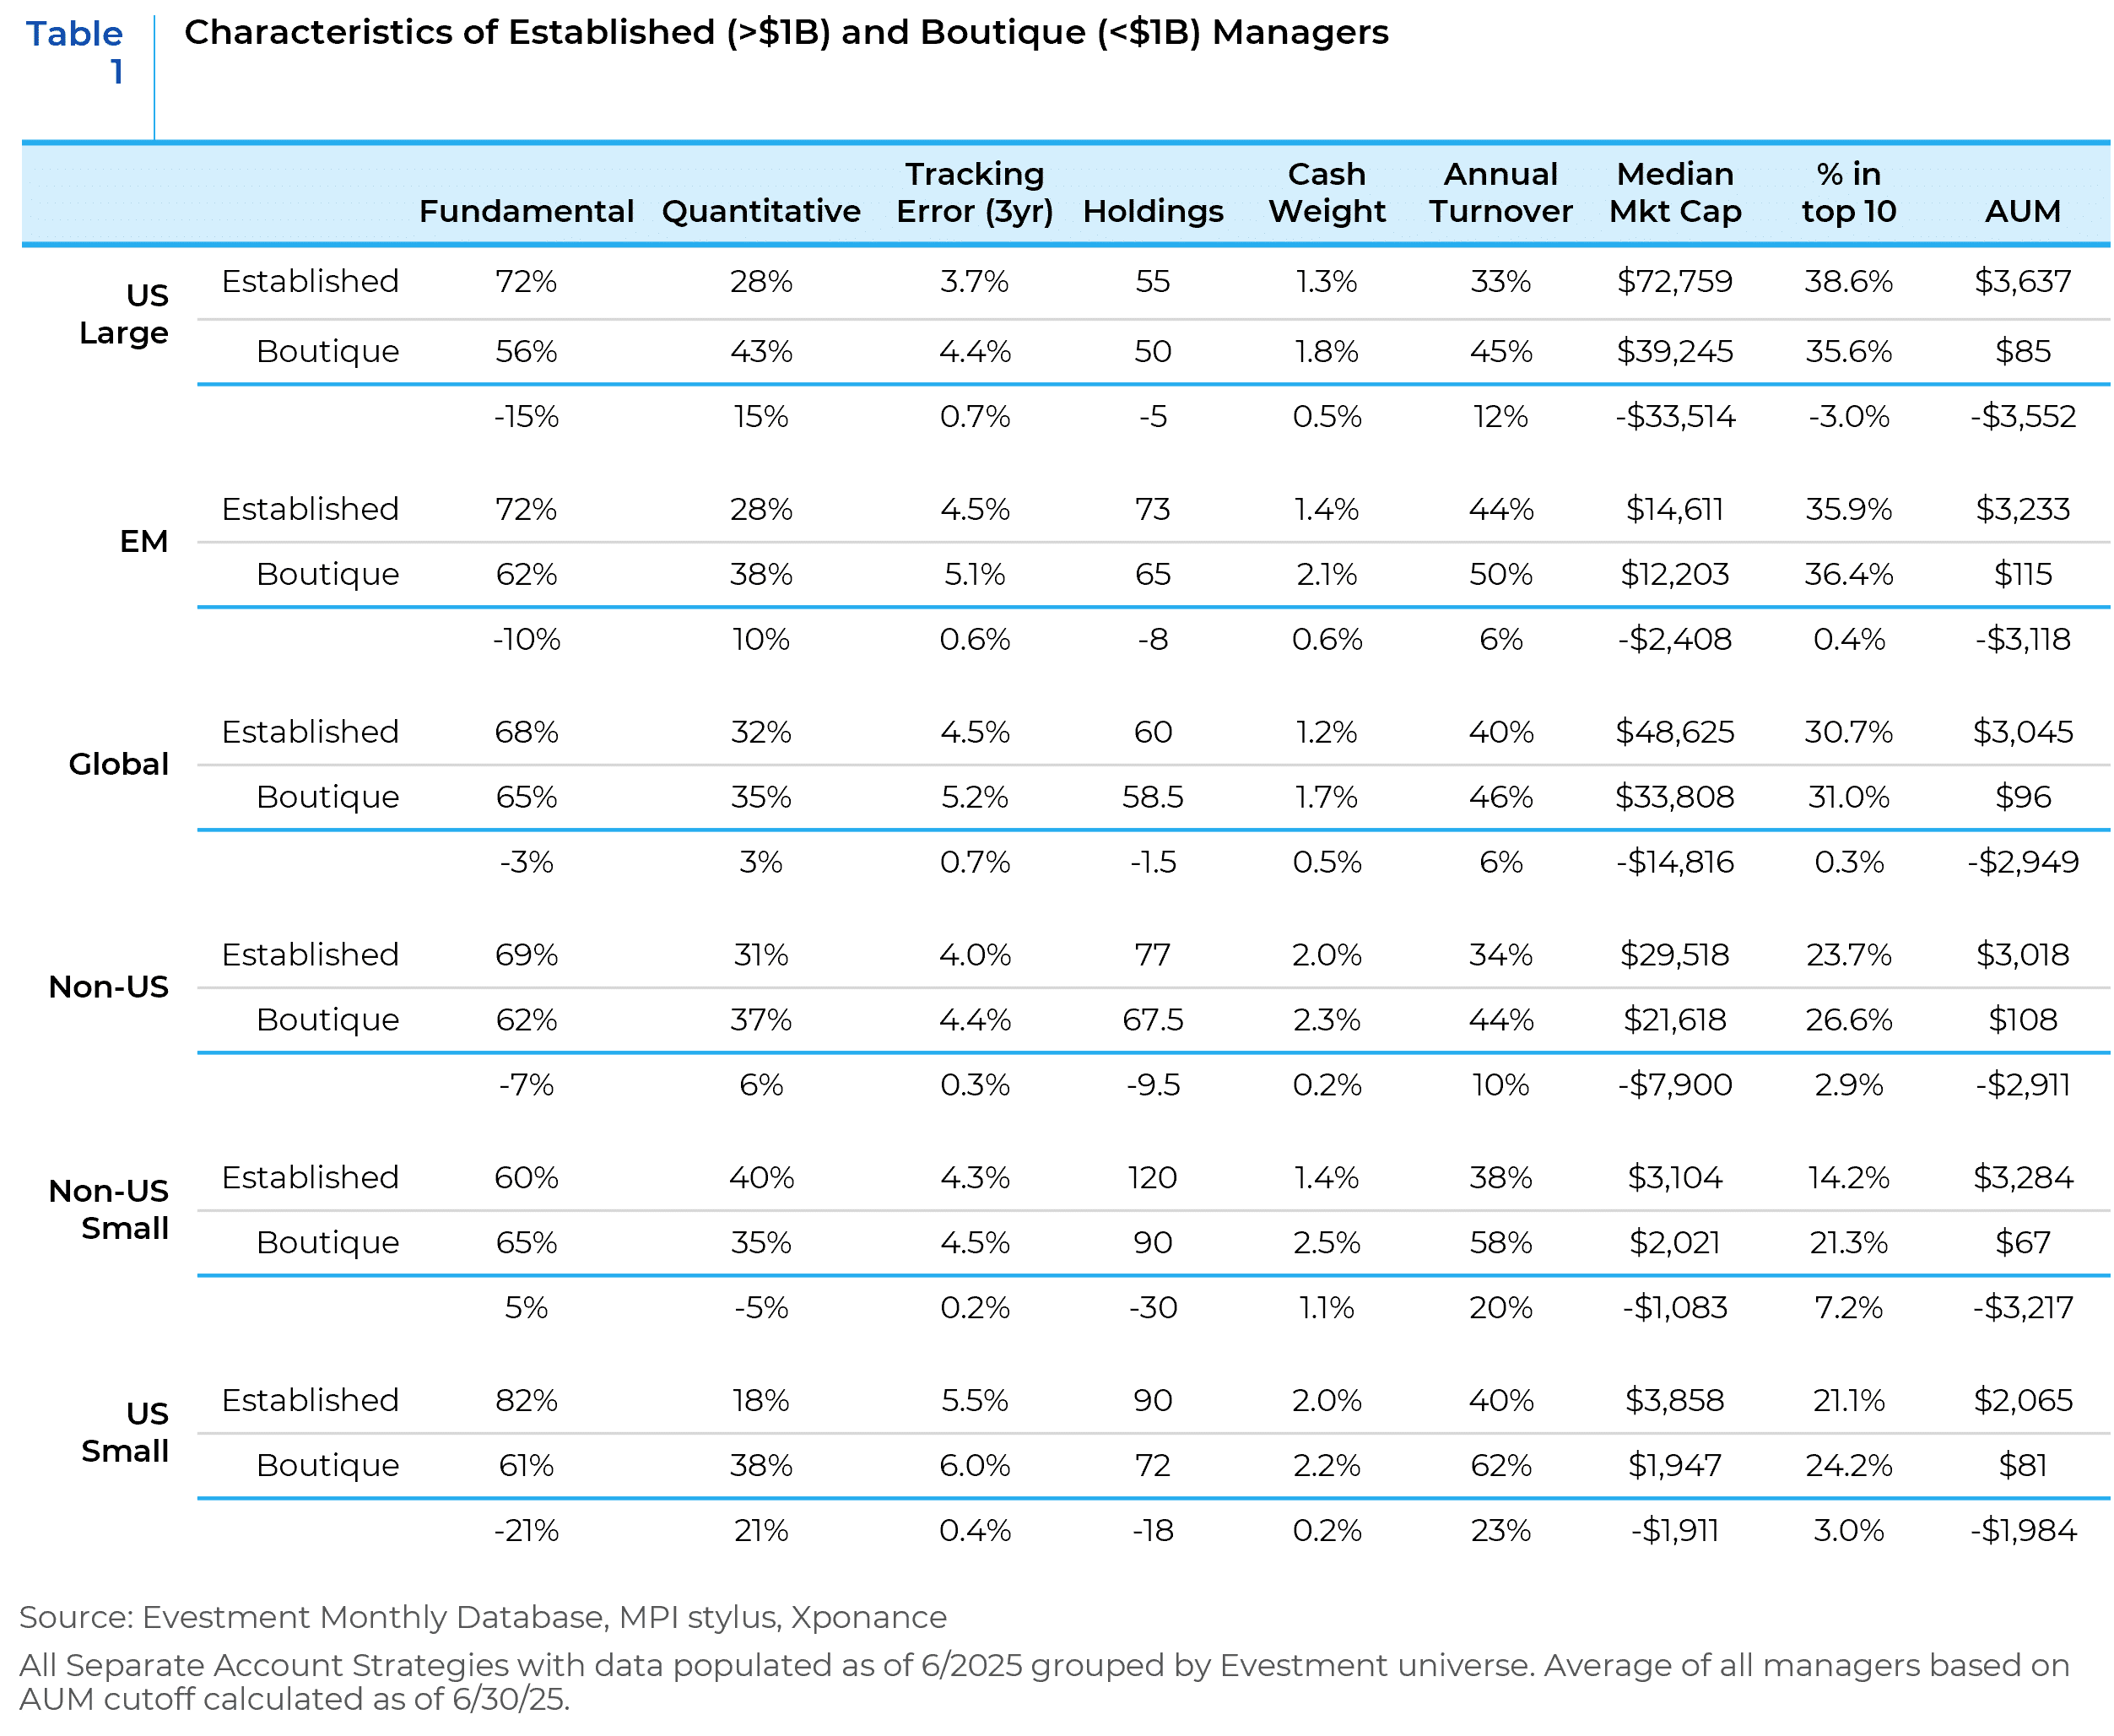
For this table and the remaining analysis in this report, we will consider all products with less than $1B as “boutique” and all products with greater than $1B as “established”. A key structural difference is portfolio concentration. Boutique managers tend to run more concentrated, high-conviction portfolios. They hold fewer stocks on average and are willing to overweight their best ideas to a greater extent than large firms. Table 1 shows that entrepreneurial managers hold meaningfully fewer stocks than their established peers in every category. Greater concentration naturally leads to higher active risk (tracking error), but importantly, boutiques have been able to convert that risk into higher returns. In all six of the major equity categories studied, boutique managers delivered more excess returns than established managers. This implies that their additional active risk was rewarded, a testament to skill and the advantages of flexibility.
Sizing the Opportunity Set
Perhaps the most distinct structural edge of nimble boutiques is their ability to invest in less liquid market segments. Large asset managers, due to their scale, are often forced to focus only on mega-cap stocks or the most liquid portions of the market. In contrast, a smaller boutique portfolio (with, say, a few hundred million dollars) can take meaningful positions in smaller-cap stocks or niche opportunities that would be impossible for a $50 billion product. This liquidity advantage offers the broadest opportunity set and allows boutiques to harvest the “illiquidity premium”, the excess returns potentially available in small-cap, micro-cap, or otherwise capacity-constrained areas of the market. Even without these smaller stocks outperforming, a boutique can generate a performance edge simply by being able to fish in ponds that big managers cannot wade into.
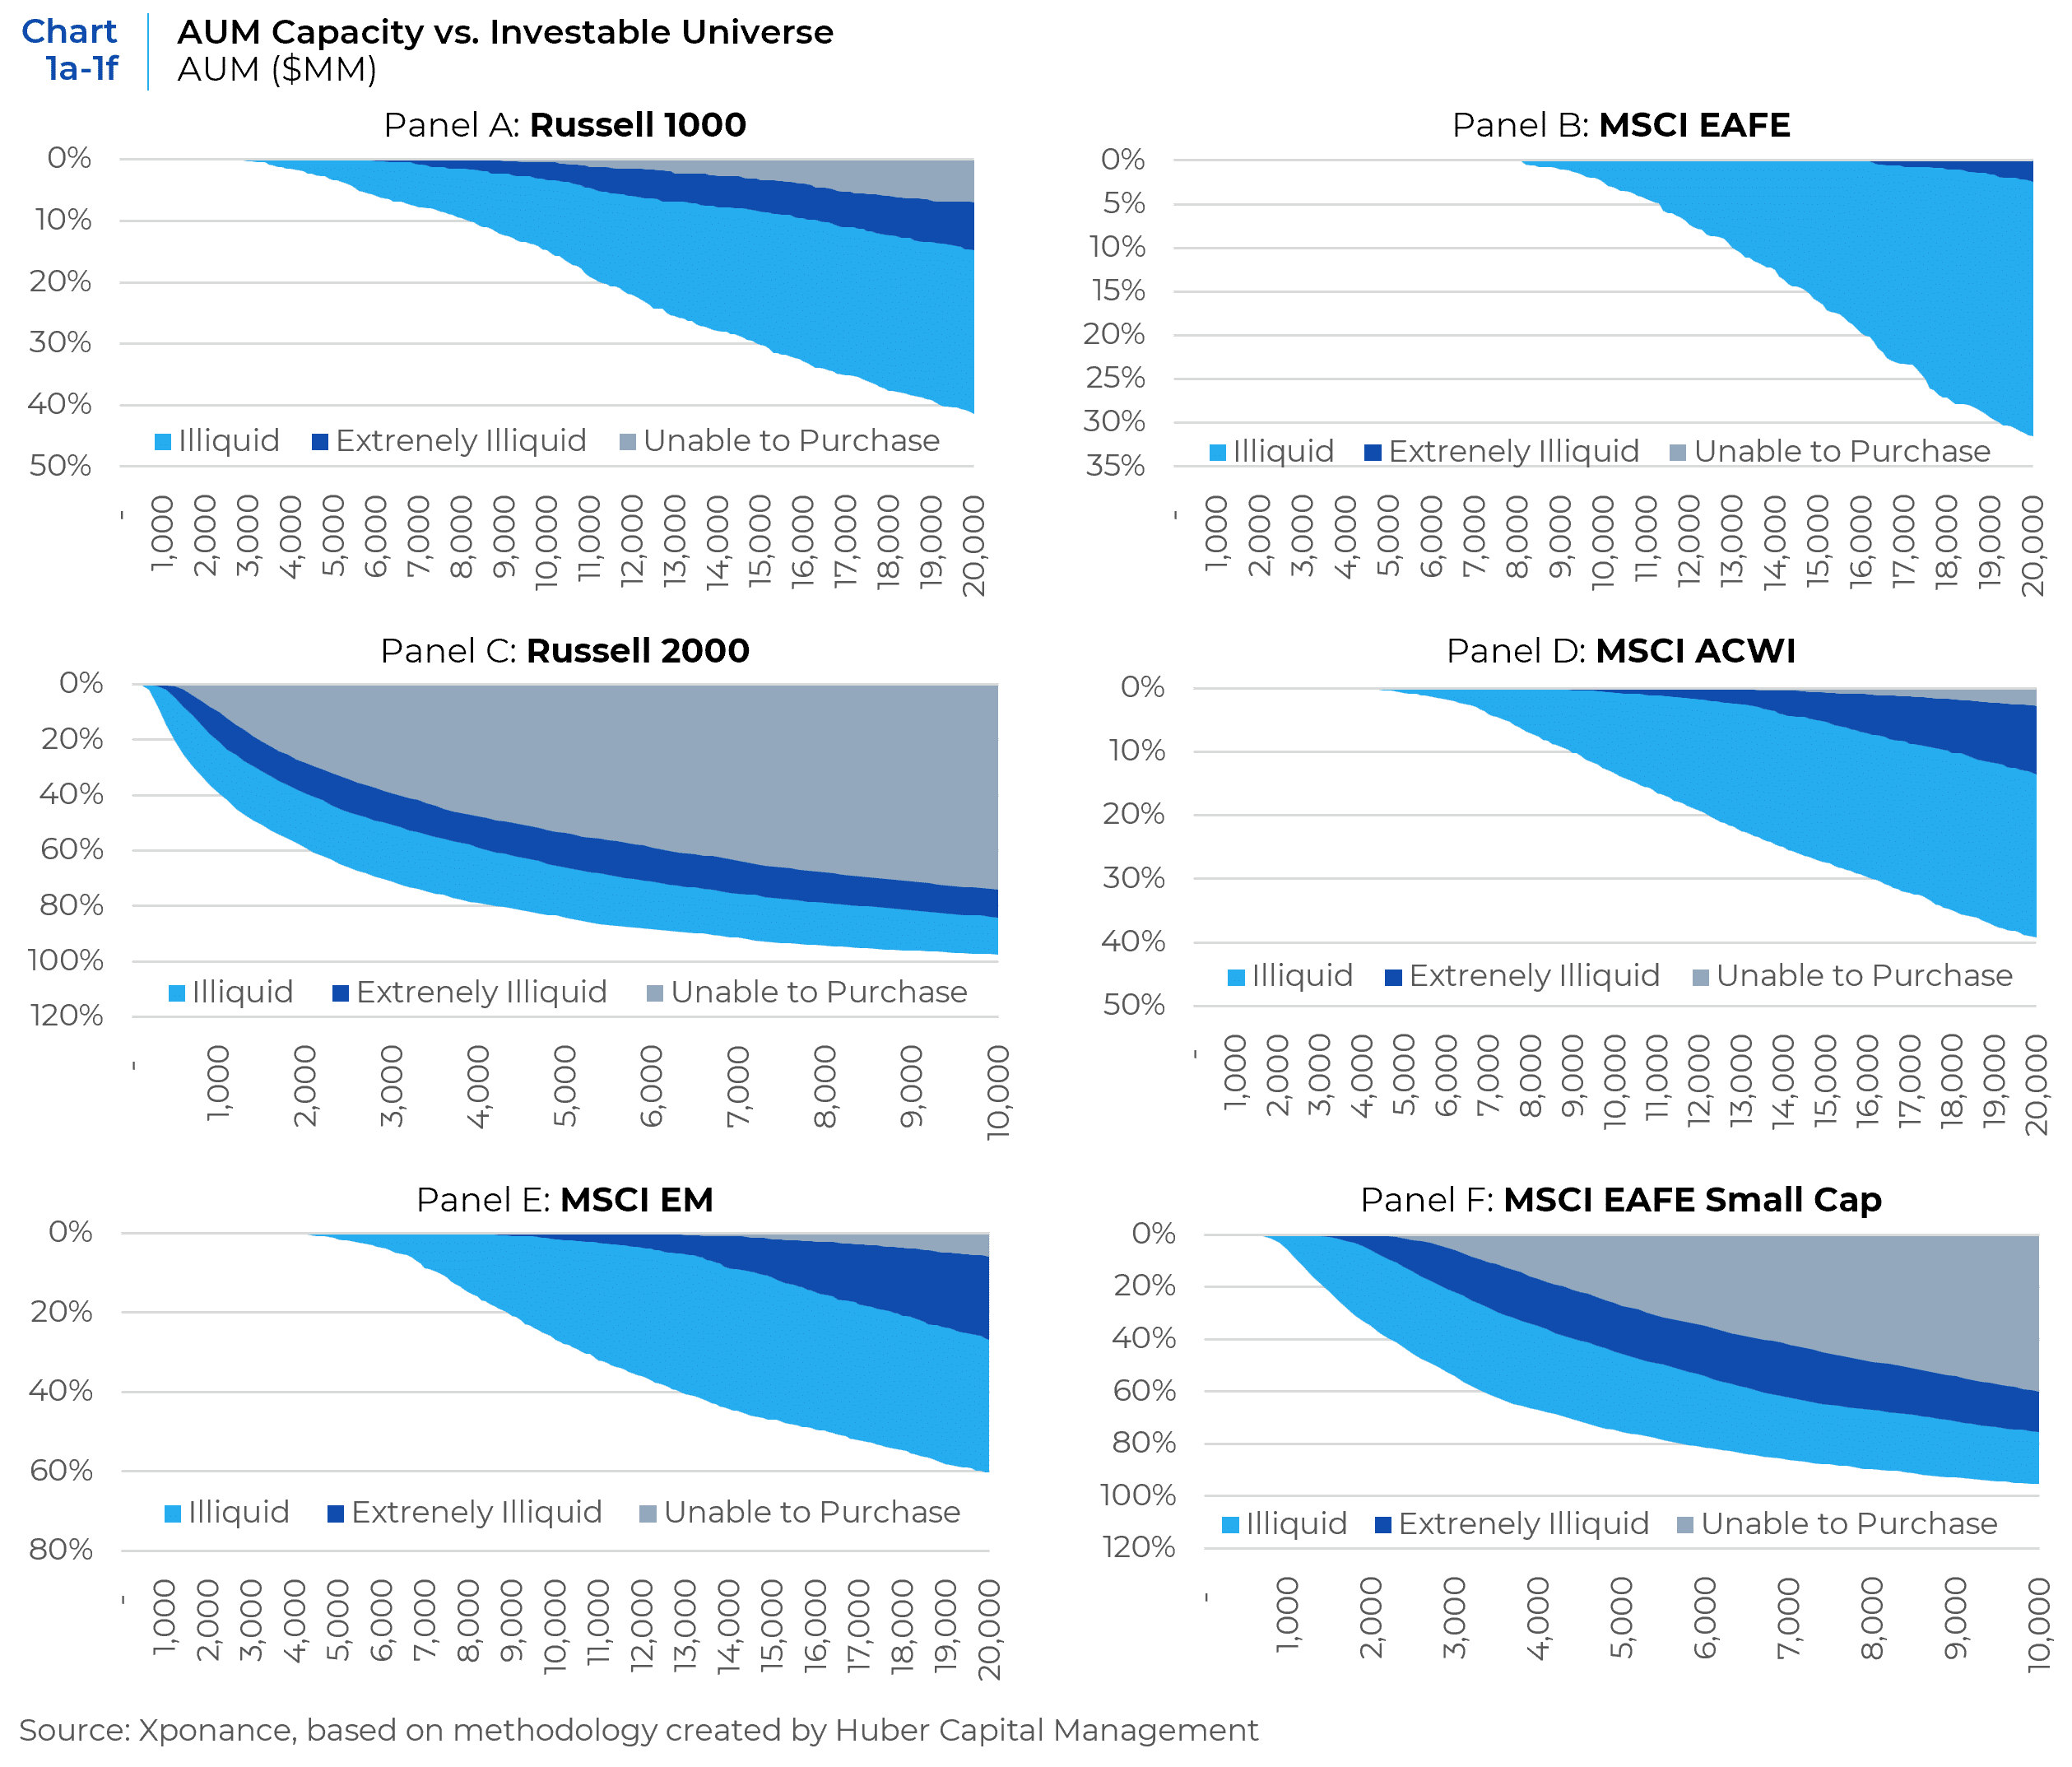
Charts 1a-1f illustrate the trade-off between a strategy’s assets under management (AUM) and the percentage of the equity universe it can feasibly invest in, assuming a 5% ownership limit in any company’s shares. Gray-shaded areas indicate portions of the benchmark that are effectively off-limits (“Unable to Purchase”) as fund size grows.
In U.S. Large Cap (Russell 1000) and International Developed (MSCI EAFE) markets, liquidity is abundant, a manager’s investable universe is not severely restricted until product size grows extremely large (>$10B). By contrast, in more capacity-constrained segments like U.S. Small Cap (Russell 2000) and Emerging Markets (MSCI EM), a fund as small as $5 billion would struggle to take a 5% position in a huge portion of the index. In the Russell 2000, for instance, over 80% of index constituents would be impractical to own at that fund size. The MSCI EM index and MSCI EAFE Small Cap Index show a similar dynamic to U.S. small caps, a boutique EM manager can maneuver into smaller local companies that a multi-billion-dollar EM fund cannot. These liquidity realities mean that boutiques maintain a significantly broader opportunity set in small-cap and EM universes, whereas large firms are forced to concentrate in the top tier of stocks.
A boutique manager who can freely trade in and out of all segments of the market (including smaller names) can potentially capture higher returns, with a distinct tailwind when those segments outperform.
Historical Performance Evidence
Consistent with the above structural advantages, boutique managers have delivered superior results relative to established managers over long periods. Tables 2a and 2b summarize the average annualized returns of boutique vs. established managers in major equity segments, based on our analysis of the past two decades of data as well as the past 5 years.
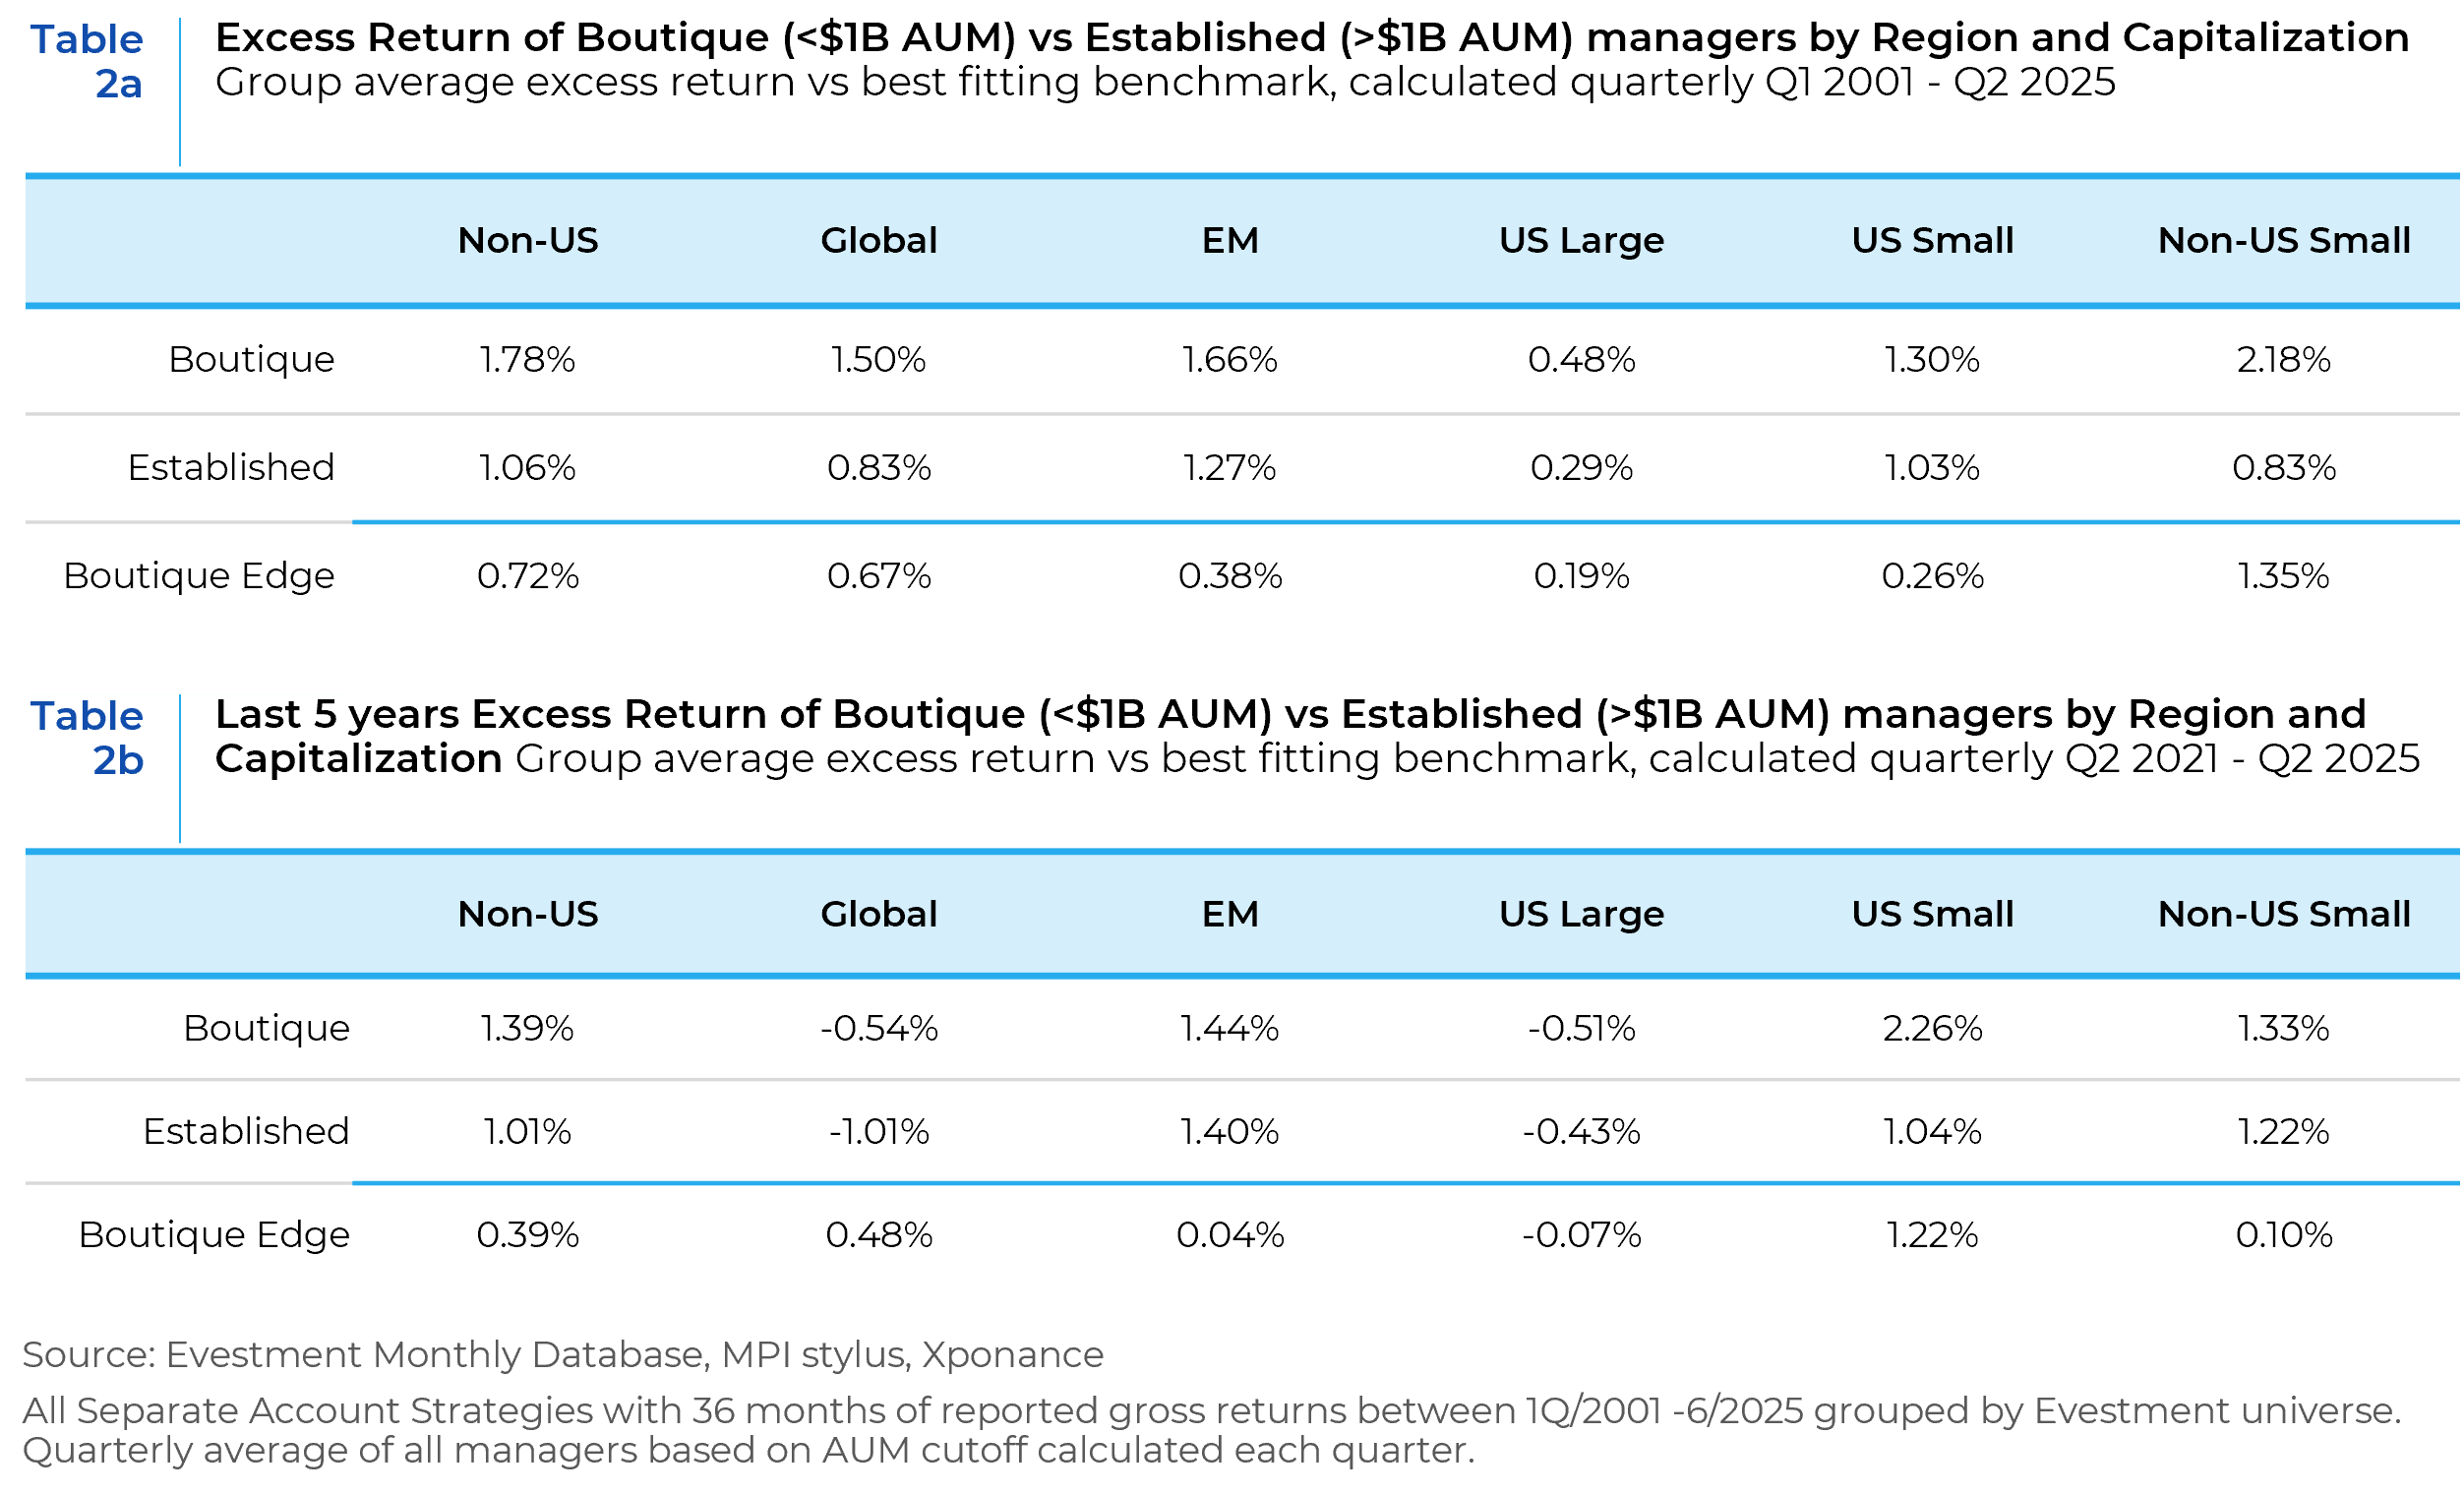
The performance takeaway is clear. Boutiques that can range across the full market—from index leaders to thinner, less liquid names—are better positioned to harvest excess return when skill is comparable. The last five years were an exception: U.S. mega caps dominated, aided by central bank policy after the global financial crisis and the AI boom, which obscured the costs of scale in U.S. Large Cap and Global mandates. If leadership widens beyond a few index heavyweights, breadth and agility again become decisive advantages for smaller managers.
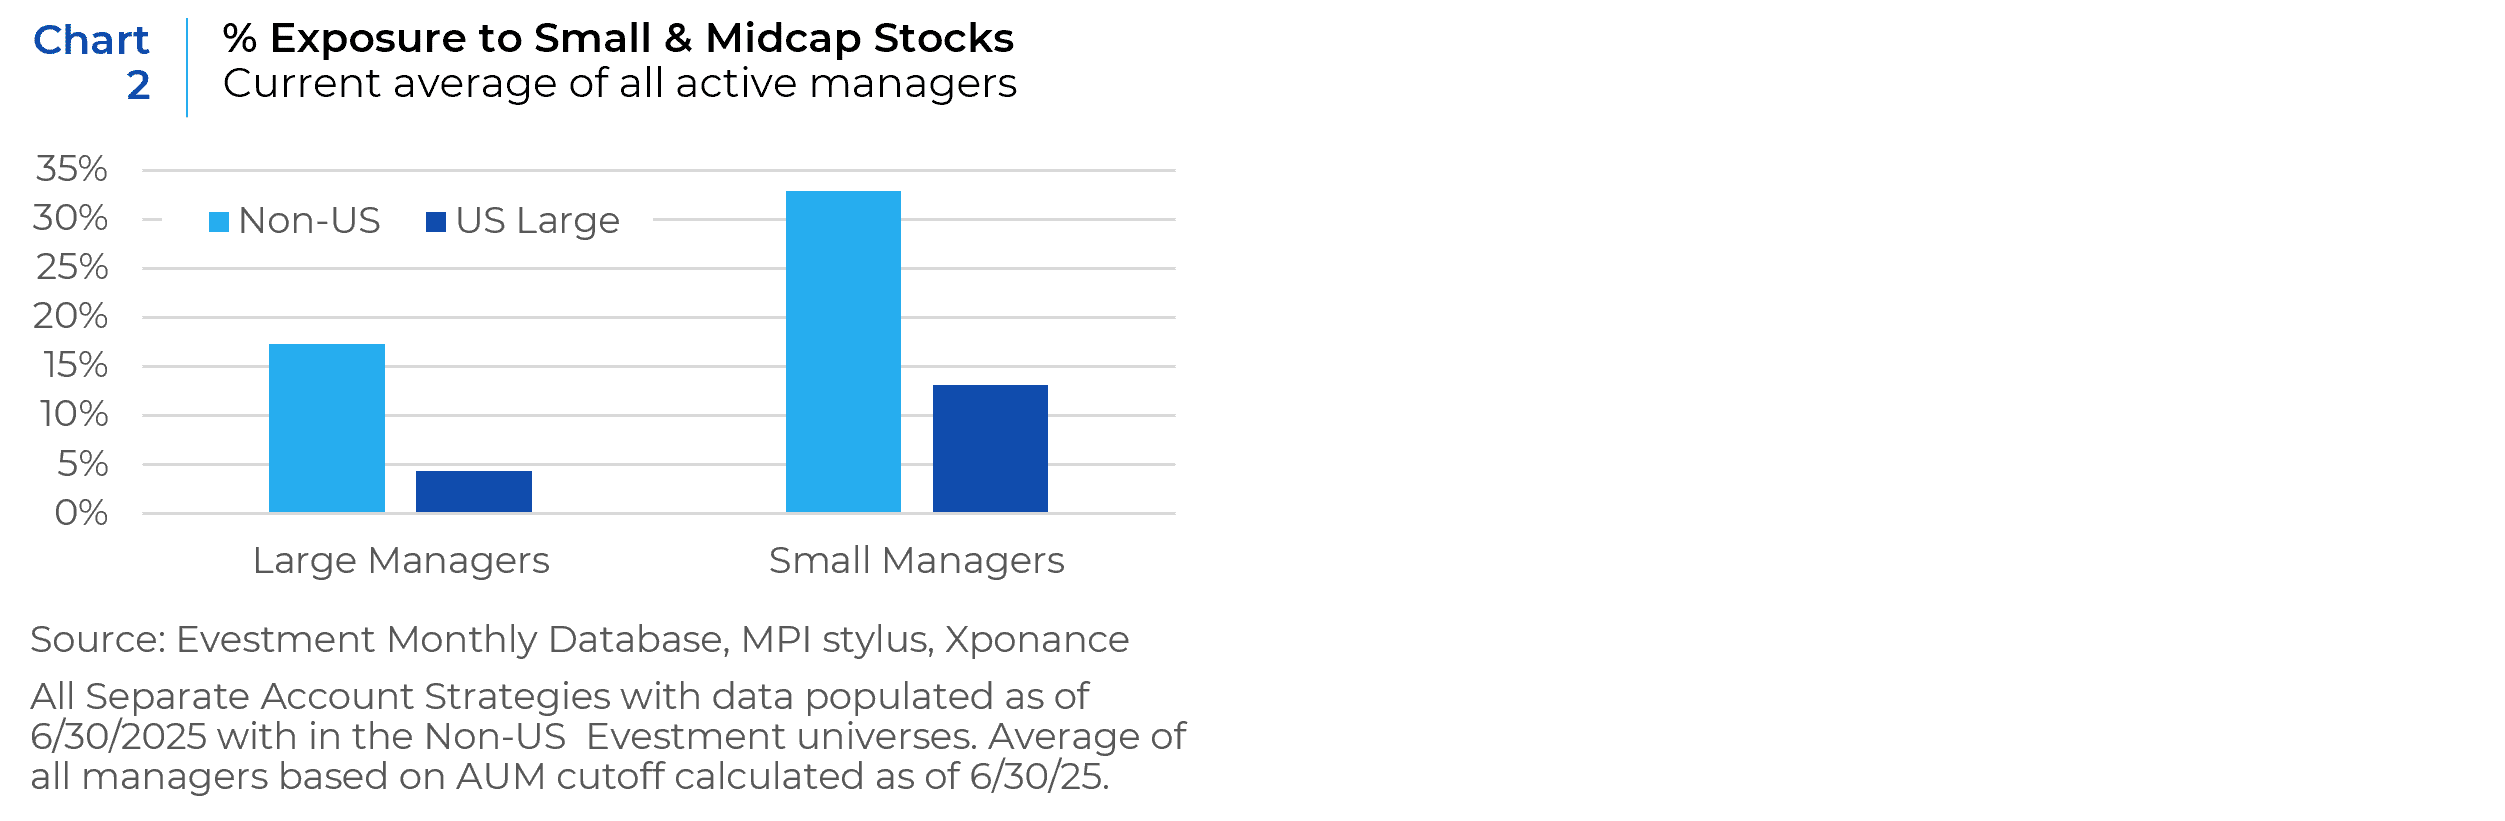
This scale effect is strongest in the segments we favor for multi-manager portfolios—U.S. small cap, international small cap, and emerging markets—where the investable universe for a $10 billion fund and a $500 million fund overlaps far less, and the spread in attainable alpha widens. Headline EAFE liquidity can imply minimal constraint for non-U.S. strategies, yet actual portfolios tell a different story: many managers reach down the cap spectrum, so a typical international large-cap portfolio behaves more like an all-cap approach and carries a larger share of less liquid holdings, as shown in Chart 2.
Segment results reinforce the link between scale, access, and excess return. Where liquidity costs rise with size, the boutique edge tends to be strongest, particularly in small-cap markets and emerging economies. The main nuance appears in the EAFE category, where boutiques expand into off-index small caps, altering the usual relationship between size and market accessibility.

The characteristics found in Table 1 help us build a complete picture of the differences between our 2 cohorts of managers. Boutiques run more concentrated portfolios (fewer holdings), incur higher active risk, and trade more frequently. These characteristics are exactly what we would expect from a portfolio less constrained by liquidity. In addition to these traits, a greater proportion of boutique firms employ quantitative techniques as part of their stock selection process. Many small firms adopt systematic or factor-based elements early, given the scalability and efficiency of quant tools, whereas larger firms often rely more on extensive fundamental analyst teams. Together, these characteristics paint a picture of boutique managers as agile, active risk-takers, in contrast to their more constrained and risk-averse established counterparts.
Having established that boutique managers have both the structural capability and empirical record of outperforming, we turn next to the core of our analysis: understanding the market drivers behind when boutiques do especially well or poorly relative to large managers. In the following sections, we examine the performance of boutiques versus established managers (boutique edge) in relation to a set of potentially explanatory factors.
Boutique Edge in Various Factor Regimes
We begin our deep dive by testing boutique edge across region and market cap relative to the regimes of variables we see as most likely to impact the edge through time.
Independent Variables
- Concentrated Losses – The magnitude of outsized negative contributions in the index. For each region or segment, we calculate the total return contribution of the bottom ten stocks in the benchmark (the ten largest detractors) over the quarter, adjusted for overall market direction. This indicator measures how much index performance was dragged down by a few big names. Large negative “concentrated losses” in the benchmark can create a favorable backdrop for boutiques who tend to underweight those large names.
- Concentrated Gains – Similarly, the total contribution of the top ten stocks in the benchmark (largest positive contributors) over the quarter. This captures how concentrated the market’s upside was. If a few mega-cap stocks drove a large portion of index gains, we expect active boutiques (often underweight those mega-caps) to struggle relative to managers who market weight those winners. Thus, very high concentrated gains tend to coincide with low boutique alpha (or even underperformance). Conversely, when index gains are not dominated by a few names (i.e. gains are more evenly distributed or modest), boutiques have more opportunity to add value.
- Stock Correlation – The average pairwise correlation among stocks in the benchmark (calculated quarterly, using daily prices). In periods of elevated correlation, individual stock selection tends to be thwarted (stocks move in unison often driven by exogenous macro factors), which historically hurts active performance. Low correlation (more idiosyncratic moves) creates a richer environment for skilled stock pickers and boutiques with a deeper opportunity set.
- Financial Stress Index – A composite measure of financial market stress (we use the St. Louis Fed Financial Stress Index), which incorporates credit spreads, volatility, interest rate moves, etc. It serves as a proxy for overall market turbulence or crisis risk. We theorized that during periods of heightened financial stress, boutique managers might benefit disproportionately due to their liquidity advantage. They can reposition quickly and potentially avoid the worst dislocations.
- Policy Uncertainty – An index of economic policy uncertainty (The Global Economic Policy Uncertainty Index) measuring the frequency of news referencing policy uncertainty. This gauges the macro policy backdrop. It is likely that periods when uncertainty is high macro risks dominate markets and stock selection is diluted (which would hurt boutiques). High policy uncertainty might create more alpha opportunities for nimble active managers (via mispricing), but those mispricing likely remain until uncertainty wanes. We included it expecting that when policy uncertainty is elevated, active boutiques could struggle waiting for market recognition of mispriced, contrarian views.
- Factor Skew – The absolute performance spread between value and growth stocks in that quarter (for the relevant market). A high “style skew” means one style dramatically outperformed the other. Extreme dominance of either growth or value can be challenging for diversified managers who are not 100% tilted to that winning style. Boutiques, however, often stick to a style niche or use quant models that avoid deep style bets, whereas large firms might diversify style exposures. We expect that extreme style skew creates headwinds for most active managers, potentially slightly more so for boutiques given the lower diversification of their portfolios.
- Size / Breadth Spread – The return spread between the cap weighted and equal-weighted index. Positive values indicate that the average stock in the benchmark underperformed the benchmark return (lack of breadth). We expect boutiques to perform best when market breadth is high, given their larger opportunity set.
- Size Premium – The return spread between the larger cap reference benchmark against the closest related All Cap benchmark. When large-caps dramatically outperform (positive size premium), boutique small-cap managers likely struggle (they tend to have more small exposure), and when small-caps lead (negative size premium), boutiques with higher small/mid exposure should benefit.
- Sector Skew – The absolute performance difference between cyclical sectors and defensive sectors. This indicates if market leadership was concentrated in a particular segment of the economy. A high sector skew (e.g. all tech stocks surging while defensives lag, or vice versa) can challenge diversified managers. We expect extreme sector dominance (one cluster of sectors driving returns) to be a headwind for many active managers, potentially compressing the boutique advantage due to less diversified sector exposures.
- Volatility – The implied volatility relating to the relevant index options markets (VIX for US Large Cap). Outside of the VIX index, which covers the full history of our analysis, we used published implied volatility indices as well as the calculated 30-day implied volatility of the largest index ETF for each benchmark. A sharp rise in volatility often coincides with market drawdowns or crises, which could either create opportunities for agile managers or, if extreme, cause indiscriminate selling that hurts smaller, less liquid stocks.
Methodology
We used a transparent but rigorous three-regime framework to profile how the boutique edge behaves across the full range of each market driver. Within each region and capitalization universe and for every potential driver, we searched for two cutoffs that partition the variables into “Low,” “Moderate,” and “High” regimes. Cutoffs were swept across a dense quantile grid (10th–90th percentiles in 5-point increments) and were accepted only if each regime had sufficient depth (at least 10% of the sample, minimum of three observations). The winning pair of thresholds maximizes the separation in average outcomes between the High and Low regimes, while enforcing an economic monotonicity check: the Moderate regime’s average must lie between the other two.
This approach is deliberately deterministic and replicable. Because the method is non-parametric and works in the variable’s native units, the resulting cutoffs are both interpretable and decision-ready (e.g., “when Sector Skew exceeds X%, average excess return improves by Y%”). The outcome is a concise, investor-friendly map of conditions that most differentiate performance. We strived to use a robust sampling discipline rather than fragile model assumptions.
Results
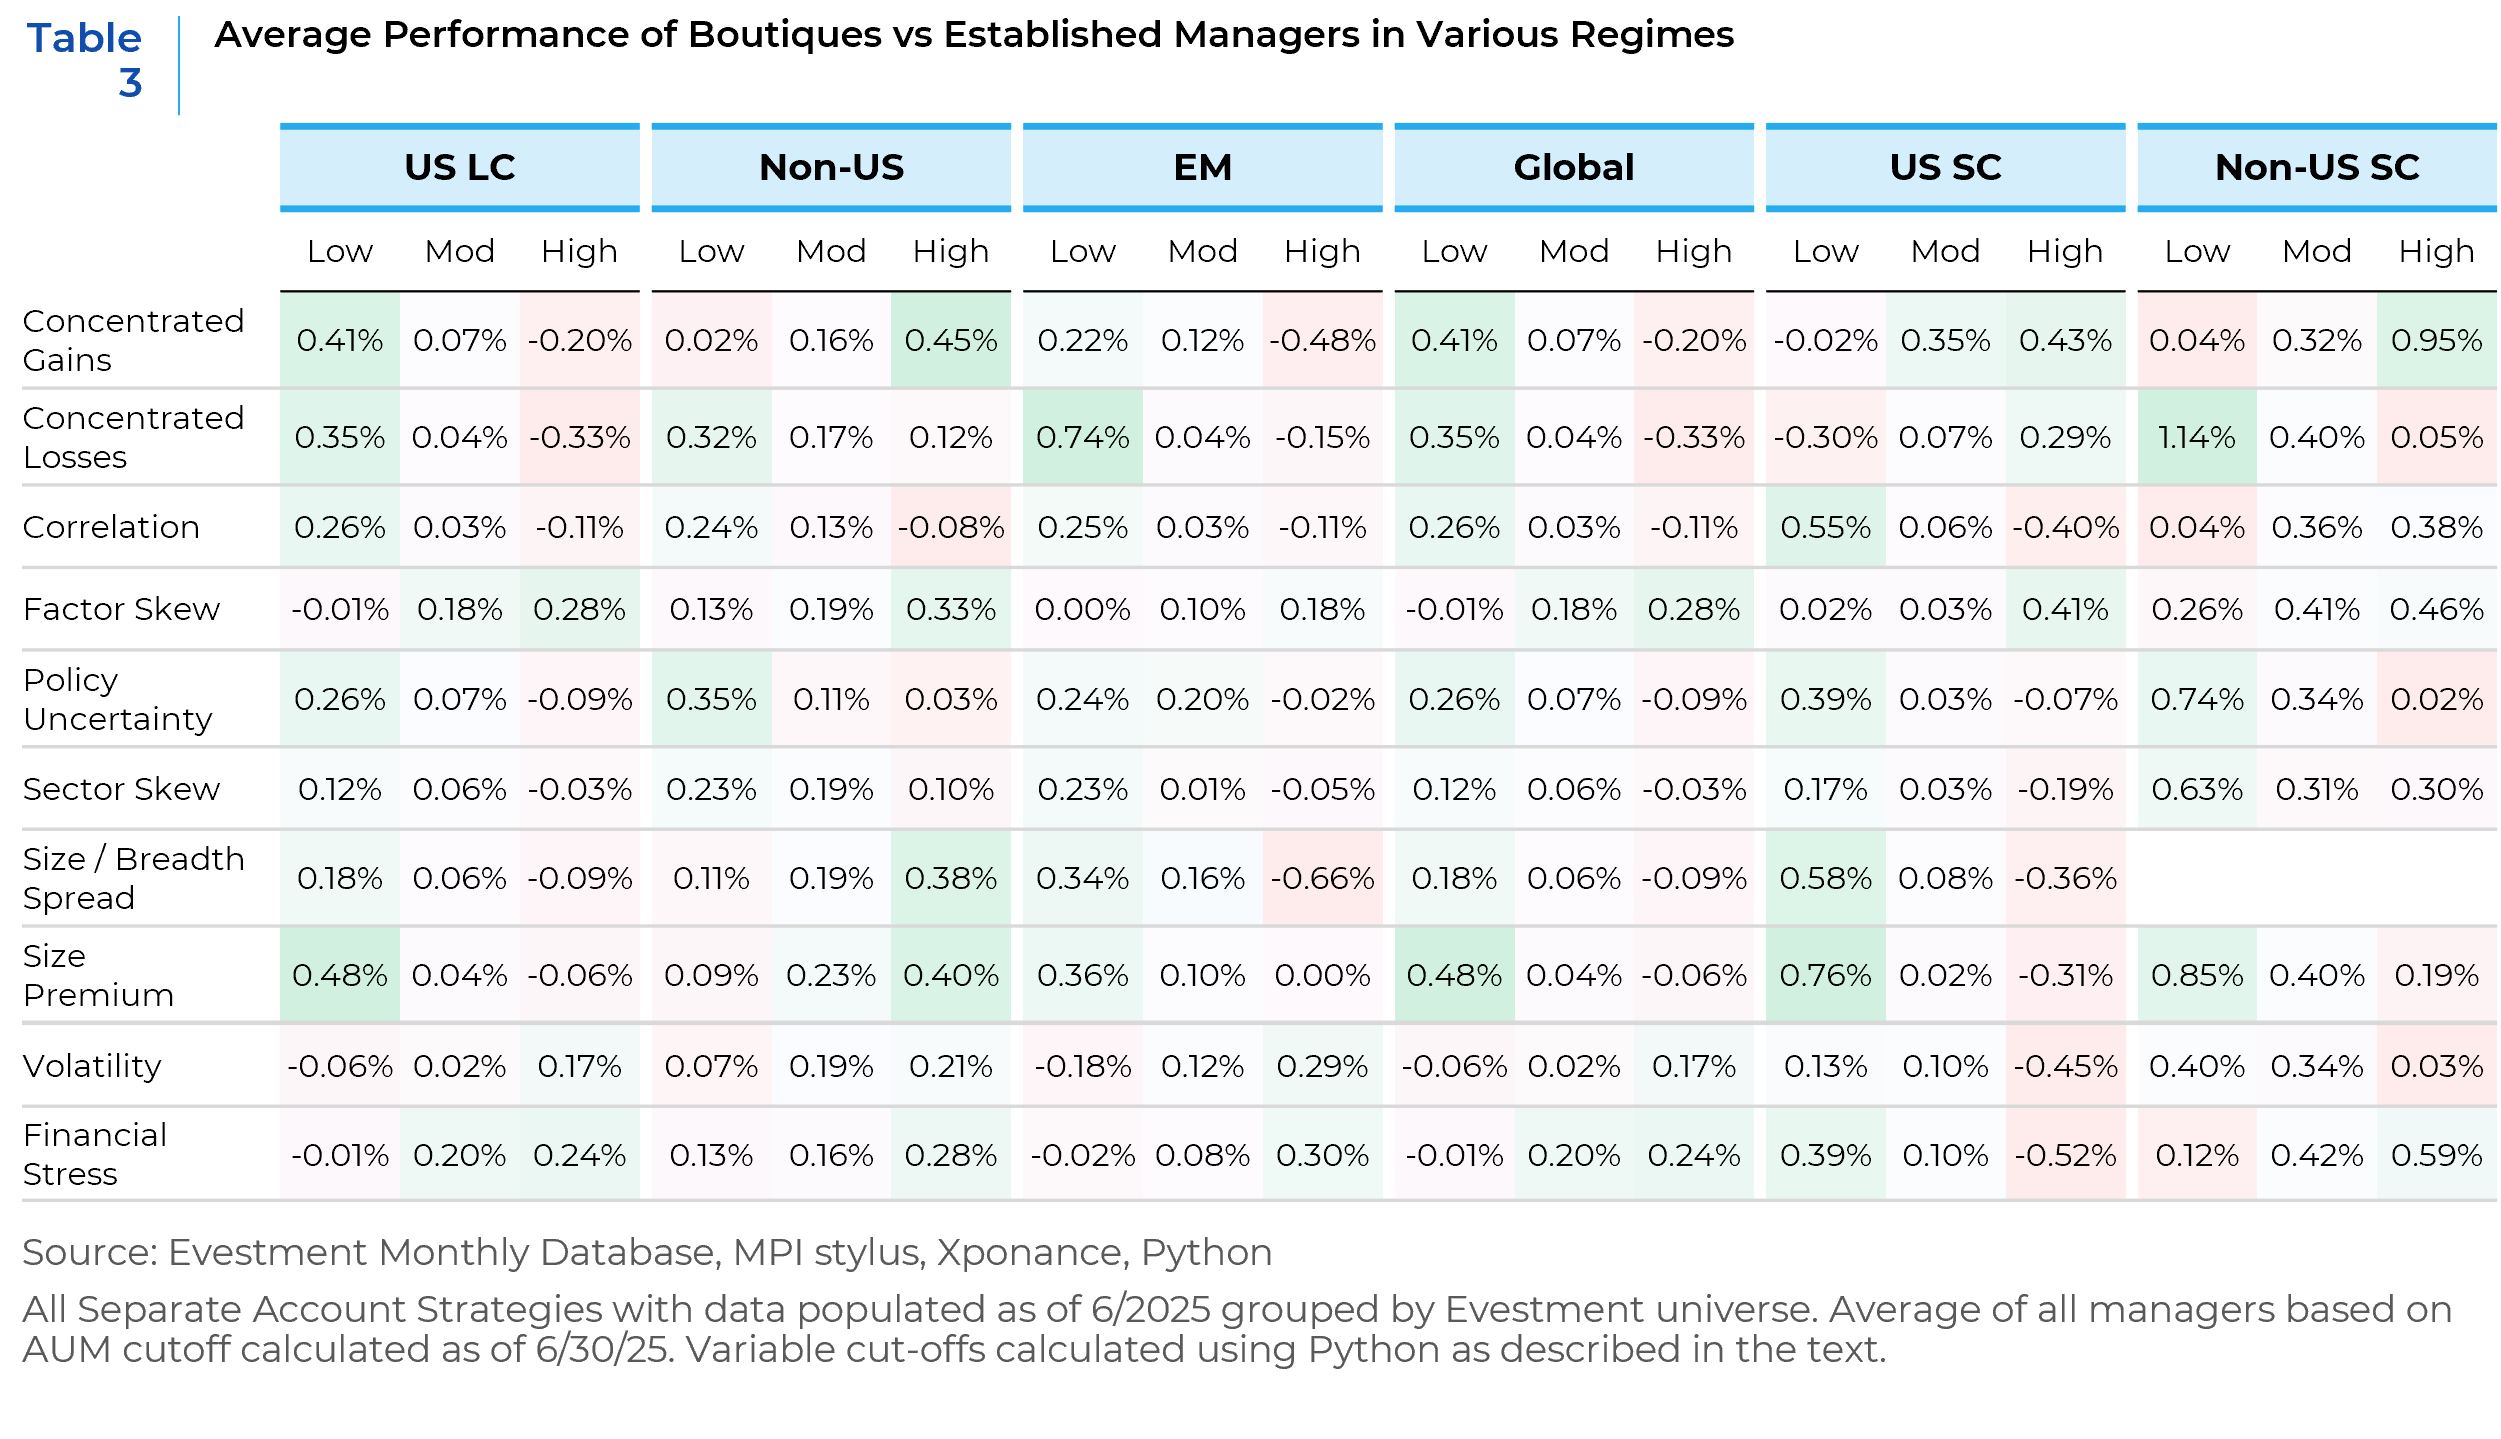
Across the six universes, several patterns are strikingly consistent.
- Style leadership matters: higher Factor Skew (a quarter when either Value or Growth decisively dominates) coincides with a stronger boutique edge in all six universes.
- Market stress tends to help. Elevated Financial Stress and Volatility regimes are associated with better boutique outcomes in most segments (five of six and four of six, respectively), consistent with the idea that nimble managers can reposition faster during dislocations.
- Environments that enhance stock-picking payoffs generally help: Lower Correlation and large Concentrated Losses (a handful of large detractors dominating index downside) are linked to stronger boutique results in five of six universes.
- Narrow breadth is another headwind, when cap-weighted indices beat equal-weight (our Size–Breadth Spread proxy), the boutique edge is typically lower (four of six).
- A positive Size Premium (large beating all-cap) tends to compress boutique outperformance in five of six universes, aligning with boutiques’ greater small/mid exposure.
Segment highlights help translate these themes into positioning guidance. In US Large Cap and Global, breadth and concentration dominate. Boutiques fare better when gains are not led by a short list of mega-caps (low “Concentrated Gains”), and worse when leadership narrows (low “Concentrated Losses”).
US Small Cap is most sensitive to regime conditions that restore idiosyncrasy, low correlation, and to a negative Size Premium (small outperforming large), both of which favor boutique approaches.
Emerging Markets show the largest penalty when breadth is narrow or losses are not concentrated, underscoring the value of diversified stock selection in EM markets.
Non-US and Non-US Small Cap exhibit a nuanced pattern: while concentrated losses still benefit boutiques, episodes of concentrated gains can be favorable, consistent with skilled stock-pickers tilting into the winners when leadership emerges outside of the US. This is likely due to the relative flatness of the non-US market, where the largest benchmark names rarely exceed a 3% weight.
Taken together, Table 3 indicates boutiques add the most value when markets reward dispersion and decisiveness (style leadership, stress, volatility) and add the least when returns are narrowly concentrated, highly correlated, or dominated by mega-cap strength. These results align with the paper’s framing of the drivers we tested, and the structural reasons boutiques can capitalize on them.
Conclusion
The boutique advantage persists across segments and cycles, but its size varies with the market backdrop. Results are strongest when markets reward dispersion and decisiveness. That shows up when style leadership is clear, correlations are lower, policy paths are better signaled, and benchmark losses are concentrated in the largest constituents. The edge narrows when leadership is confined to a few index heavyweights and correlations rise, which dampens stock specific payoffs.
For allocators, this lens complements manager underwriting by indicating when active risk is more likely to pay. Prior Alpha Availability work shows that concentrated benchmark losses in developed markets, combined with low to moderate liquidity and clearer policy, have supported active outcomes. Those are the climates in which high conviction boutiques are structurally positioned to press their advantage. When conditions invert, with high policy uncertainty, extreme correlations, and narrowly concentrated gains, active returns are harder to harvest, especially for systematic approaches. A regime aware blend of boutiques and larger benchmark anchored managers helps keep total active risk aligned with the opportunity set.
The structural reasons boutiques excel remain intact. Concentrated accountability, faster decision cycles, and access to less liquid segments allow smaller teams to take non index positions and reach capacity constrained alpha. Those same constraints on larger platforms, and the macro regimes that at times push correlations higher, explain why the payoff is episodic rather than constant.
Prioritization follows from these findings. The clearest hunting grounds are the capacity constrained universes, US small cap, EAFE small cap, and emerging markets, where smaller assets can still reach the full opportunity set and turn breadth into excess return over a cycle. Boutiques merit selective use in US large cap and global where the full period edge exists but narrowed in the recent five years as a small set of index leaders drove gains. Non-US large cap sits between these cases. Flatter cap weights and common practice of fishing down the cap spectrum have allowed skilled boutiques to add value even when leadership is somewhat concentrated. Netting it out, focus boutique allocations in US small, Non-US large and small, and EM as core sources of edge, and use boutiques as satellites in US large and Global, increasing those sleeves when breadth improves.
From the Boutiques
“My 14 years at my prior firm were wonderful and very formative to my development as an investor and leader Ultimately, as the market environment changed and I grew as an investor, I wanted to evolve my investment approach by adding more flexibility, balance, and nimbleness which was hard to do at a large established firm, despite being a senior PM. I also prefer smaller teams because I can pick the best talent, have tighter communication, maintain focus, and make better decisions in pursuit of alpha.“
– Ashraf Haque, Ravenswood Partners
“We left a large firm because we had a fundamentally different perspective on how to model equities quantitatively — one that was difficult to pursue within the constraints of a traditional, hierarchical organization with established and entrenched investment frameworks. We wanted the freedom to innovate, challenge assumptions, and build a differentiated investment model that delivers high conviction portfolios, better aligning with institutional clients’ needs. Our firm prioritizes research, intellectual diversity, and cultural alignment from the ground up.”
– Artemiza Woodgate, PHD IQI
“While I am grateful for the responsibility I was given by some excellent employers, I observed the cost of bureaucracy and corporate politics. My main reason for starting my own firm was my belief that a boutique firm, where the team worked in close cooperation, could achieve better long-term investment results than a large firm. The key difference is focus: working in a small, highly cohesive team, we have minimal distractions. The prospect of equity ownership for all of the current team members aligns our long-term interests and helps promote cohesiveness.“
– Tania Pouschine, Fithian
“Obviously, working at established firms has a lot of advantages, but at a certain stage in my career I thought it was better to build my own firm de novo with trusted partners. The reasons for this choice: freedom to invest where we believe the best opportunity is to generate the highest absolute and risk adjusted returns over the next 10 years. The opportunity to apply all the lessons learned from previous firms (both good and bad habits) in how we decided to do things, as well as reduce the “alpha drag/friction costs” that exist at larger firms by creating the culture we want. The ability to focus on continual learning, and dedicate resources on how to do things better and smarter”
– Mark Cooper, MAC Alpha
- https://www.xponance.com/wp-content/uploads/2017/02/FIS_Group_Survival_of_the_Nimble.pdf
https://www.xponance.com/wp-content/uploads/2021/04/Alpha-Availability-Part-1.pdf
https://www.xponance.com/wp-content/uploads/2021/04/Alpha-Availability-Part-2.pdf
https://www.xponance.com/wp-content/uploads/2021/04/Alpha-Availability-Part-3.pdf
https://www.xponance.com/wp-content/uploads/2017/02/FIS_Group_Active_Equity_Management_Alpha.pdf - Joseph Chen, Harrison Hong, Ming Huang, and Jeffrey D. Kubik, Does Fund Size Erode Mutual Fund Performance? The Role of Liquidity and Organization, American Economic Review, Vol. 94, No. 5 (December 2004), pp. 1276–1302. https://doi.org/10.1257/0002828043052277
- Andrew Clare, Steve Thomas, and Nick Motson, The Boutique Premium: Why Independent Asset Managers Outperform, SSRN Working Paper No. 5274063 (2025). Available at: https://papers.ssrn.com/sol3/papers.cfm?abstract_id=5274063
- Ajay Khorana, Henri Servaes, and Peter Tufano, Portfolio Manager Ownership and Fund Performance, SSRN Working Paper No. 923537 (2006). Available at: https://papers.ssrn.com/sol3/papers.cfm?abstract_id=923537
- https://www.xponance.com/wp-content/uploads/2021/04/Alpha-Availability-Part-1.pdf
https://www.xponance.com/wp-content/uploads/2021/04/Alpha-Availability-Part-2.pdf
https://www.xponance.com/wp-content/uploads/2021/04/Alpha-Availability-Part-3.pdf
https://www.xponance.com/wp-content/uploads/2017/02/FIS_Group_Active_Equity_Management_Alpha.pdf - Papermark, How Much Does Due Diligence Cost in 2025?, published December 31, 2024. Available at: https://www.papermark.com/blog/due-diligence-cost
- Callan Institute, 2025 Cost of Doing Business Study: Key Highlights, published September 15, 2025. Based on data from 180 institutional asset pools totaling over $772 billion, the study analyzes fee structures and trends across public, corporate, nonprofit, and insurance funds. Available at: https://www.callan.com/blog-archive/2025-cost-of-doing-business
This report is neither an offer to sell nor a solicitation to invest in any product offered by Xponance® and should not be considered as investment advice. This report was prepared for clients and prospective clients of Xponance® and is intended to be used solely by such clients and prospective clients for educational and illustrative purposes. The information contained herein is proprietary to Xponance® and may not be duplicated or used for any purpose other than the educational purpose for which it has been provided. Any unauthorized use, duplication or disclosure of this report is strictly prohibited.
This report is based on information believed to be correct but is subject to revision. Although the information provided herein has been obtained from sources which Xponance® believes to be reliable, Xponance® does not guarantee its accuracy, and such information may be incomplete or condensed. Additional information is available from Xponance® upon request. All performance and other projections are historical and do not guarantee future performance. No assurance can be given that any particular investment objective or strategy will be achieved at a given time and actual investment results may vary over any given time.