
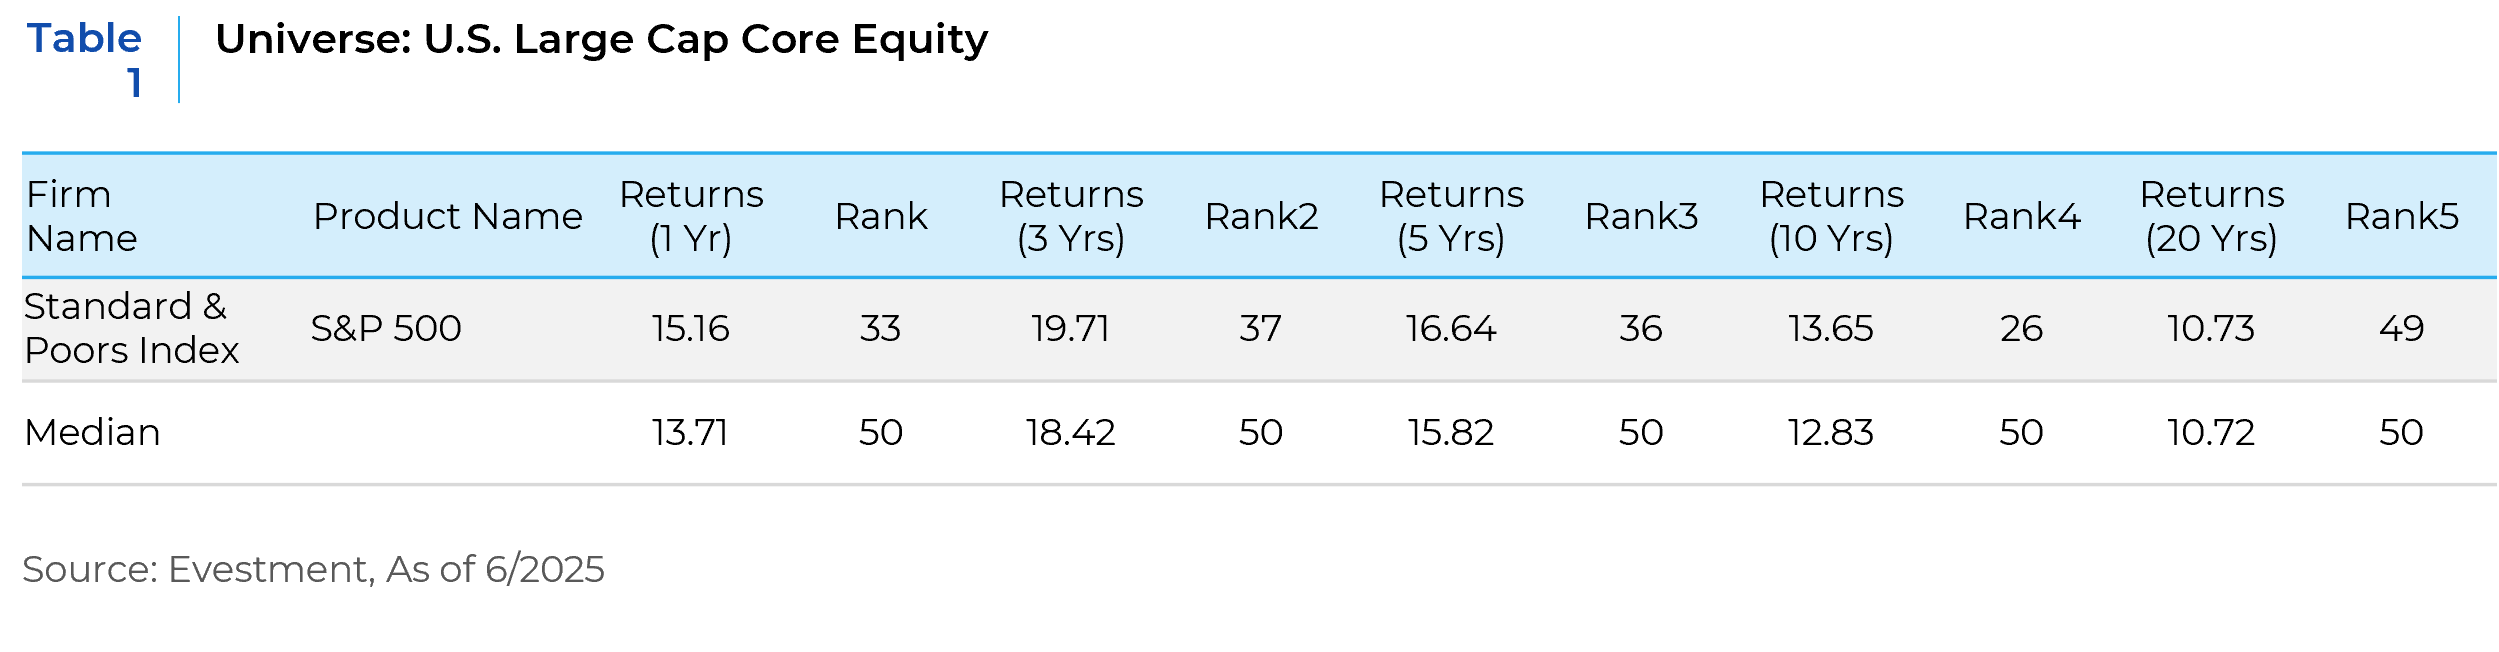
Traditional public equity markets have experienced a sustained rise in passive investing, particularly through index replication. Indexing enables investors to gain broad exposure to various equity indices in a cost-effective way, thanks to minimal turnover that reduces transaction costs and can enhance net returns. Proponents of equity index investing argue that active managers consistently fail to outperform the market and that the costs associated with active management are unjustified given its volatility and tendency toward style drift over market cycles. Supporting this view, the SPIVA US Scorecard (S&P Global) found that equity funds underperformed the S&P 500 in 64% of instances over a 24-year period. Moreover, the S&P 500 has outperformed the median equity manager across all time frames over the past 20 years.
Conversely, passive fixed income management often results in mediocre returns while exposing investors to downside risks, including higher tracking error and elevated trading costs. Broad bond market indices frequently underperform relative to the wider peer group—that is, the universe of active managers using the same benchmark.
In this paper, we begin by examining the differences between equity index construction and fixed income benchmark construction. We then analyze data from the eVestment database to evaluate the performance of the Bloomberg Aggregate index relative to the median active manager. This comparison supports our central argument: that a passive indexing approach in fixed income often leads to subpar results. We further explore the composition of the Aggregate index, highlighting how its structural rules render it impractical for effective indexing. Finally, we consider the index’s evolution and argue that its inherent inefficiencies strongly favor active management.
U.S. equity indices are constructed by index providers—such as S&P Dow Jones, FTSE Russell, and MSCI—through a three-step process: first, defining an eligible universe of companies; second, applying screening criteria like liquidity and financial viability; and third, selecting constituents based on specific rules to create a representative benchmark. The finalized index then applies a weighting methodology, such as market capitalization or price, to determine each constituent’s influence. Periodic rebalancing and reconstitution help ensure the index remains aligned with evolving market conditions.
Unlike equity benchmarks, fixed income indices are governed by a set of rules that determine which securities are included. Although index providers periodically update these inclusion criteria to reflect market developments, the process lacks the qualitative judgment found in equity index construction. For instance, the Bloomberg U.S. Aggregate Bond Index comprises investment-grade, USD-denominated, fixed-rate bonds from the Treasury, Government-Related, Corporate, and Securitized sectors—including Mortgage-Backed Securities (MBS), Asset-Backed Securities (ABS), and Commercial Mortgage-Backed Securities (CMBS). Eligible bonds must meet minimum requirements for par amount outstanding and have at least one year remaining to final maturity or average life. Additionally, they must be SEC-registered, Rule 144A with registration rights, or unregistered but possess registration rights. The index excludes fixed-rate perpetuals and bonds convertible to floating-rate instruments. Other commonly excluded core fixed income asset types include floating-rate bonds, Treasury Inflation-Protected Securities (TIPS), taxable municipal bonds, and much of the private-label securitized universe.
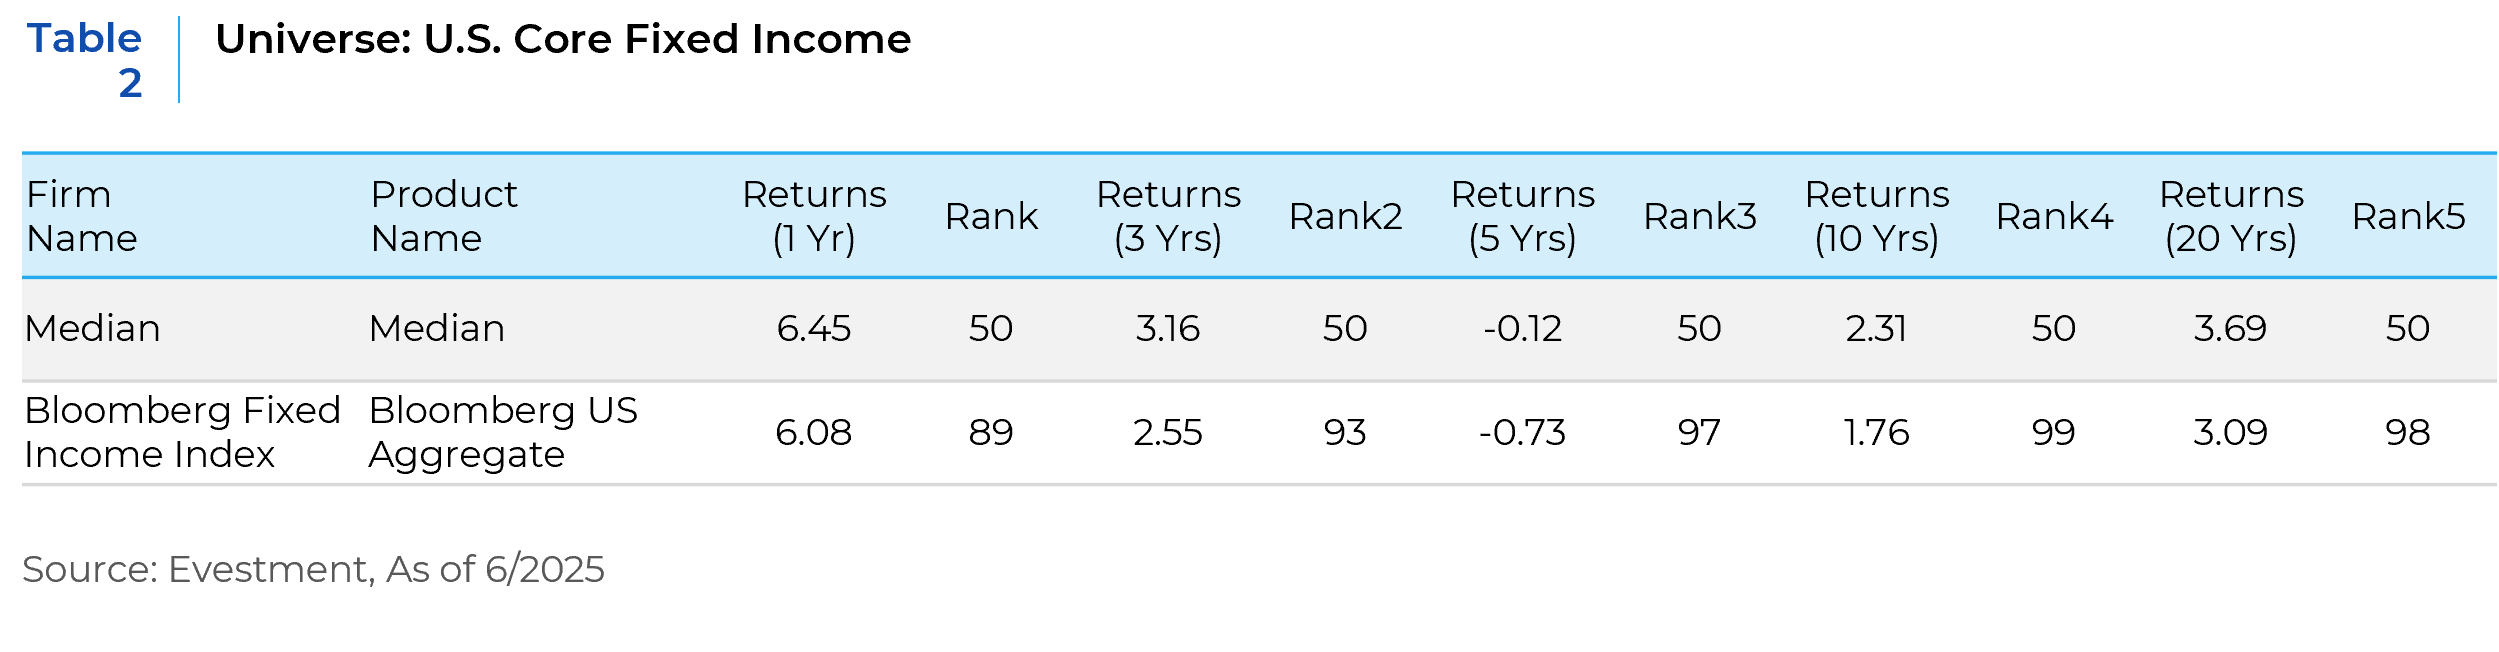
Active core fixed income management has consistently outperformed the Aggregate index over the past twenty years (see below). By employing an active approach, managers can deliver stronger absolute and risk-adjusted returns, while also providing greater downside protection and reduced volatility. In contrast, passive fixed income investing is inherently flawed, exposing investors to evolving risks—such as increased exposure to the most indebted sectors of the economy—without the flexibility to adapt. Structural dynamics within the fixed income market tend to favor active management. Unlike equities, fixed income securities are mean-reverting, making it disadvantageous to chase the largest or most expensive issuers and sectors represented in an index. As passive investors and large asset managers concentrate on these dominant issuers, a broad and often overlooked universe of securities remains available for active managers to thoughtfully incorporate into client portfolios.
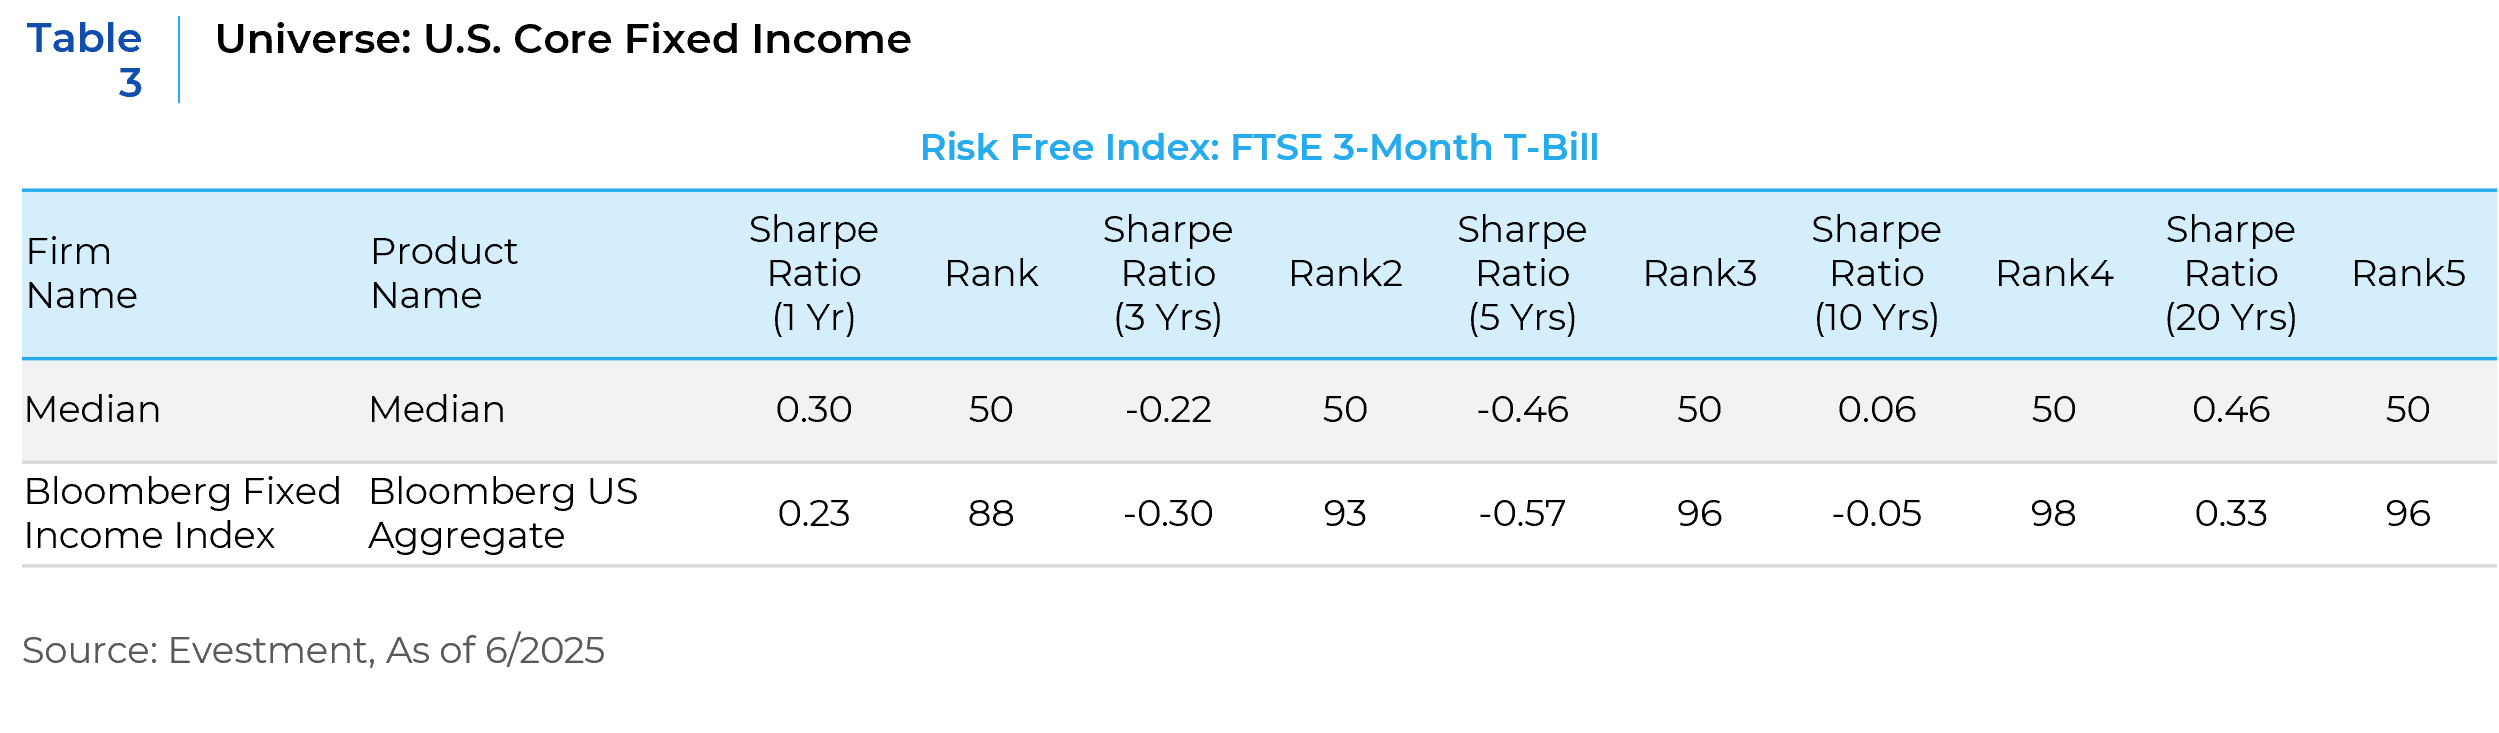
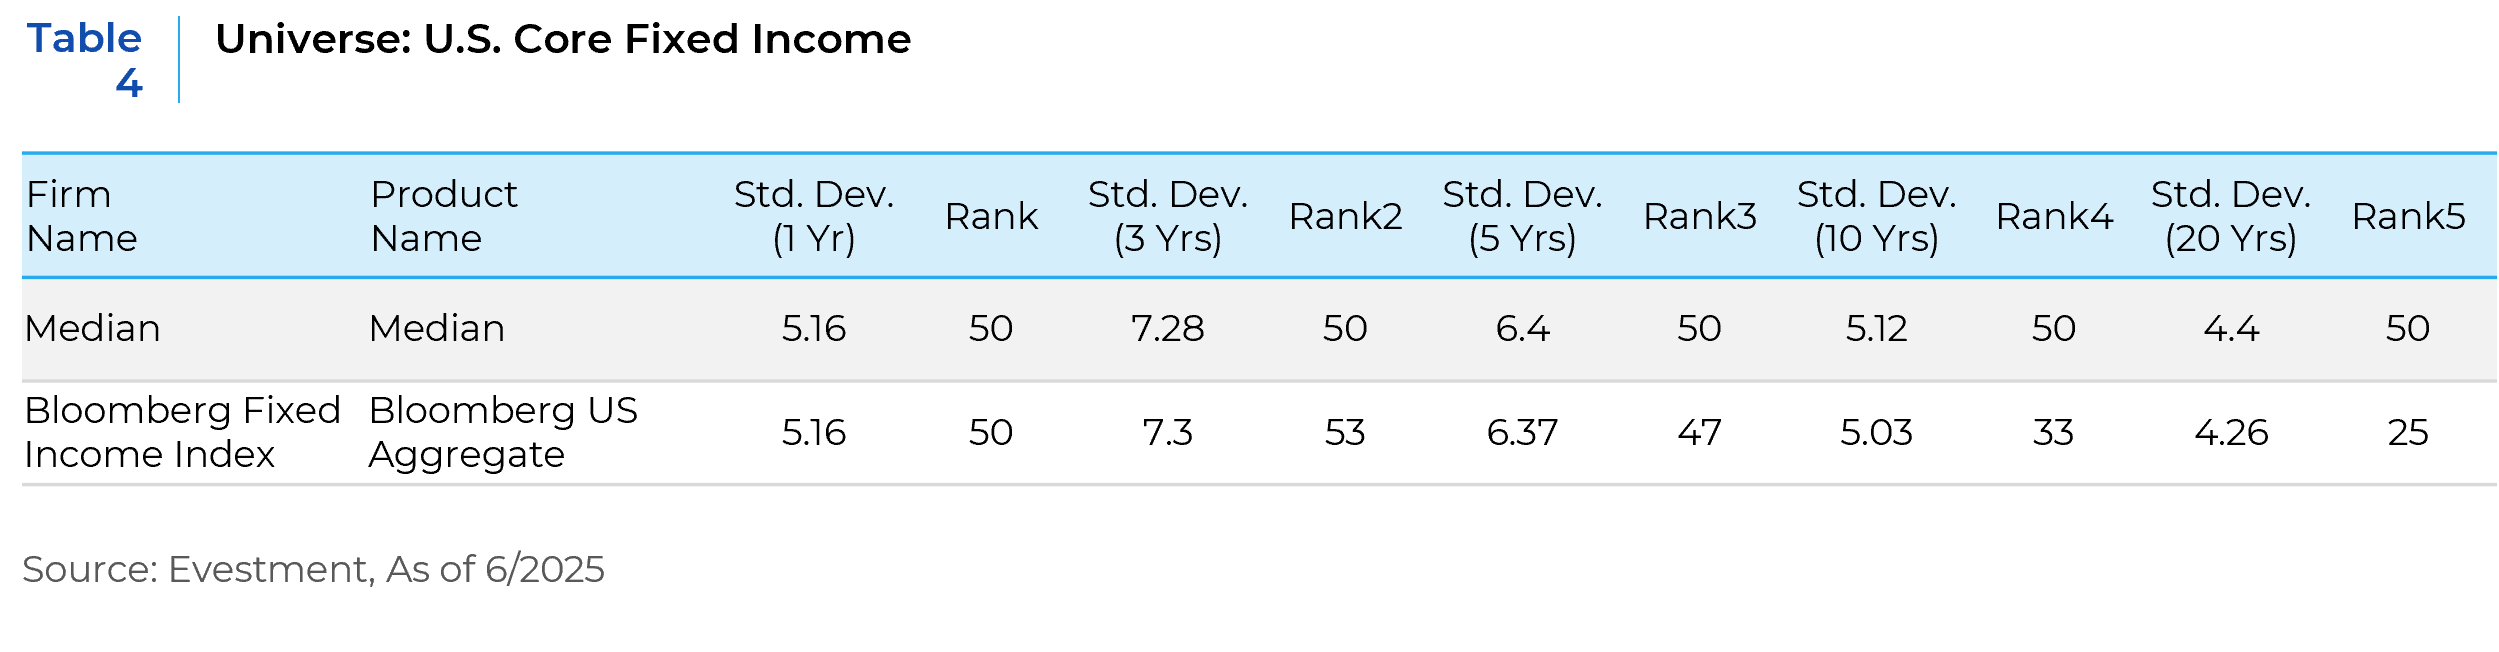
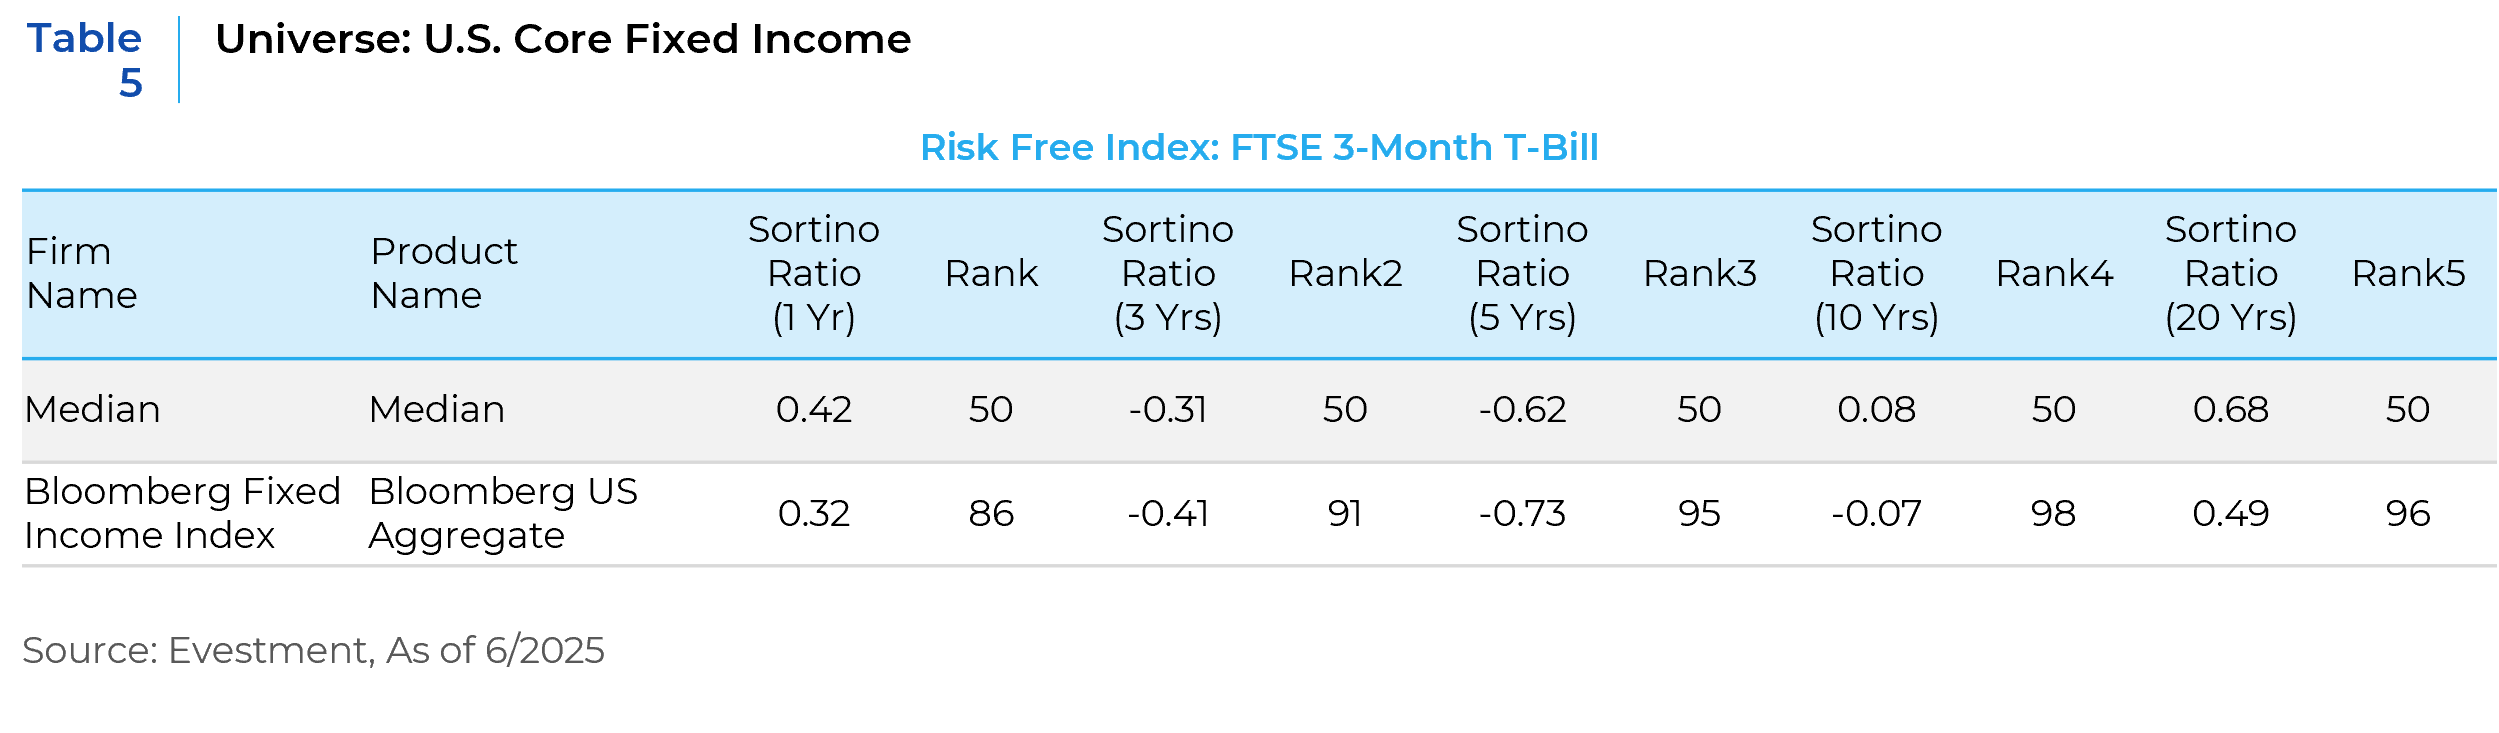
The following charts present data collected from eVestment. We compared the Bloomberg Aggregate Index with the median core fixed income manager to evaluate performance rankings and key risk metrics, including the Sharpe ratio, Sortino ratio (which measures downside risk), and standard deviation (a proxy for volatility). Across all observed time periods, the index significantly underperformed the median manager on every metric. Instances of index outperformance typically coincide with periods of elevated market and economic volatility—such as the Global Financial Crisis (GFC) or the COVID-19 pandemic—when U.S. Treasuries outperform due to a broad flight to quality. Notably, within the investment-grade universe that comprises the Aggregate Index, U.S. Treasuries and BBB-rated corporates represent the two most volatile ratings cohorts on a mark-to-market basis, reflecting their heightened sensitivity to economic cycles and external shocks.
In addition, we analyzed index performance relative to the average active manager over rolling three-year periods beginning in 2005, as well as rolling one-year periods within the same timeframe. The objective was to identify when—or if—the index outperforms. As shown here, the index consistently lagged during all three-year periods, even those encompassing exogenous and anomalous events such as the Global Financial Crisis (GFC), the Zero Interest Rate Policy (ZIRP) era, and the COVID-19 pandemic.
As shown below, the rolling one-year index performance since 2005 continues to support our thesis: the index rarely outperforms. In fact, instances of above-median performance occurred only during the historic drawdowns of the Global Financial Crisis (GFC), underscoring the index’s tendency to lag outside of extreme market dislocations.
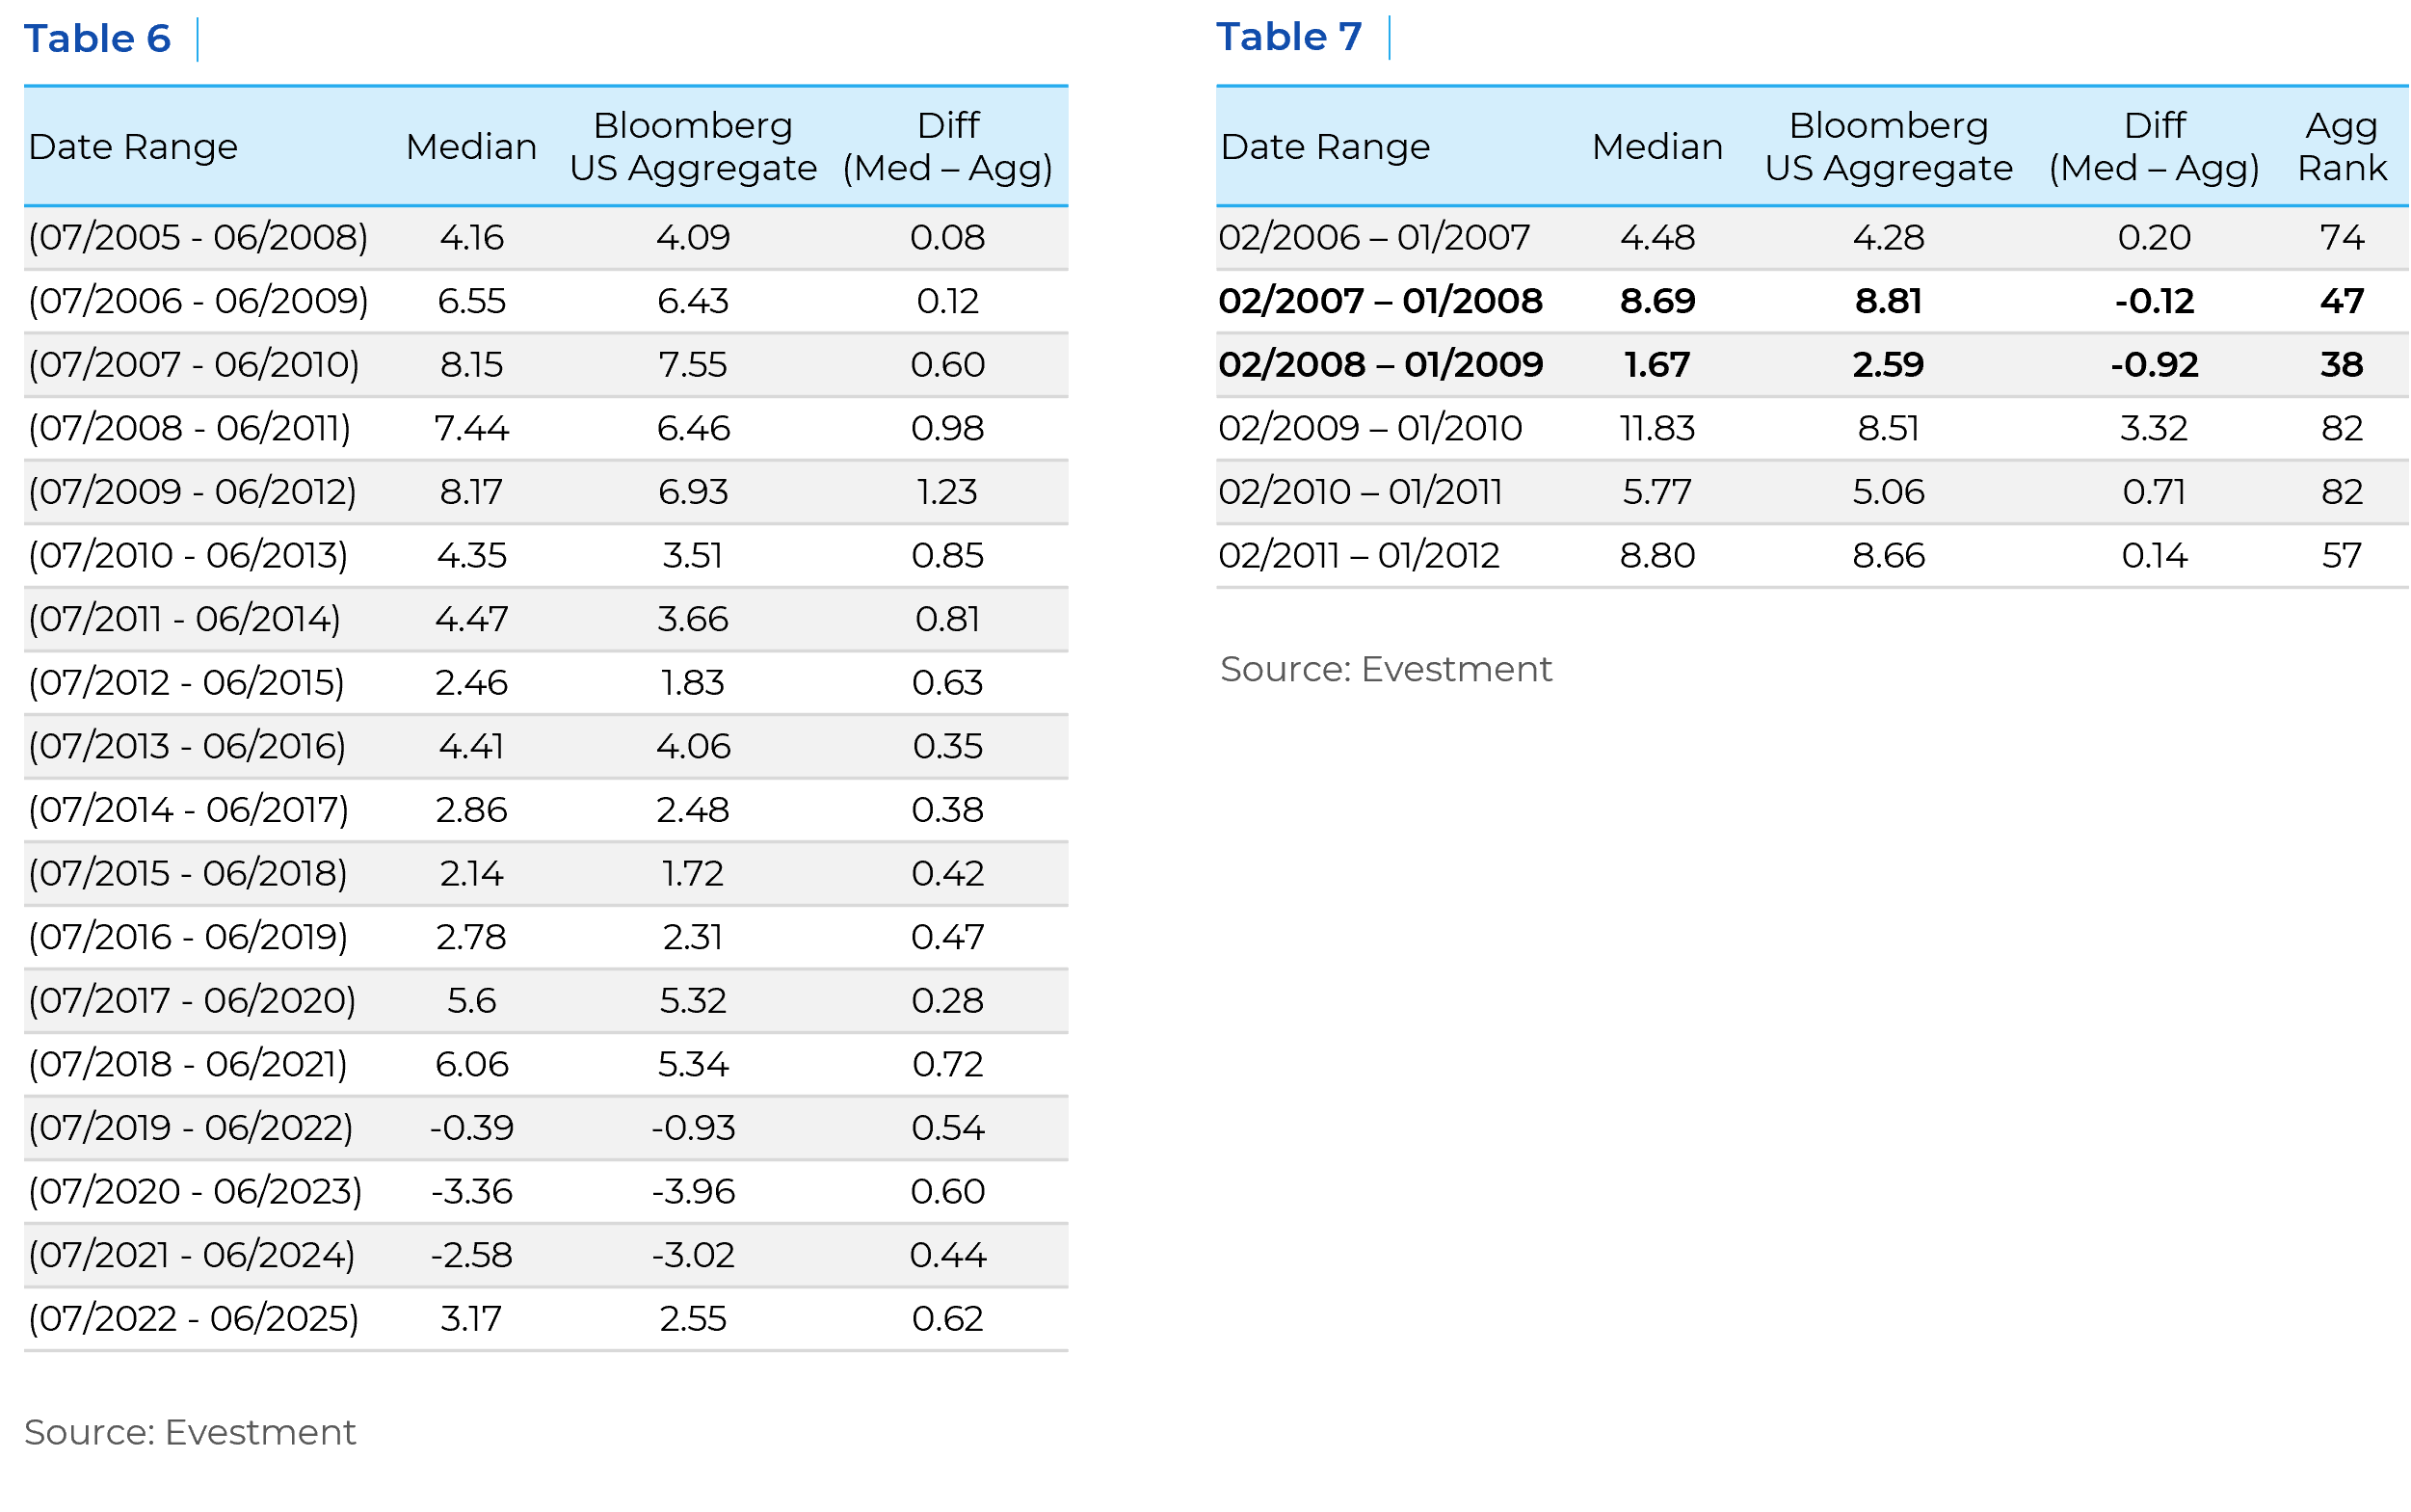
During that period, securitized risk assets collapsed, credit spreads widened significantly, and U.S. Treasury yields fell sharply. In response, the Federal Open Market Committee (FOMC) launched an aggressive rate-cutting campaign, ultimately reducing the Federal Funds Rate by 500 basis points. Essentially, passive fixed income investing tends to lock in mediocre long-term performance, with its relative outperformance typically occurring during rare “black swan” events.
Comparatively, passive equity investors benefit from extremely low turnover and minimal transaction costs due to the standardized nature of traditional equity indices. Stocks trade on centralized exchanges with transparent, real-time pricing. Bonds, by contrast, are primarily traded in a negotiated, over-the-counter market without a centralized exchange or designated market makers. Unlike equities, bonds lack a visible exchange price—though FINRA’s TRACE service does require recent bond trades to be reported to a centralized database. Bond prices are typically dealer-quoted and subject to negotiation.
Bond index turnover is influenced by several factors, including bond maturities, month-end index rebalancing (which involves removing issues with less than one year to maturity, adding new primary market issuance across sectors, and excluding downgraded issuers), and the reinvestment of coupon income. Due to the complexity of bond trading and the vast number of securities in each benchmark, fixed income transaction costs are often significantly higher than those in equities, contributing to greater tracking error. Nevertheless, transaction costs are inherently reflected in net-of-fee performance metrics, and eVestment comparisons account for this when evaluating active managers against the index.
A brief history of this evolving and expansive bond index is as follows. The Lehman Aggregate Bond Index was established in 1986 to measure value and total return across the broad bond market, serving as the investable universe for a wide range of fixed income practitioners. Since its inception, it has become the flagship benchmark for many bond investors and is now known as the Bloomberg U.S. Aggregate Index. Initially, the index included 6,240 securities representing $2.1 trillion in assets, composed primarily of fixed-rate, investment-grade, taxable securities from the U.S. Government, Agencies, and Credit sectors.
As the bond market has expanded, additional sectors have been incorporated—including Mortgage-Backed Securities (MBS), Asset-Backed Securities (ABS), and Commercial Mortgage-Backed Securities (CMBS). Over time, as the underlying constituents and sectors have become more indebted or leveraged—compounded by the effects of inflation—the index has grown to include over 13,000 securities, totaling approximately $28 trillion in market value. Notably, it still represents only a portion of the total U.S. bond market, which now exceeds $41 trillion.
This structural evolution, combined with exogenous shocks from the 2008 Global Financial Crisis through 2024, has introduced inefficiencies that can be strategically targeted to enhance performance. We’ve already discussed the substantial growth in U.S. Treasuries and, to a lesser extent, corporate credit. However, the rules-based nature of the index has also led to a departure from its original purpose as a proxy for the broad bond market. While U.S. Treasuries and corporate bonds have long represented a significant—and variable—portion of broad bond market indices, their rapid expansion has disproportionately crowded out securitized sectors within the U.S. Aggregate Index.
Although the inclusion rules were designed to improve liquidity, they have inadvertently created disparities in risk premia that reflect issue size and index exclusion rather than creditworthiness. A striking example is the Asset-Backed Securities (ABS) sector, where securities must exceed $500 million in size to qualify for inclusion. While provisions exist to include smaller tranches from qualifying deals, the result is still a substantial exclusion of the ABS market. Currently, only about 8% of the available ABS universe is represented in the Aggregate benchmark, leaving entire creditworthy subsectors entirely omitted.
As a result, the index is largely composed of Treasury debt and a concentration of large corporations, with weights skewed toward the most indebted or highly leveraged issuers. One key drawback of passive investing is its heightened exposure to index downgrades, which can trigger forced liquidations at inopportune times—often with adverse execution due to mark-to-market risk. For active investors, volatility can present opportunity, particularly given the mean-reverting nature of bond performance. According to eVestment data, the median manager has achieved a batting average of 67% over the past 15 years. However, it’s important to note that median performance rarely secures the hypothetical mandate, especially for experienced active fixed income managers aiming to deliver consistent outperformance.
Fixed income returns are primarily driven by coupon income over time, as price fluctuations tend to average out in the long run—especially when bonds are held to maturity and do not default. This dynamic allows active fixed income managers to capitalize on structural inefficiencies within the benchmark through nimble portfolio construction and a risk-adjusted framework grounded in bottom-up fundamental security analysis.
Key strategies that support strong active management include:
- Duration and yield curve management: This involves developing a well-reasoned macro thesis and executing opportunistic curve positioning, which can add alpha through targeted exposure along the yield curve, including credit curve management.
- Fundamental credit analysis and sector/security selection: Often a primary driver of alpha, this approach enables managers to identify undervalued opportunities across sectors.
- Access to enhanced yield through non-index securities: Many securities are excluded from benchmarks solely due to size constraints, yet they may offer attractive risk-adjusted returns.
By quantifying major sources of risk—such as duration, yield curve shifts, credit spreads, and prepayment risk—an active manager can construct a disciplined risk budget that seeks to optimize excess returns. This approach enables the construction of portfolios designed to outperform structurally disadvantaged indices like the Bloomberg U.S. Aggregate.
In conclusion, there are numerous pathways to success in active fixed income management. As discussed, the index’s structural inefficiencies, rules-based composition, and liquidity premia have contributed to underperformance across multiple time periods—creating compelling opportunities for yield-driven, risk-aware active managers. The proof is in the numbers.
This report is neither an offer to sell nor a solicitation to invest in any product offered by Xponance® and should not be considered as investment advice. This report was prepared for clients and prospective clients of Xponance® and is intended to be used solely by such clients and prospective clients for educational and illustrative purposes. The information contained herein is proprietary to Xponance® and may not be duplicated or used for any purpose other than the educational purpose for which it has been provided. Any unauthorized use, duplication or disclosure of this report is strictly prohibited.
This report is based on information believed to be correct but is subject to revision. Although the information provided herein has been obtained from sources which Xponance® believes to be reliable, Xponance® does not guarantee its accuracy, and such information may be incomplete or condensed. Additional information is available from Xponance® upon request. All performance and other projections are historical and do not guarantee future performance. No assurance can be given that any particular investment objective or strategy will be achieved at a given time and actual investment results may vary over any given time.