
- This article offers an incisive look into the factor vetting process, crucial for developing effective stock selection models in finance. It highlights the importance of distinguishing robust factors from mere statistical noise, minimizing multicollinearity, and preventing overfitting to enhance model performance.
- The process encompasses idea generation, hypothesis testing, rigorous data preprocessing, factor efficacy evaluation, and correlation analysis.
- Utilizing methods like Information Coefficient and Spearman Rank Correlation, the article underscores the blend of quantitative and qualitative analyses in selecting statistically valid and fundamentally sound factors.
- Essential for industry professionals, this process ensures the creation of adaptable, predictive models, key to navigating the complexities of the financial markets.
In the ever-evolving world of finance, the precision and effectiveness of stock selection models are paramount. These models guide investment decisions and rely heavily on the factors chosen as inputs. However, not all factors are created equal. This is where factor vetting comes into play—a rigorous and systematic process designed to sift through factor candidates, ensuring that only the most reliable and impactful ones are included in stock selection models. This article delves into the detailed aspects of this process, offering a deep dive into the nuances of factor selection for stock selection models.

The Necessity of Factor Vetting
The factor vetting process is a comprehensive framework that combines fundamental insights with quantitative methods. Its primary objective is to identify, evaluate, and validate the most promising factor candidates for inclusion in stock selection models. This process is underscored by several key objectives, each critical to the integrity and efficacy of the models:
- Finding True Signals Over Noise: The thorough nature of the factor vetting process is instrumental in distinguishing genuine indicators of stock performance from mere statistical noise. This discernment is crucial in avoiding the common pitfalls associated with data mining, where spurious patterns can be mistakenly interpreted as significant.
- Decreasing Multicollinearity: A primary focus of the vetting process is to ensure that the selected factors do not overlap excessively or correlate strongly with one another. Such overlaps or high correlations could lead to multicollinearity, a condition that undermines the reliability of model predictions and obscures the true impact of individual factors.
- Reducing Overfitting and Enhancing Model Performance: The vetting process plays a vital role in constructing models that are not just tailored to fit historical data but are robust and predictive for future stock performance. This approach helps in reducing overfitting, a scenario where a model performs well on past data but poorly on new, unseen data.
The Factor Vetting Process
1. Idea Generation and Data Collection
The process generally begins with idea generation and data collection, utilizing various research sources to gather promising factor candidates. One way of organizing these factors is to use groups like Value, Growth, Quality, Sentiment etc. to categorize them. One of the hurdles encountered in this step is the problem of missing data. To address this, imputation methods may be employed for missing values. For instance, for some sentiment factors, zeros are imputed in advance to indicate the absence of analysts’ ratings or revisions data for a given month.
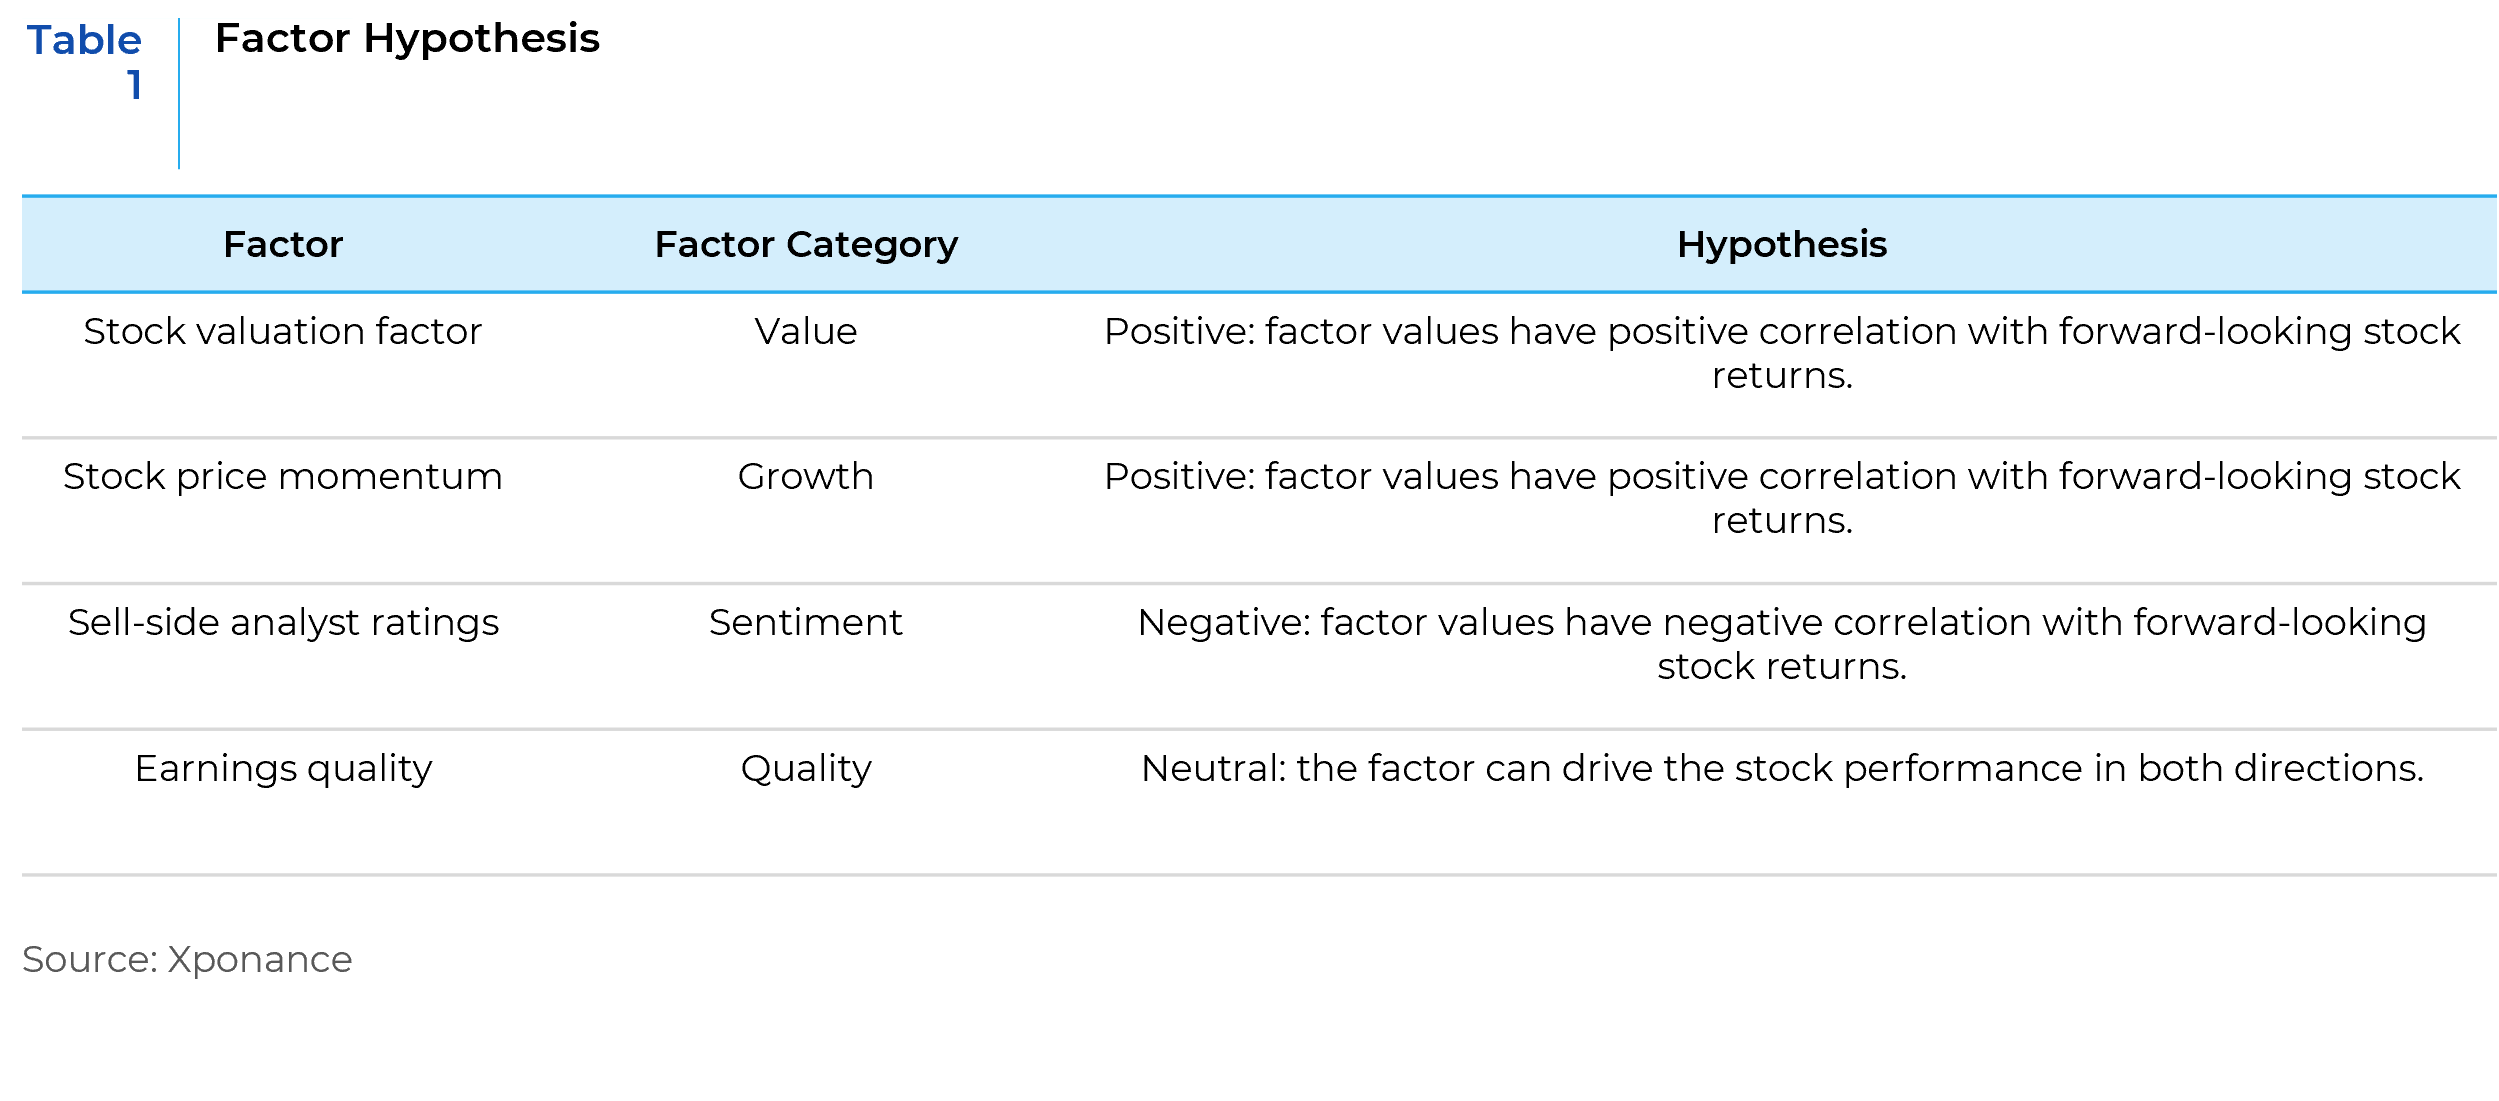
2. Factor Hypothesis
Setting up the factor hypothesis is a critical step in factor research. Here, an ex-ante hypothesis for each factor is established, focusing on the expected directional impact on stock performance. This hypothesis should be grounded in fundamental rationale, supported by robust conviction and empirical evidence gathered through the previous research stage. The primary focus should be on answering the following two questions:
- Does this factor potentially have a significant impact on stock performance?
- In which direction does the factor drive stock performance?
Table 1 provides some examples of this step of the process.
3. Data Preprocessing
Data preprocessing is a pivotal stage in the factor vetting process for stock selection models. This stage transforms raw data into a refined format suitable for analysis, ensuring the reliability and validity of the subsequent factor efficacy review in the process. By thoroughly examining data distribution, addressing missing values, detecting, and adjusting outliers, and normalizing and scaling data, this process lays a strong foundation for building robust and predictive models. Each step contributes significantly to the overall integrity of the model, ensuring that the factors included provide a true and meaningful representation of the stock market dynamics.
- Data Distribution and Outlier Processing
Data distribution analysis reveals a small percentage of extreme values that can skew results. To maintain data integrity, outlier detection and winsorization are applied. This involves setting lower and upper bounds for data points based on fundamental insights and adjusting extreme values to these limits. This process helps in maintaining a more normal distribution of data, crucial for statistical analysis and ensuring that the models are not biased by extreme, unrepresentative data points. - Missing Value Analysis
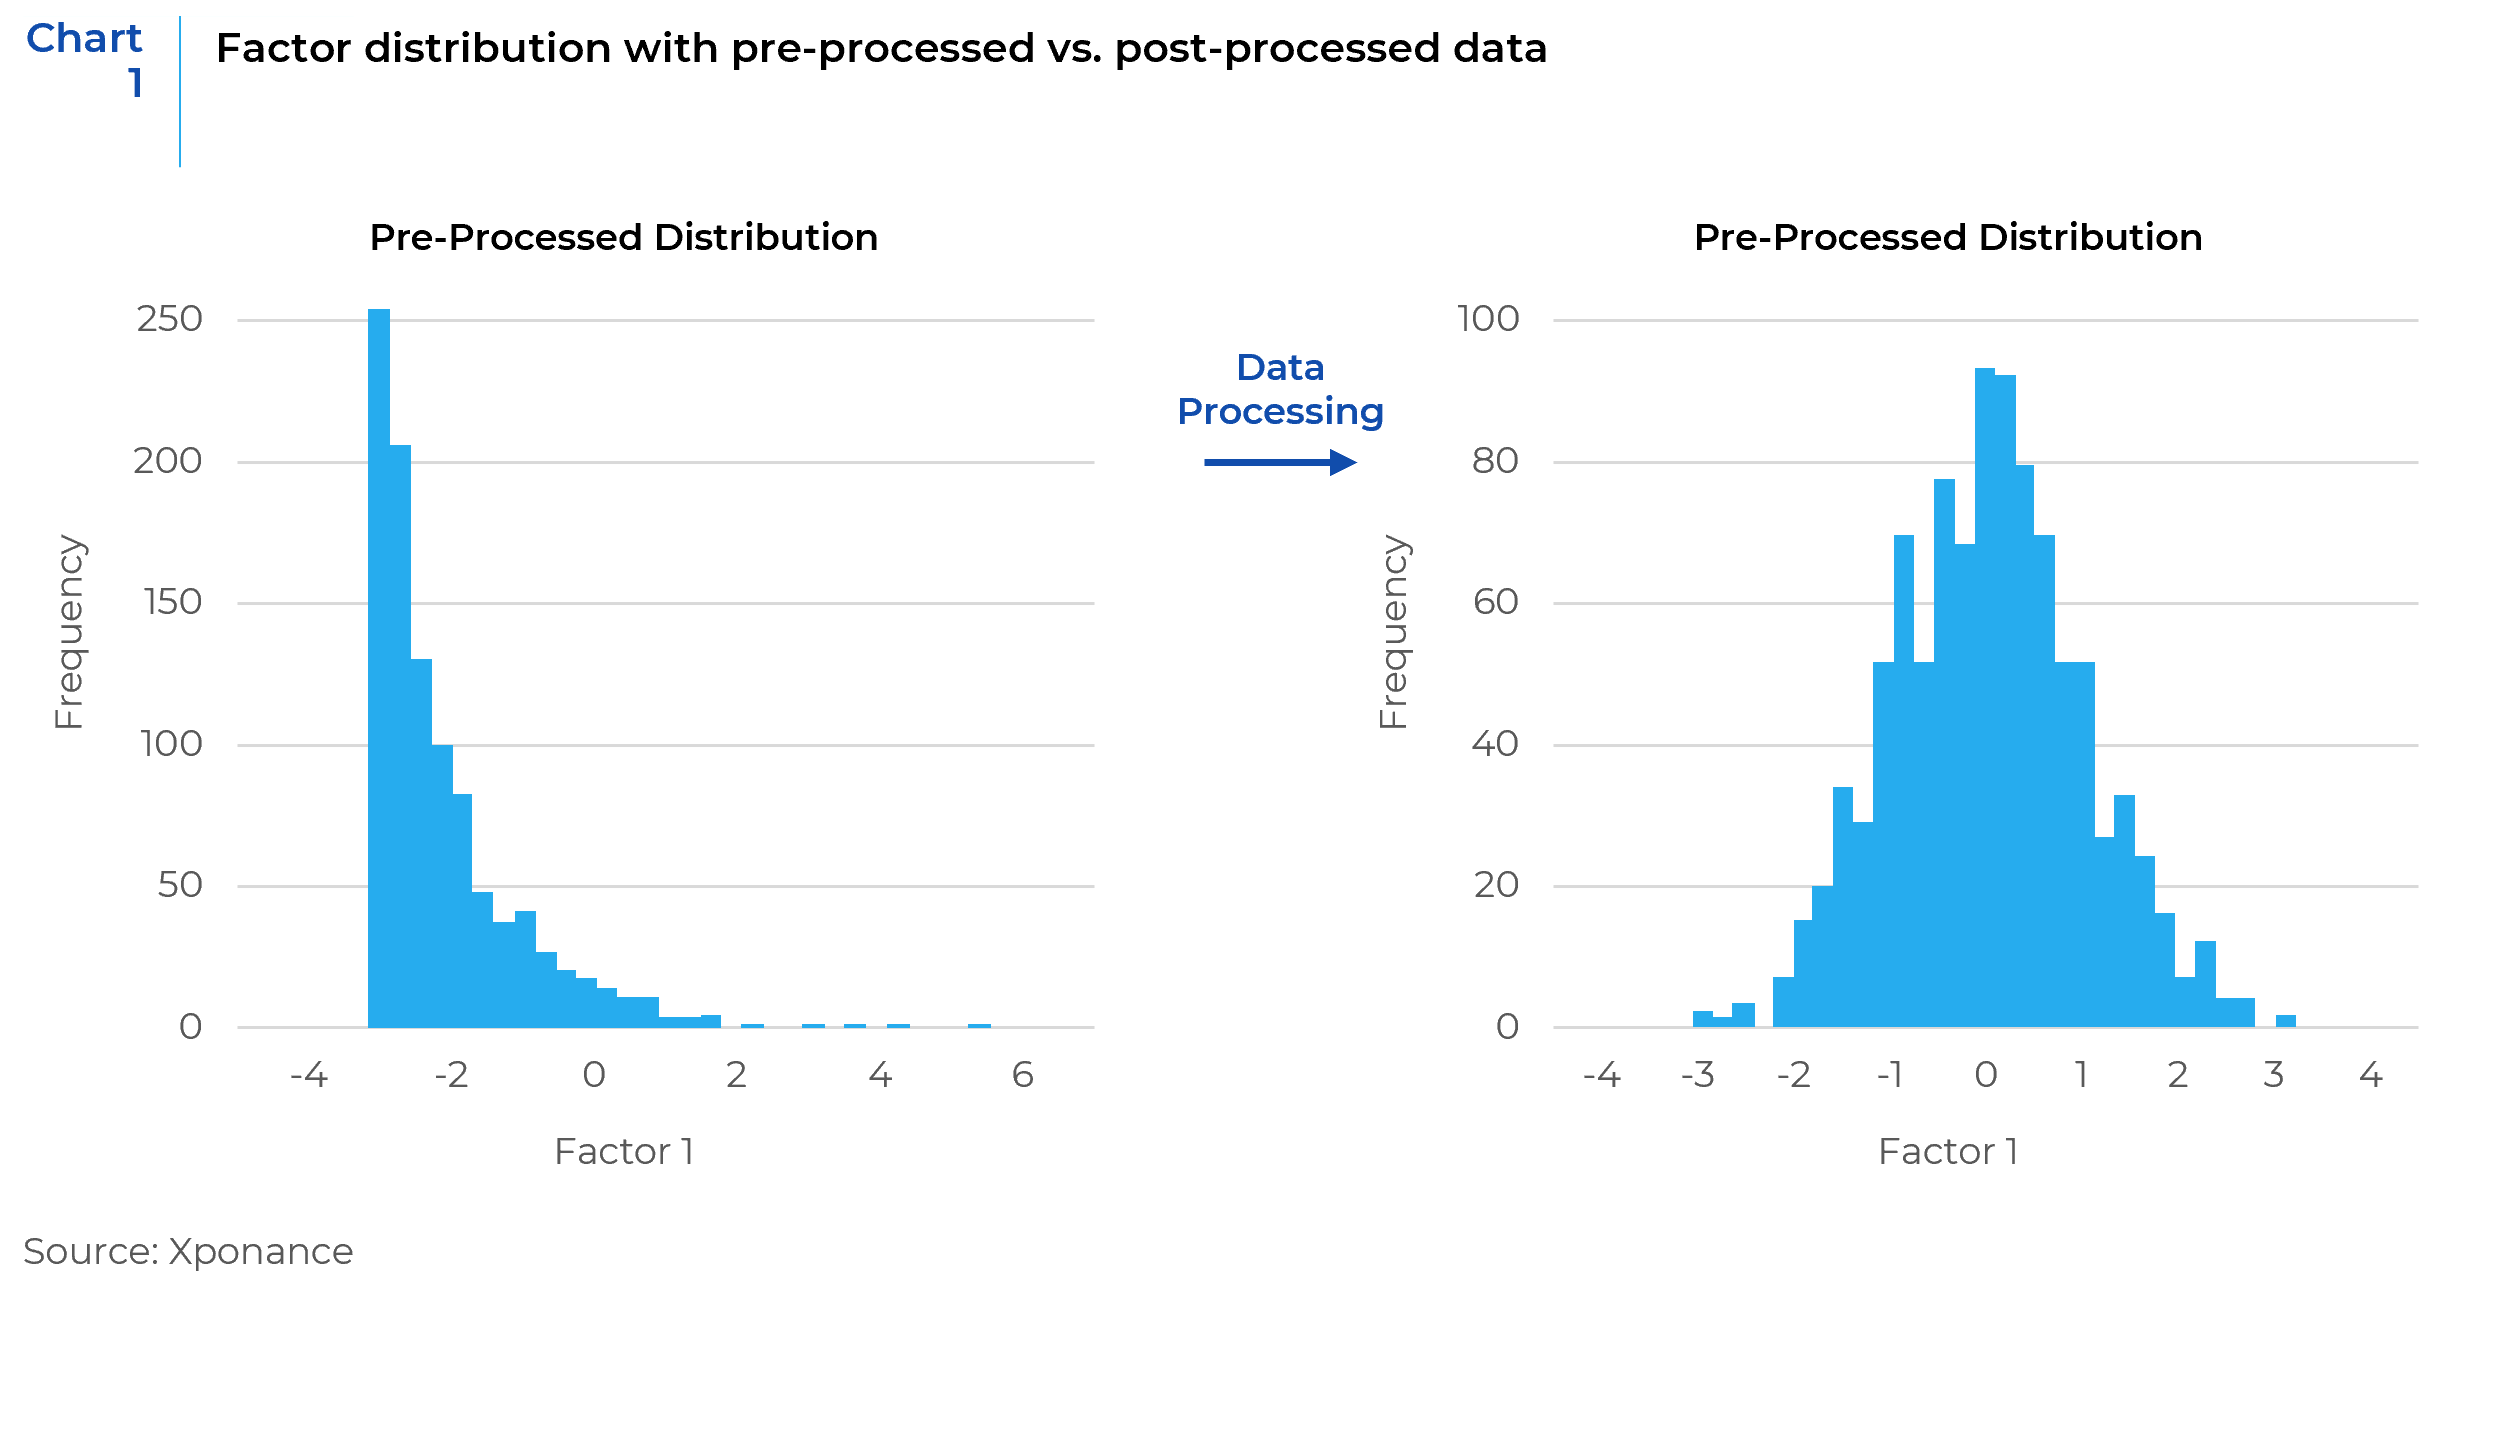
This stage involves examining the percentage of missing data for each factor. Factors with missing data exceeding a certain threshold are excluded from further analysis. This threshold ensures the inclusion of factors in the model based on comprehensive and substantial data, as large gaps in data can compromise the validity of the factor and lead to inaccurate predictions. - Normalization and Scaling
Normalization and scaling start with demeaning using groups like industries or sectors, removing biases between different groups of stocks. Data is then transformed into sector-neutral z-scores to standardize data from different factors, making them comparable. Chart 1 shows the distribution of sample factors from pre- and post-processed data. The processed data shows an approximate normal distribution.
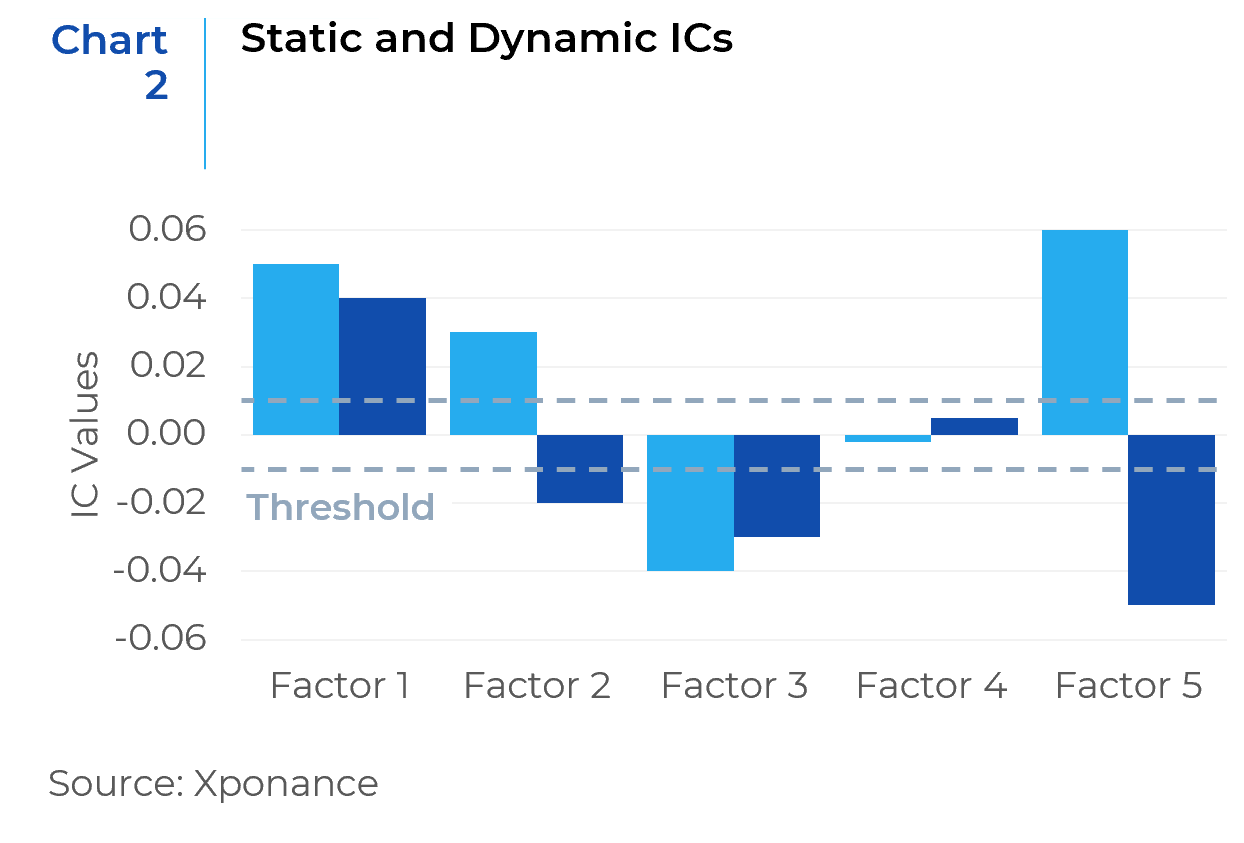
4. Factor Efficacy
The next step involves evaluating the factor efficacy based on the Information Coefficient (IC). The IC is a statistical measure that assesses the strength and direction of the predicted relationship between past factor exposures and future stock returns. Essentially, it’s a correlation coefficient between the factor values and subsequent stock returns, providing insights into how well a factor can predict stock performance.
The sign of the IC is used to validate the ex-ante factor directional impact, and its magnitude measures the significance of the impact. Two versions of IC are computed:
- Long-term Static IC: The first version covers a long period and is designed to assess the factor’s efficacy over the long term.
- Dynamic IC: The second version calculates a rolling period IC, providing insights into the factor’s dynamic performance over time.
Chart 2 presents a bar chart used to examine factor efficacy. For instance, Factor 1 demonstrates both strong, positive static and dynamic ICs, which also aligns with its positive hypothesis, suggesting that the factor should be retained. Conversely, Factor 3, which had a positive hypothesis to start with, shows strong, negative static and dynamic ICs. These trends are contrary to the factor hypothesis, thus indicating that the factor should be removed. Factor 2 presents another scenario where the static and dynamic ICs are in opposite directions. It is important to note that some factors, like this one, drive stock performance positively at times, while at other times, they work in the negative direction. These effects may offset each other over time, resulting in a long-term static IC that appears in the opposite direction. Therefore, factors with strong dynamic ICs, indicative of potential usefulness, might be worth distinguishing and kept in the running. Factor 4 shows that both ICs hover around zero, so a deeper review is needed. For factors with low ICs, one should examine their hypotheses and dynamic IC trends over time. The objective is to differentiate ineffective factors from volatile ones that exhibit strong ICs in some periods but whose overall impact gets offset over time.
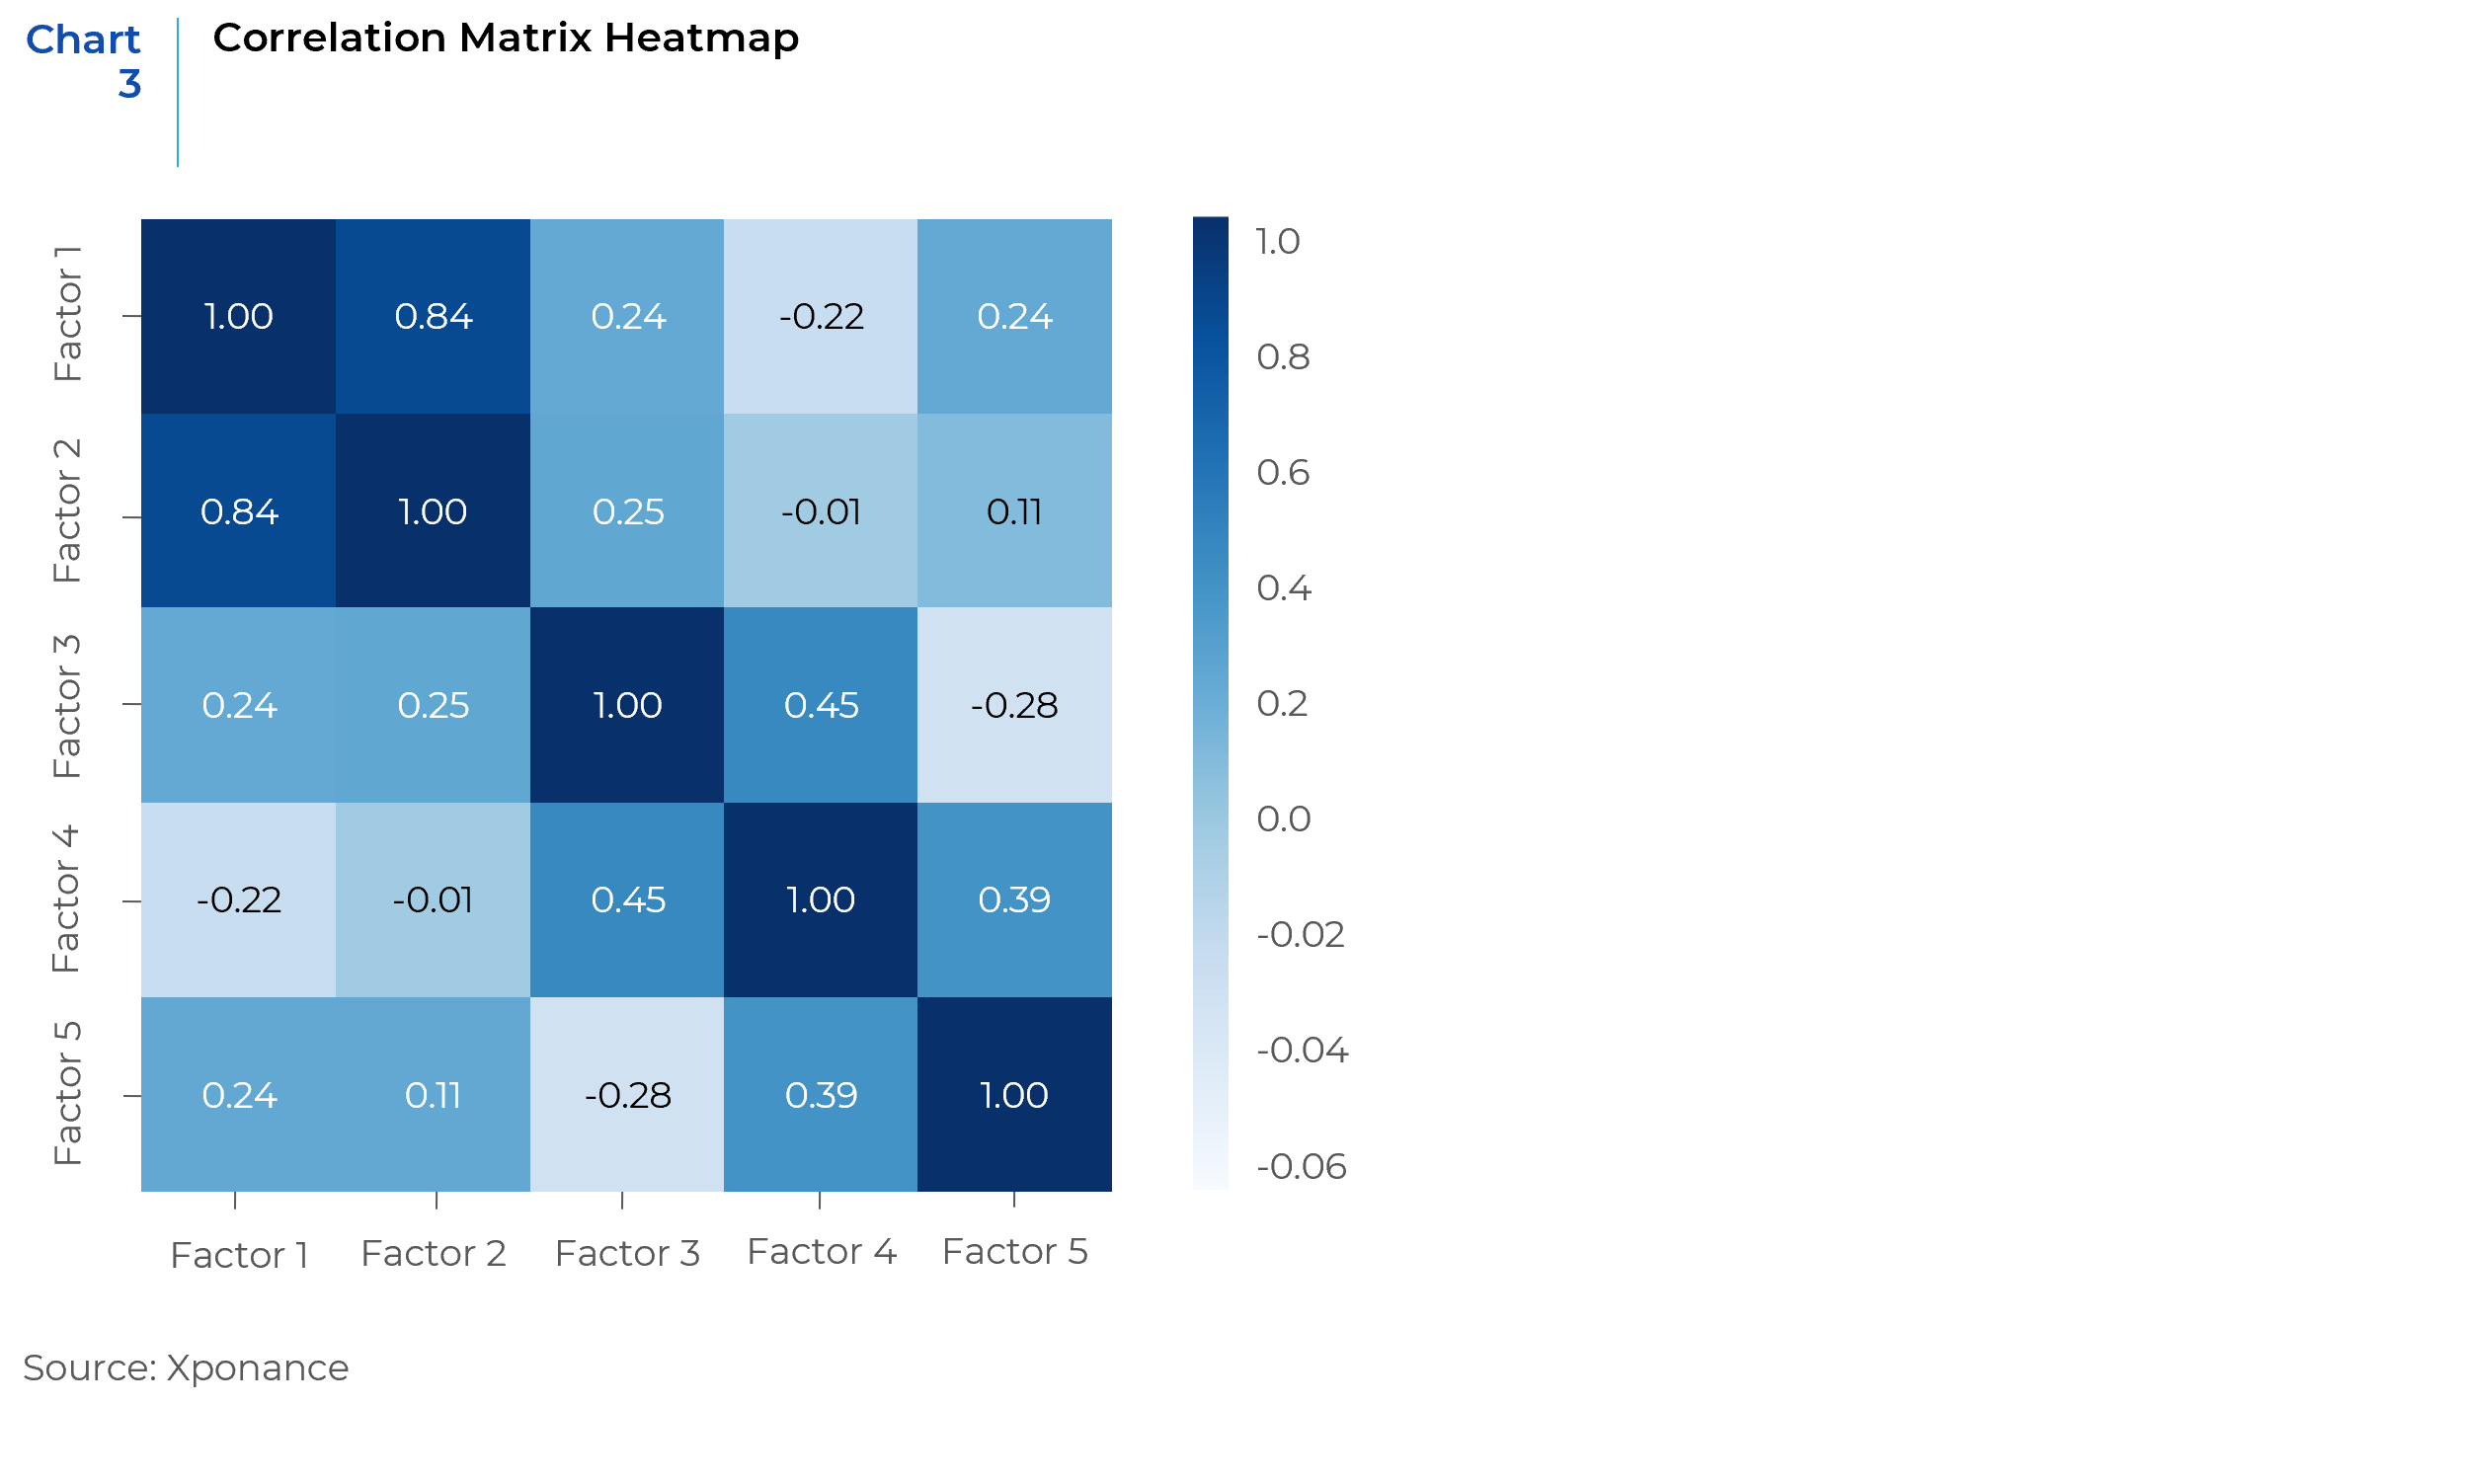
5. Correlation Analysis
Correlation analysis is important in assessing how each factor relates to others and ensuring a diverse yet complementary set of factors in the model. The goal is to avoid redundancy and multicollinearity, which can lead to overfitting and decreased model reliability.
For this purpose, the Spearman rank correlation is employed. Unlike Pearson correlation, which measures linear relationships between variables, Spearman correlation assesses the rank-order relationship. It’s a non-parametric measure and is particularly useful in finance because it can capture non-linear relationships between factors, which are common in financial data.
A comprehensive correlation matrix is generated for all factors to assess the level of complementarity. A threshold should be established to identify highly correlated factor pairs, with a focus on selecting the best candidate among the highly correlated group.
The below correlation matrix heatmap is an illustrative example. Most factors display reasonable correlations, indicating a diverse selection of factors for the model. However, there is a notable exception with Factor 1 and Factor 2 showing high correlation. In such instances, the factor with the higher IC, combined with fewer missing values and outliers, should be selected for retention. This approach ensures that the chosen factors not only provide diverse insights but also maintain high efficacy in the model.
Conclusion
This article provides a general framework for a factor vetting process. Each one of the steps can be further customized and expanded. Factor vetting is a meticulous blend of quantitative analysis and qualitative judgment, that ensures each factor’s contribution is not only statistically valid but also fundamentally sound. The systematic process navigates through potential pitfalls such as overfitting and multicollinearity, ensuring that each selected factor stands up to scrutiny both for historical periods and in its predictive power for future trends. The combination of the IC assessment, correlation analysis, and a fundamental overlay creates a robust framework that filters out the noise, leaving a curated set of factors that can withstand the dynamic nature of financial markets. The factor vetting process is indispensable for industry practitioners and offers a profound understanding of the nuances involved in factor selection. The diligence and depth of this process don’t just add value to the models—it instills confidence in the decisions they inform, providing a sturdy foundation for future investment success.