During the second half of 2019, the late cycle bull market for financial risk assets sprinted to the finish line despite lackluster global growth. Global markets ended the year on a bullish note, with the U.S. S&P 500 climbing to another record close.
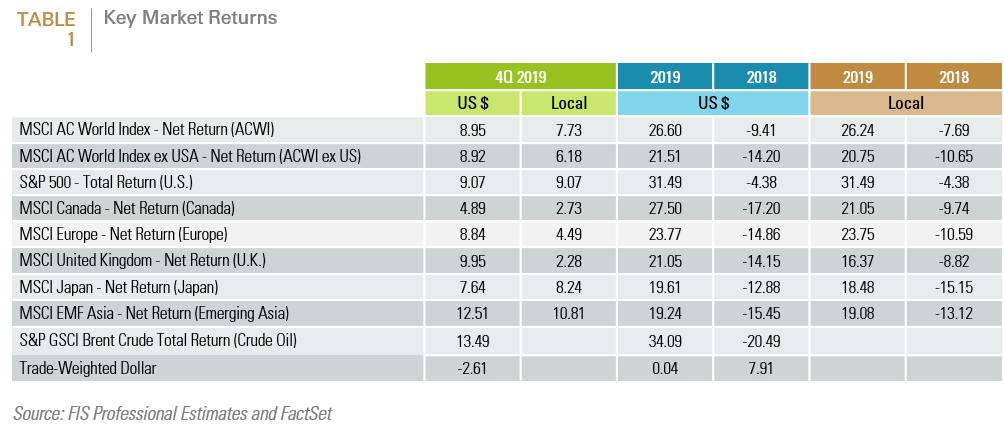
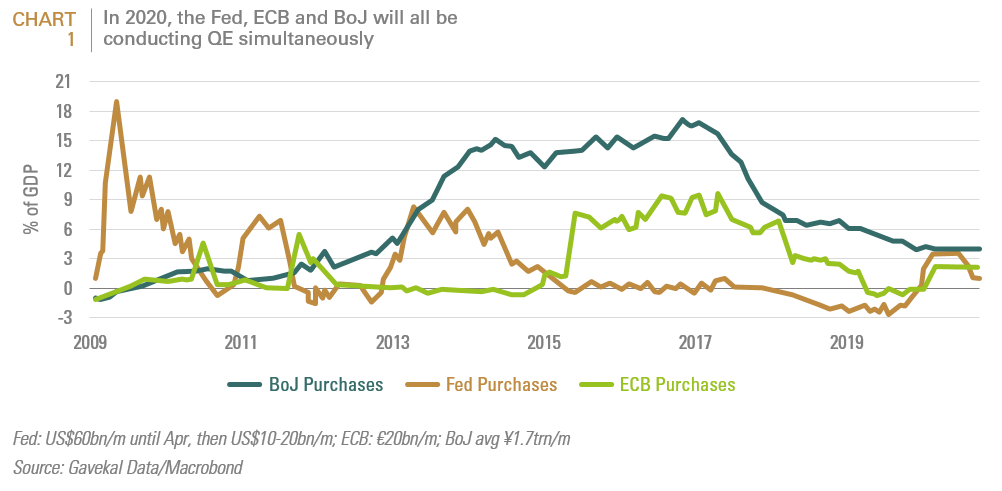
For much of 2019, market volatility was driven by recession fears prompted by the yield curve’s inversion in the spring/early summer; dramatic volte-faces on the Sino-U.S. strategic rivalry, and uncertainty over Brexit. In July, Chairman Powell reversed course and in total cut the Fed Funds rate by 25 basis points three times. From August through the balance of the year, global equity markets made handsome gains, with the U.S., eurozone and Asia all generating total returns of around 8%. (See TABLE 1). These gains have been propelled by further monetary easing and the synchronous resumption of central bank asset purchases in the U.S. and the eurozone, (see CHART 1).
View Full Report | PDF & Print Version
Watch Video Update
Q1 2020 Market Outlook: Text Version Only
Market Outlook Q1 2020
Saved by Jerome: A Second Wind for the Late Cycle Rally
Recap of 2019 for Financial Markets in Pictures
During the second half of 2019, the late cycle bull market for financial risk assets sprinted to the finish line despite lackluster global growth. Global markets ended the year on a bullish note, with the U.S. S&P 500 climbing to another record close.
For much of 2019, market volatility was driven by recession fears prompted by the yield curve’s inversion in the spring/early summer; dramatic volte-faces on the Sino-U.S. strategic rivalry, and uncertainty over Brexit. In July, Chairman Powell reversed course and in total cut the Fed Funds rate by 25 basis points three times. From August through the balance of the year, global equity markets made handsome gains, with the U.S., eurozone and Asia all generating total returns of around 8%. (See Table 1). These gains have been propelled by further monetary easing and the synchronous resumption of central bank asset purchases in the U.S. and the eurozone, (see Chart 1).
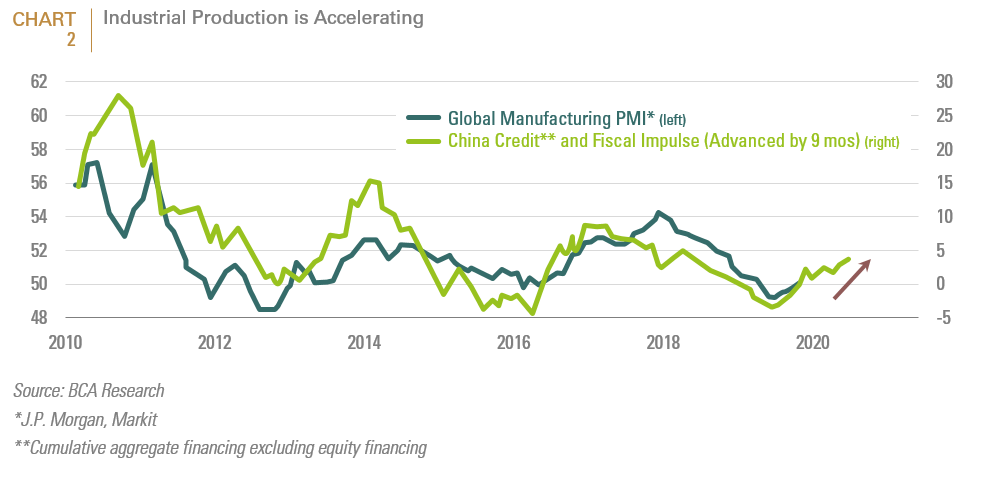
Moreover, two key sectors that have dragged down industrial production—electronics and autos—have bottomed, and manufacturing activity is picking up (see Chart 2).
In most (but not all) respects, the cyclical rally in global equities was consistent with the late cycle rally we forecast last January when optimism was in scarce supply. Last year we stated that:
“In 2019, global leading indicators herald a soft spot for the first half of 2019. In the U.S., where leading indicators dipped in November but are still consistent with above-trend growth, we expect growth to slow to around 2% to 2.5% in 2019, as the fiscal policy impetus from the 2017 tax law diminishes. (Notably, if it makes it to July 2019, the current U.S. economic expansion will have been the longest on record). Recession risk in the U.S. remains low for now, but if this changes it would likely trigger another leg down in equities, setting the scene for what would ultimately be one of the best buying opportunities in years.
Further rises in interest rates combined with a slowdown in global trade and Chinese growth remains a headwind for non-U.S. economies and earnings. However, these slowing growth trends in the rest of the world (RoW) which began in 2018 and are likely to bottom out in the second half of 2019, while U.S. growth is set to roll over. Emerging Markets will become more attractive when the U.S. dollar, which has traded sideways recently, softens, and Chinese reflation stems the decline in credit and industrial production.”
During the holiday season, investors received a double dose of good cheer, with British voters delivering the Tories a huge majority enabling the UK’s swift exit from the EU; and U.S. and Chinese negotiators finally announcing a trade deal that will roll back tariffs. Risk assets, sterling and the euro rallied on the election news, but were more cautious about the trade deal, whose initial details were scarce. Even so, there is now a good chance that the two major uncertainties weighing on markets for the past two years will be much reduced. With major central banks all printing money simultaneously for the first time since the financial crisis, and fiscal policy easing at the same time, there are good reasons to believe the rally will be sustained into 2020.
Moving forward into 2020, the two main questions that we receive from clients are:
- whether the broad rally in risk assets can continue, and
- whether the outperformance of U.S. assets versus the rest of the world will persist.
With respect to the first question, we expect that the global equity rally can go on, because for the first time in over a decade all the world’s major economic blocs are easing monetary policy, and fiscal policy settings are neutral to positive across the board. This does not mean that the continuation of a risk-on rally will not face policy or geopolitical speed bumps. The “phase one” U.S.-China trade deal gives both sides incentives to avoid the economic damage from further tariff escalation. However, the agreement falls far short of achieving the U.S. goal of forcing China to change its state-led economic system. The proposed deal defers, indefinitely, levies on around US$160bn of Chinese imports that were threatened for December 15, and cuts in half—to 7.5%—the tariff imposed on September 1 on US$120bn of Chinese goods. But it does not touch the 25% tariff on US$250bn of other Chinese shipments to the U.S., and leaves open the possibility that tariffs could be hiked again (under a “snap-back” provision) if the U.S. judges that China has failed to meet its commitments. Importantly, it will do nothing to stop further escalation of the two countries’ technology war. In sum, the macroeconomic uncertainty created by U.S.-China tensions have diminished, but will probably return over the long-term. More recently, the early January killing of the most prominent commander of Iran’s Revolutionary Guards by a U.S. missile attack—and the 3% spike in the oil price it triggered—is a sharp reminder that geopolitical risks have not gone away. Nevertheless, the fundamental picture remains favorable.
The second question is the subject of an in-depth research paper which we plan to distribute shortly. Our January 2019 forecast that ex-U.S. equities would outperform U.S. equities in the second half of the year proved to be premature, as only toward the final quarter did non-U.S. markets begin to gain relative ground. The relative performance of U.S. equities in 2019 capstones their decade long outperformance since the GFC (see Chart 3).
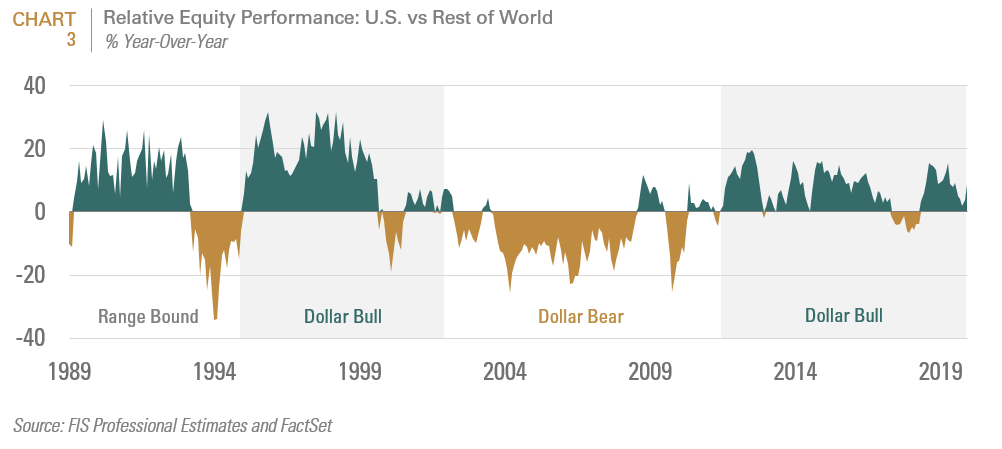
Over the last 10 years, U.S. equities have outperformed developed and emerging market equities (except for a brief interlude in 2017) by an annualized 10%. (See Chart 3). The chart demonstrates that the performance leadership between U.S. and non-U.S. equities changes on roughly ten-year cycles; that in turn, correlate with 10-year trends in the performance of the U.S. dollar. Our forthcoming research paper, Will U.S. Equities Continue to Trounce Non-U.S. Equities, posits that several of the cyclical and secular factors that have propelled U.S. equities’ performance leadership will become increasingly challenged.
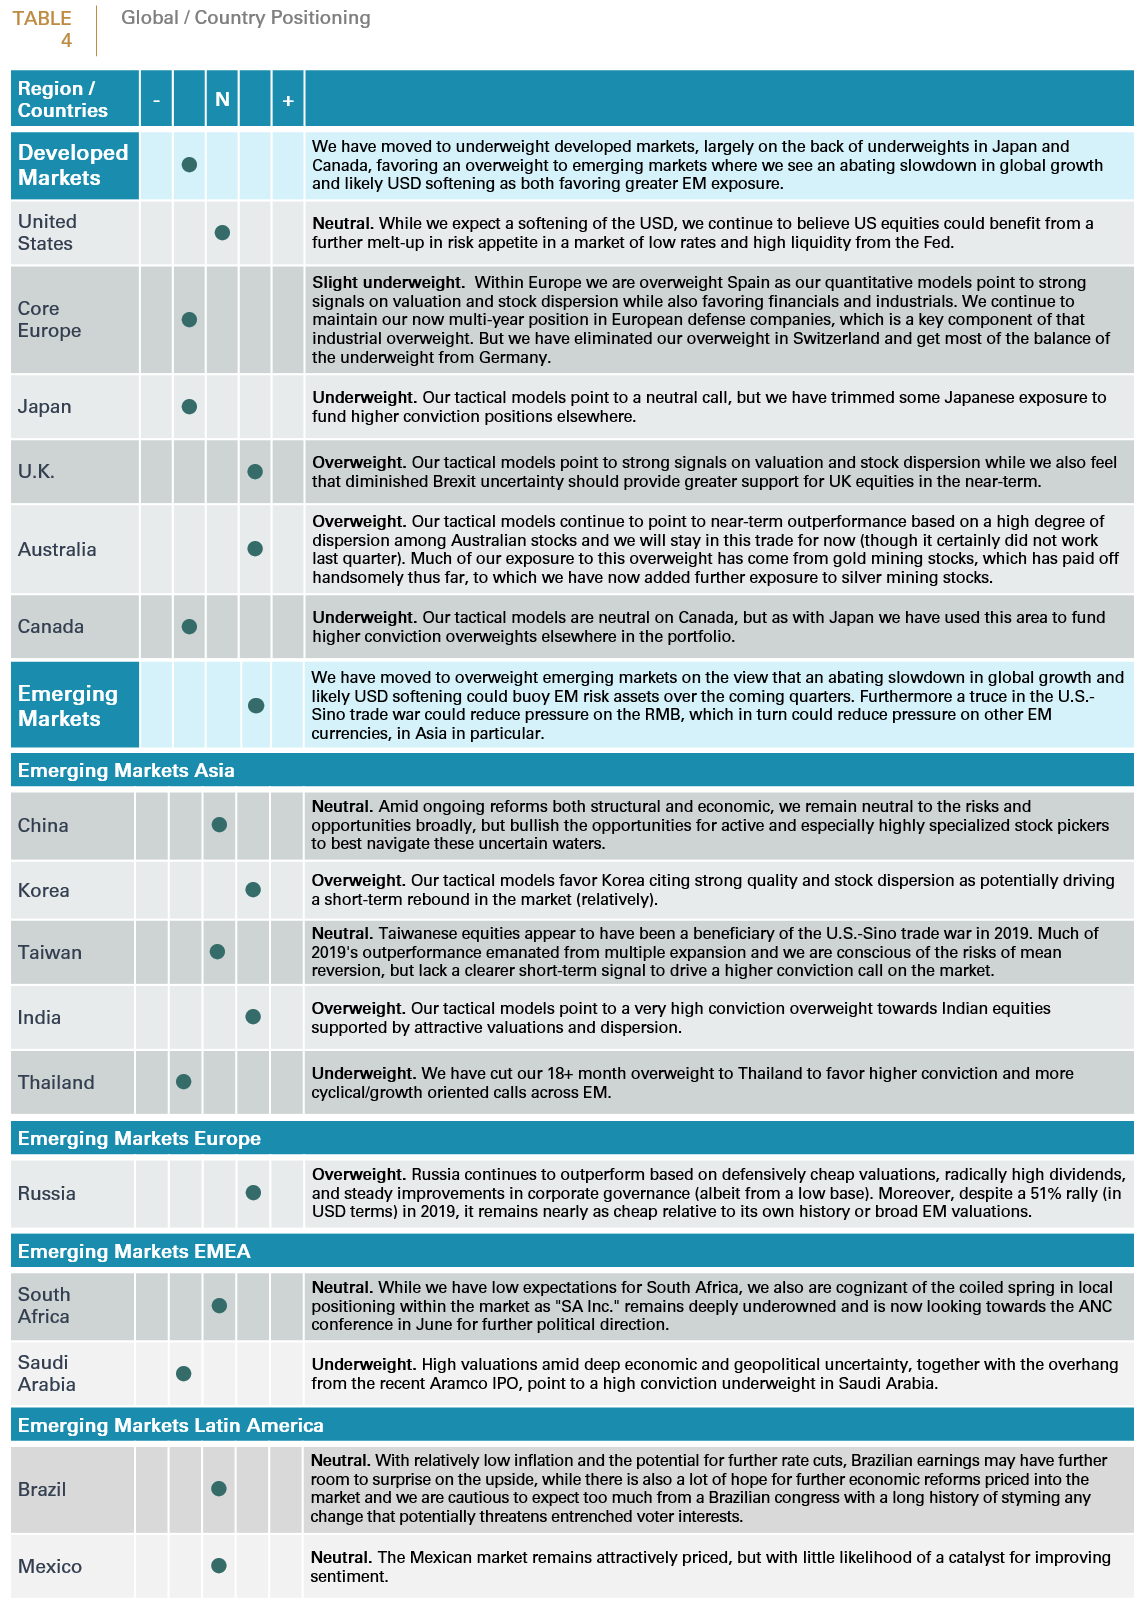
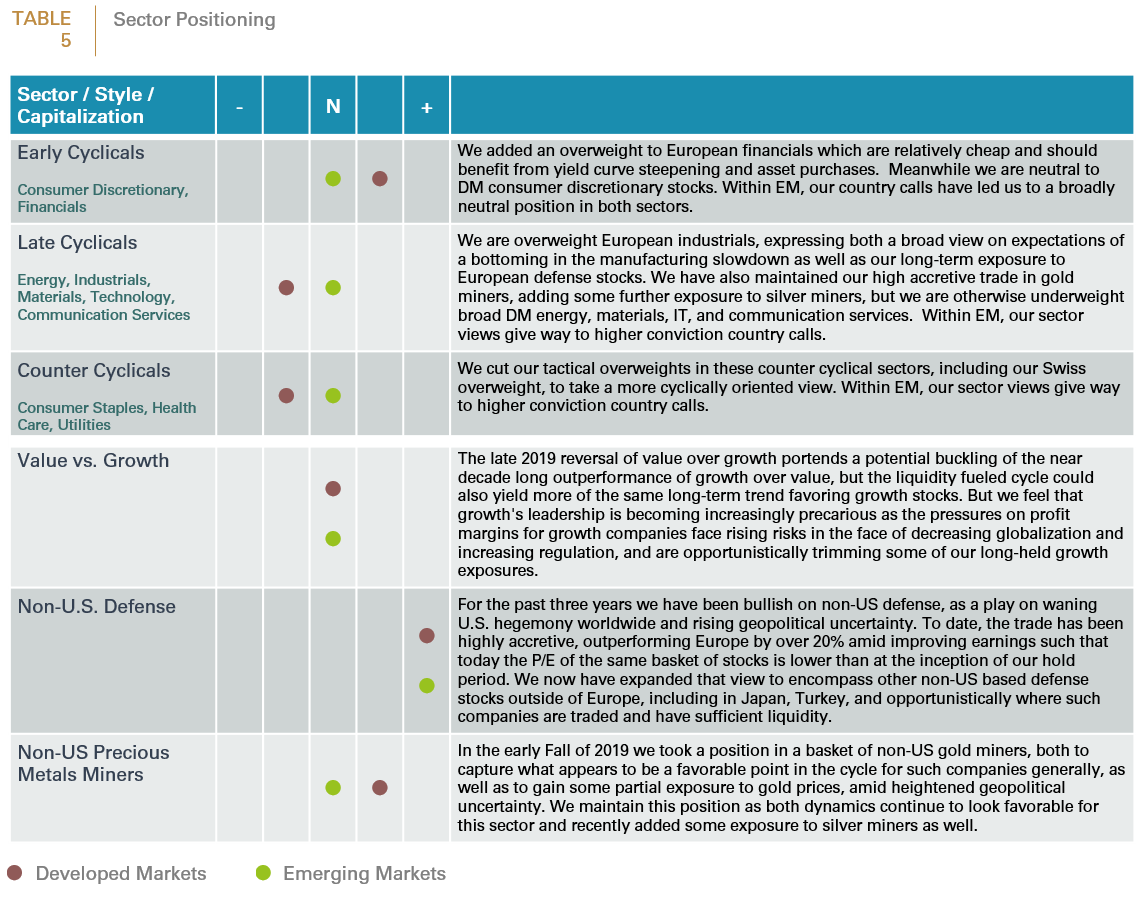
Tables 4 and 5 delineate our portfolio positioning on a country and sector basis. Most notably, we have initiated an overweight to emerging markets, our first in a few years, as we believe that an abating slowdown in global growth and likely USD softening could buoy EM risk assets over the coming quarters. Within EM, we maintain our long-held Russia overweight, where despite the huge outperformance of Russian equities over the past two years, the market remains nearly as inexpensive relative to its own history or broad EM, at an even higher dividend, with further increases in the dividend expected to come in 2020-21. We are also overweight Korea and India, as our tactical models cite attractive market dispersion characteristics in both markets as well as (relatively) good quality and valuation, respectively. Our largest underweight is to Saudi Arabia, which looks both expensive and risky to us. Within developed markets, we are overweight the UK and Australia, as our tactical models give us strong near-term signals, and use neutral tactical views and soft fundamental views on Japan, Canada, and Germany to fund higher conviction calls elsewhere. We have also positioned our portfolios more pro-cyclically with overweights to European industrials and financials, and generally underweight most other sectors. We also continue to hold our now three-year-old portfolio of European defense manufacturers and contractors (a play on heightened geopolitical uncertainty as we transition to a multipolar world), which has outperformed the MSCI EAFE index by over 21% since inception. Finally, as a ballast against resurging geopolitical uncertainty as well as falling real yields, and a depreciating U.S. dollar, we maintain a modest exposure to global gold mining companies. Since the inception of the gold miners trade in mid-August, we have generated 2.3% in excess return relative to the weighted average of these securities’ relevant country indices (50% Canada/50% Australia).
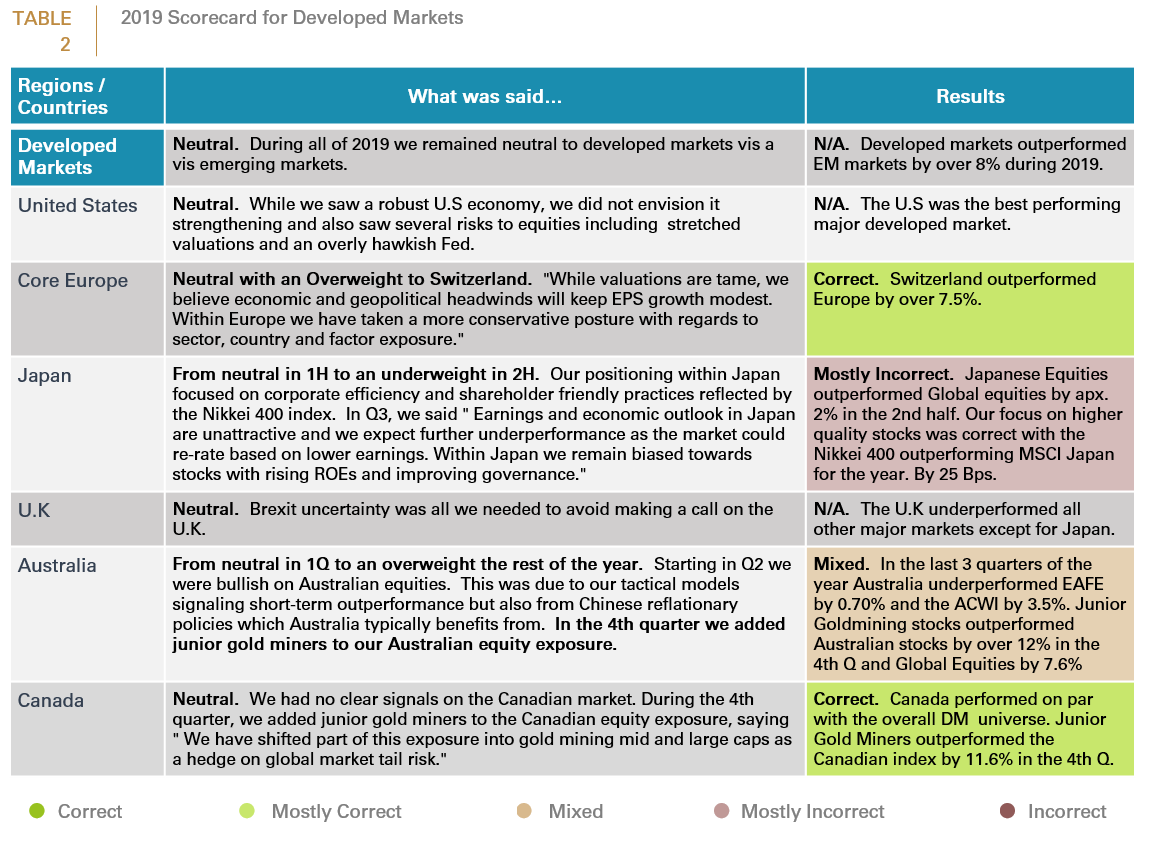
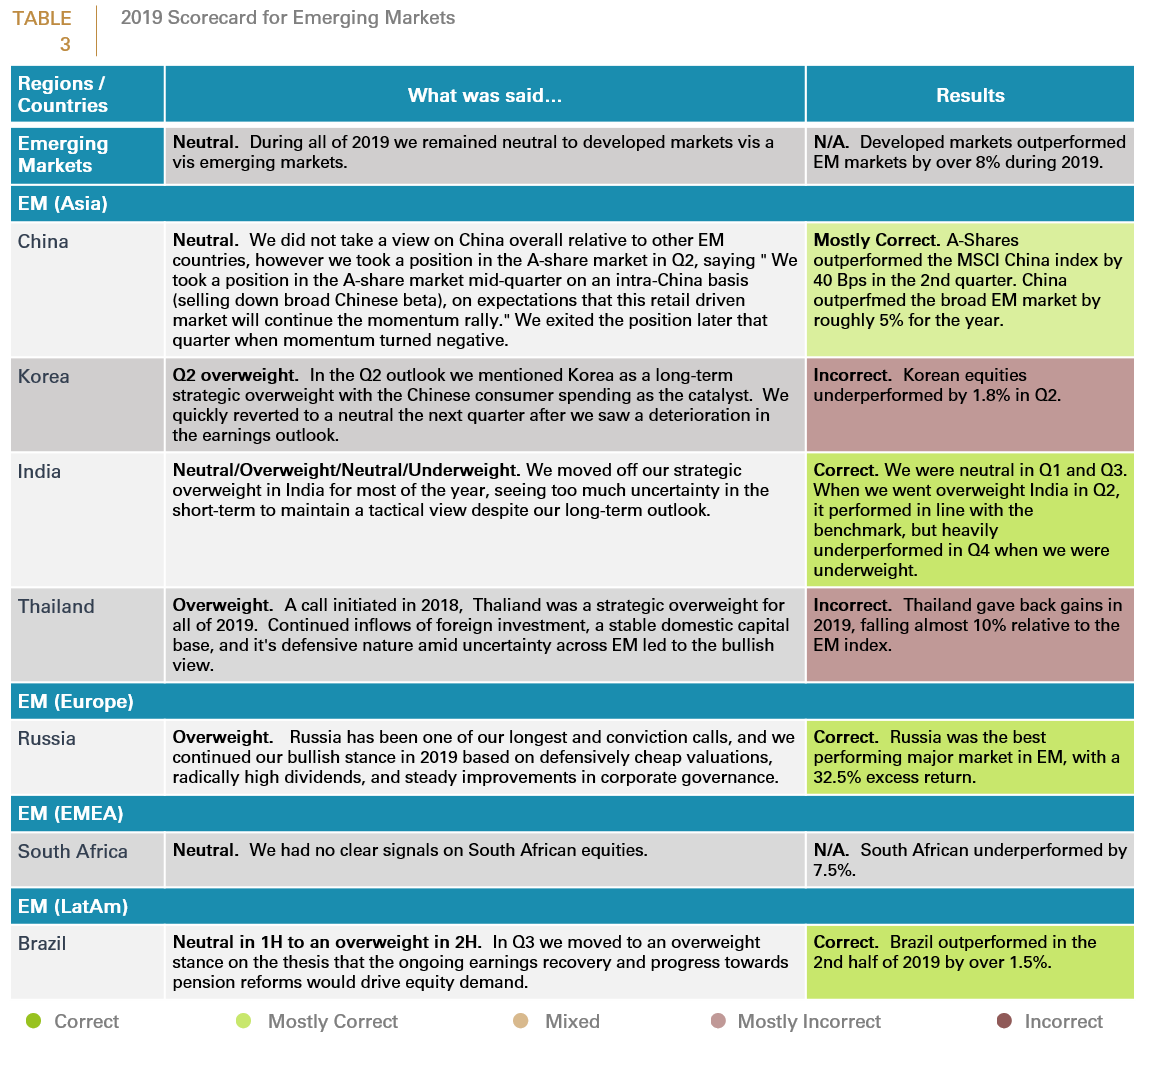
Tables 2 and 3 is our own report card of our tactical calls in 2019. Of the markets where we made significant calls throughout the year, we got 5 correct, 2 incorrect, and 2 with mixed results. Our positioning in Core Europe, which accounts for the largest single geographic exposure where we made active calls in 2019, was one of our big winners, while our losers were in much smaller Korea and Thailand, so we assign ourselves a B+ for the year. In core Europe, our overweight to Switzerland and the sector positioning that came with it yielded over 7.5% excess while our basket of European defense stocks had its best year yet delivering nearly 13% excess returns. In the latter half of the year we took a healthy position in a basket of non-U.S. gold miners, which led to overweights in Australia and Canada, and that trade was highly accretive relative to both those local markets and global markets at large. Within EM, our long-term overweight in Russia paid off very handsomely yielding a healthy 32.5% excess return.
Important Disclosures:
This report is neither an offer to sell nor a solicitation to invest in any product offered by FIS Group, Inc. and should not be considered as investment advice. This report was prepared for clients and prospective clients of FIS Group and is intended to be used solely by such clients and prospects for educational and illustrative purposes. The information contained herein is proprietary to FIS Group and may not be duplicated or used for any purpose other than the educational purpose for which it has been provided. Any unauthorized use, duplication or disclosure of this report is strictly prohibited.
This report is based on information believed to be correct, but is subject to revision. Although the information provided herein has been obtained from sources which FIS Group believes to be reliable, FIS Group does not guarantee its accuracy, and such information may be incomplete or condensed. Additional information is available from FIS Group upon request.
All performance and other projections are historical and do not guarantee future performance. No assurance can be given that any particular investment objective or strategy will be achieved at a given time and actual investment results may vary over any given time.