
Machine learning (ML) has emerged as a valuable tool for quantitative equity investors. With equity markets producing vast streams of data from corporate fundamentals to market prices, sentiment, and alternative datasets, ML offers the ability to uncover subtle, nonlinear relationships that traditional linear factor models might overlook. By capturing complex interactions between predictive factors, ML techniques can potentially provide an edge in forecasting returns. However, financial data is notoriously noisy and non-stationary, meaning that models must be carefully validated to avoid overfitting patterns that do not persist in the real world. The most effective applications balance statistical sophistication with economic intuition, ensuring that signals make financial sense and remain robust across market regimes. This topic was introduced in two previous papers – Introduction to Machine Learning and Machine Learning in Investment Management. In this post we revisit the popular algorithms used for stock selection and their strengths and weaknesses.
Decision Trees
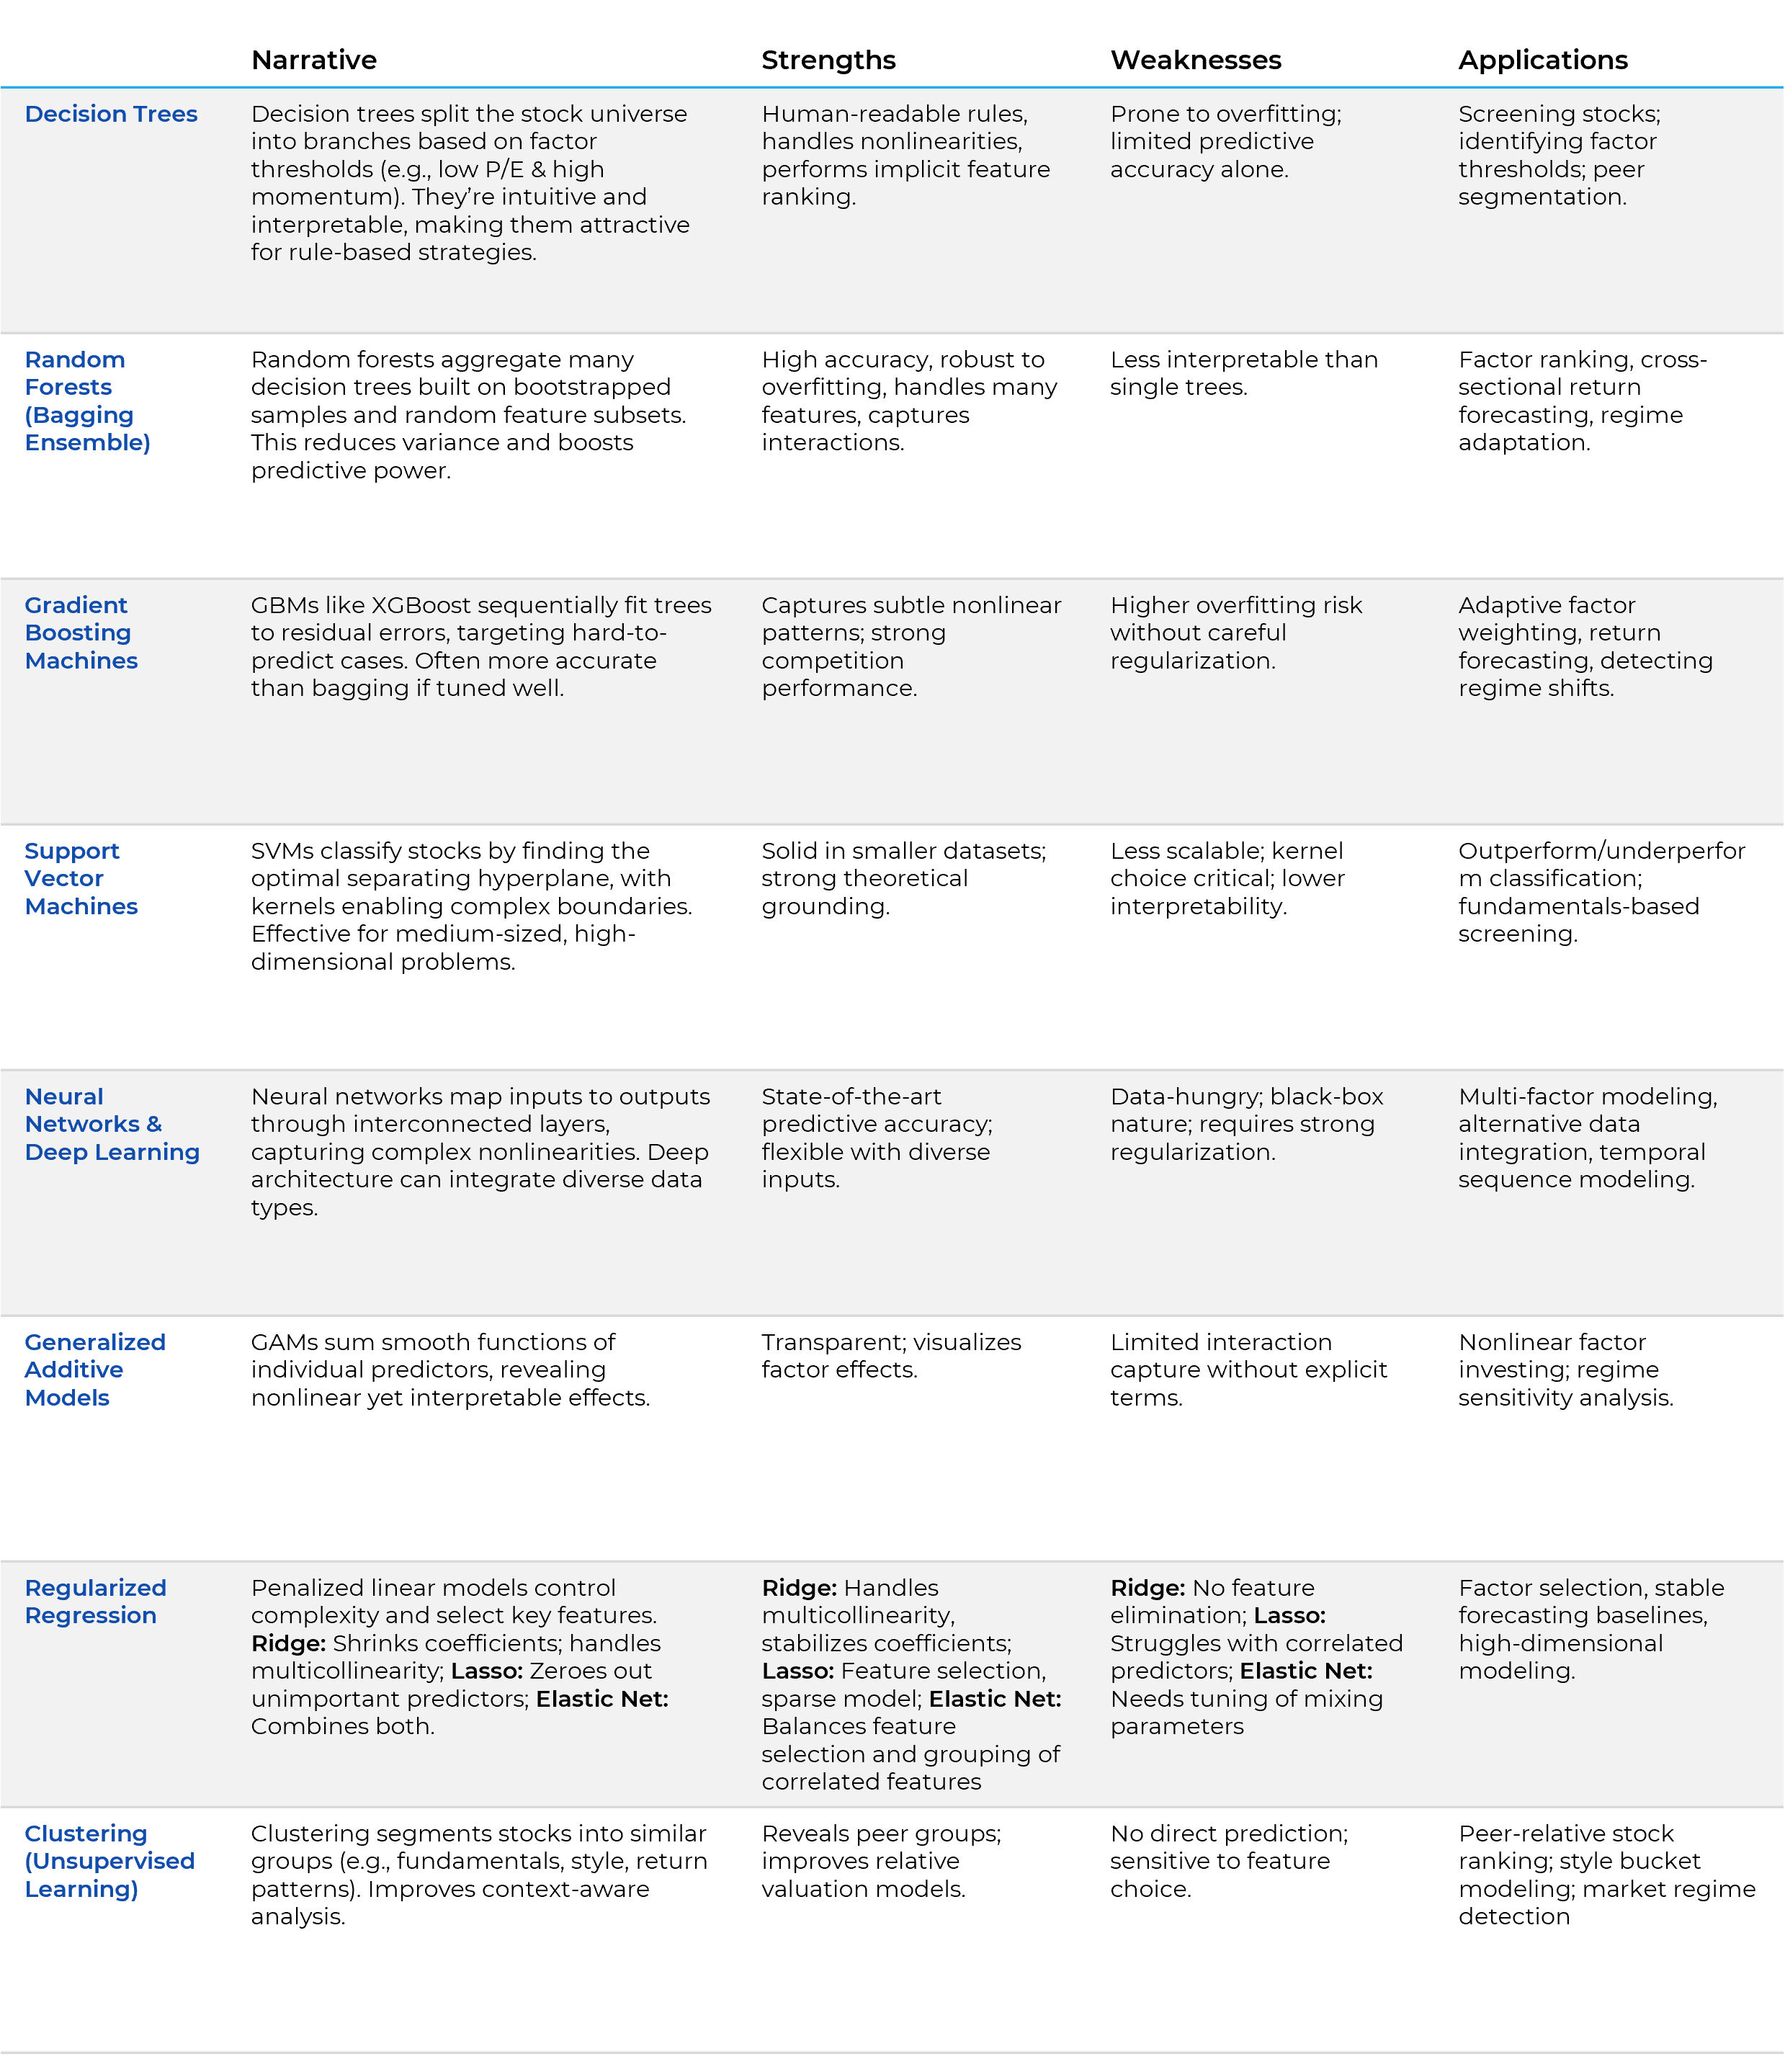
Decision trees are among the most intuitive ML methods, segmenting the stock universe into groups defined by specific factor thresholds. For example, a tree might identify that stocks with low price-to-earnings ratios and high momentum tend to outperform. This branching structure makes them interpretable and easy to translate into investment rules. Decision trees implicitly rank features by importance, as variables chosen for early splits typically explain more variation in the target. Despite their transparency, single trees are prone to overfitting if grown too deep and often require pruning to generalize well. Still, when carefully constructed, they can isolate useful combinations of characteristics, as shown in studies where tree-based portfolios outperformed benchmarks.
Random Forests
Random forests address the instability of single trees by building many trees on bootstrapped samples and averaging their predictions. This ensemble approach reduces variance, improves accuracy, and captures nonlinear relationships without excessive overfitting. In stock selection, random forests can handle large sets of factors, naturally down-weighting irrelevant ones, and reveal which variables are most predictive via feature importance metrics. Empirical evidence from various markets shows that random forest-based strategies can produce strong risk-adjusted returns, often outperforming traditional models. Their ability to model complex interactions—such as the combined effect of earnings growth and insider activity—adds further value.
Gradient Boosting Machines
Gradient boosting takes a different ensemble approach, training trees sequentially so that each new tree focuses on correcting errors made by the existing ensemble. Methods like XGBoost and LightGBM often achieve higher predictive accuracy than bagging methods when tuned well, making them popular in both academic and industry applications. Boosted models excel at uncovering subtle patterns and adapting factor importance over time, though they require careful regularization to avoid overfitting. In stock selection, gradient boosting has been shown to detect shifts in market drivers, adjusting predictions to reflect changing relationships between factors.
Support Vector Machines
Support Vector Machines (SVMs) classify stocks by finding the optimal boundary that separates outperformers from underperformers, maximizing the margin between classes. Through the use of kernels, SVMs can capture nonlinear relationships, and their regression variant (SVR) predicts continuous returns. SVMs have historically performed well in directional forecasting, especially for short- to medium-term horizons, and can be effective when the dataset contains many features but relatively few observations—common in finance. While less interpretable than trees, SVMs provide clear decision boundaries and can serve as a useful confirmation tool alongside other models.
Neural Networks and Deep Learning
Neural networks offer unmatched flexibility in modeling complex, nonlinear patterns. By processing inputs through layers of interconnected “neurons,” they can integrate diverse data types and identify intricate interactions among factors. Deep learning models—such as recurrent networks for time-series data or autoencoders for feature extraction—have demonstrated state-of-the-art performance in cross-sectional return prediction. Research has shown that neural networks can outperform traditional and ensemble methods when sufficient data is available. However, they require rigorous regularization to avoid overfitting and often operate as “black boxes,” making interpretability a challenge. Tools such as SHAP values and partial dependence plots are increasingly used to open this black box.
Generalized Additive Models
Generalized Additive Models (GAMs) provide a balance between flexibility and interpretability by modeling the target as the sum of smooth functions of each predictor. In stock selection, GAMs can capture nonlinear factor effects—such as diminishing returns to momentum or a plateau effect in valuation—while still making each factor’s influence transparent. This clarity makes them appealing in professional settings where model reasoning must be explained to stakeholders. Although GAMs do not inherently capture interactions unless explicitly included, they can refine traditional factor models by revealing more realistic shapes of factor-return relationships.
Regularized Regression
Regularized linear models improve on ordinary regression when faced with many correlated predictors. Ridge regression stabilizes coefficient estimates by shrinking them toward zero, making it ideal for retaining all features while reducing their influence. Lasso regression performs feature selection by setting some coefficients exactly to zero and is used when some predictors are irrelevant and need to be removed. Elastic net combines both approaches, balancing groups of correlated predictors with feature selection. In stock selection, these methods identify the most relevant factors from large candidate sets, reduce noise, and often match the performance of more complex models when relationships are mostly linear. Their interpretability and stability make them strong benchmarks for evaluating other ML strategies.
Clustering
Clustering, an unsupervised technique, segments stocks into peer groups based on shared characteristics such as fundamentals, style profiles, or return patterns. This segmentation allows for context-aware comparisons—valuing a company relative to its true peers rather than the entire market—and can improve predictive modeling by accounting for structural differences across groups. Applications include style-based modeling, peer-relative ranking, and market regime detection. Clustering enhances the ability to detect mispricing that might be obscured when analyzing the market as a whole.
Summary Table
Conclusion
ML enriches stock selection by extending beyond linear models to capture interactions, nonlinearities, and context-specific effects. The optimal approach blends algorithms with financial expertise, using validation, interpretability tools, and economic reasoning to ensure robustness and trust. In practice, combining these approaches often yields the best results; for example, clustering the universe before applying a random forest within each segment, or using lasso-selected features as inputs to a neural network. Such hybrids can capture a broader range of patterns and diversify model risk.
Regardless of method, successful ML in stock selection depends on rigorous validation, economic reasoning, and interpretability. Models should be stress-tested across market regimes, benchmarked against simpler alternatives, and supplemented with explanation tools to build trust with decision-makers. When applied with discipline and domain expertise, machine learning can enhance both the precision and adaptability of equity selection strategies, potentially delivering superior investment performance.
This report is neither an offer to sell nor a solicitation to invest in any product offered by Xponance® and should not be considered as investment advice. This report was prepared for clients and prospective clients of Xponance® and is intended to be used solely by such clients and prospective clients for educational and illustrative purposes. The information contained herein is proprietary to Xponance® and may not be duplicated or used for any purpose other than the educational purpose for which it has been provided. Any unauthorized use, duplication or disclosure of this report is strictly prohibited.
This report is based on information believed to be correct but is subject to revision. Although the information provided herein has been obtained from sources which Xponance® believes to be reliable, Xponance® does not guarantee its accuracy, and such information may be incomplete or condensed. Additional information is available from Xponance® upon request. All performance and other projections are historical and do not guarantee future performance. No assurance can be given that any particular investment objective or strategy will be achieved at a given time and actual investment results may vary over any given time.